Free with trial Outlined icon of decrease magnifying glass. With parallel and not parallel long shadows. Decrease line vectors Outlined icon of decrease magnifying glass. With parallel and not parallel long shadows
Free with trial Savings reduction line outline icon. Isolated on white. Vector illustration. Decrease line illustrations Savings reduction line outline icon. Isolated on white. Vector illustration
Free with trial Arrows shape growth and decrease elements with steps,options,processes or workflow. Business data visualization. Decrease line vectors Arrows shape growth and decrease elements with steps,options,processes or workflow.Business data visualization.
Free with trial Percent down line icon. Percentage, arrow, reduction. Banking concept. Can be used for topics like investment, interest rate, finance. Decrease line vectors Percent down line icon. Percentage, arrow, reduction on gray background with soft shadow. Percent down line icon. Percentage, arrow, reduction. Banking concept. Percent down line icon. Percentage, arrow, reduction. Banking concept. Can be used for topics like investment, interest rate, finance
Free with trial Dot plot graph line icon. Neumorphic, Red gradient, 3d pin buttons. Presentation chart sign. Market analytics symbol. Line icons. Neumorphic buttons with outline signs. Vector. Decrease line vectors Dot plot graph line icon. Presentation chart sign. Line icons. Vector. Dot plot graph line icon. Neumorphic, Red gradient, 3d pin buttons. Presentation chart. Dot plot graph line icon. Neumorphic, Red gradient, 3d pin buttons. Presentation chart sign. Market analytics symbol. Line icons. Neumorphic buttons with outline signs. Vector
Free with trial Calendar graph line icon. Neumorphic, Orange gradient, 3d pin buttons. Column chart sign. Growth diagram symbol. Line icons. Neumorphic buttons with outline signs. Vector. Decrease line vectors Calendar graph line icon. Column chart sign. Line icons. Vector. Calendar graph line icon. Neumorphic, Orange gradient, 3d pin buttons. Column chart sign. Growth. Calendar graph line icon. Neumorphic, Orange gradient, 3d pin buttons. Column chart sign. Growth diagram symbol. Line icons. Neumorphic buttons with outline signs. Vector
Free with trial Carbon offset and co2 gas reduction line icon, eps 10 file, easy to edit. Decrease line vectors Carbon offset and co2 gas reduction line icon. Eps 10 file, easy to edit
Free with trial Line arrows left and right. Vector illustration. Decrease line vectors Line arrows left and right. Vector illustration
Free with trial Decrease bar chart icon set. Market crash concept. Market crash illustration concept. Decrease line vectors Decrease bar chart icon set. Market crash concept. Decrease bar chart icon set. Market crash illustration concept
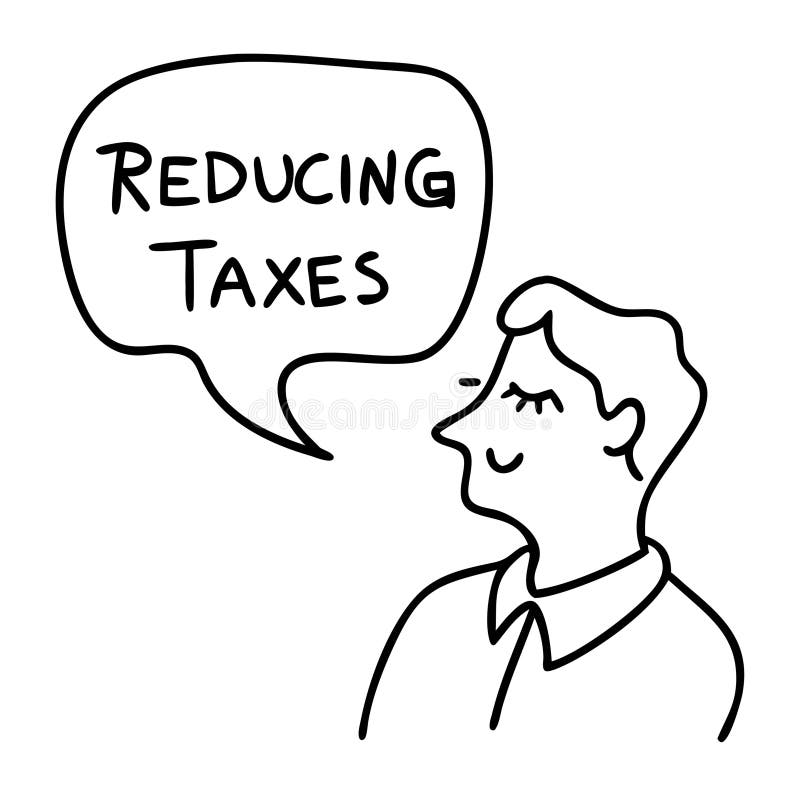
Free with trial This image features a line art vector illustration that represents the concept of tax reduction. It showcases a man talking within a speech bubble, highlighting the ideas of financial advice, savings, and budget planning. The minimalist design effectively communicates a discussion about decreasing costs and government strategy in the economy. Created with AI, this informative graphic portrays a simplistic yet engaging approach to fiscal themes. Decrease line vectors Tax Reduction Concept with Speech Bubble Line Art Vector Illustration. This image features a line art vector illustration that represents the concept of tax. This image features a line art vector illustration that represents the concept of tax reduction. It showcases a man talking within a speech bubble, highlighting the ideas of financial advice, savings, and budget planning. The minimalist design effectively communicates a discussion about decreasing costs and government strategy in the economy. Created with AI, this informative graphic portrays a simplistic yet engaging approach to fiscal themes.
Free with trial Minus remove icon set. Stop sign. Horizontal line, dash inside circle outline and solid for delete actions, reduce functions, deletion, quantity adjustment, interface controls. Decrease line vectors Minus remove icon set. Stop sign. Horizontal line, dash inside circle outline and solid for delete actions, reduce functions. Deletion, quantity adjustment
Free with trial Minus remove icon set. Stop sign. Horizontal line, dash inside circle outline and solid for delete actions, reduce functions, deletion, quantity adjustment, interface controls. Decrease line illustrations Minus remove icon set. Stop sign. Horizontal line, dash inside circle outline and solid for delete actions, reduce functions. Deletion, quantity adjustment
Free with trial Minus remove icon set. Stop sign. Horizontal line, dash inside circle outline and solid for delete actions, reduce functions, deletion, quantity adjustment, interface controls. Decrease line vectors Minus remove icon set. Stop sign. Horizontal line, dash inside circle outline and solid for delete actions, reduce functions. Deletion, quantity adjustment
Free with trial Minus remove icon set. Stop sign. Horizontal line, dash inside circle outline and solid for delete actions, reduce functions, deletion, quantity adjustment, interface controls. Decrease line vectors Minus remove icon set. Stop sign. Horizontal line, dash inside circle outline and solid for delete actions, reduce functions. Deletion, quantity adjustment
Free with trial Minus remove icon set. Stop sign. Horizontal line, dash inside circle outline and solid for delete actions, reduce functions, deletion, quantity adjustment, interface controls. Decrease line vectors Minus remove icon set. Stop sign. Horizontal line, dash inside circle outline and solid for delete actions, reduce functions. Deletion, quantity adjustment
Free with trial Minus remove icon set. Stop sign. Horizontal line, dash inside circle outline and solid for delete actions, reduce functions, deletion, quantity adjustment, interface controls. Decrease line vectors Minus remove icon set. Stop sign. Horizontal line, dash inside circle outline and solid for delete actions, reduce functions. Deletion, quantity adjustment
Free with trial Minus remove icon set. Stop sign. Horizontal line, dash inside circle outline and solid for delete actions, reduce functions, deletion, quantity adjustment, interface controls. Decrease line illustrations Minus remove icon set. Stop sign. Horizontal line, dash inside circle outline and solid for delete actions, reduce functions. Deletion, quantity adjustment
Free with trial Minus remove icon set. Stop sign. Horizontal line, dash inside circle outline and solid for delete actions, reduce functions, deletion, quantity adjustment, interface controls. Decrease line illustrations Minus remove icon set. Stop sign. Horizontal line, dash inside circle outline and solid for delete actions, reduce functions. Deletion, quantity adjustment
Free with trial Minus remove icon set. Stop sign. Horizontal line, dash inside circle outline and solid for delete actions, reduce functions, deletion, quantity adjustment, interface controls. Decrease line illustrations Minus remove icon set. Stop sign. Horizontal line, dash inside circle outline and solid for delete actions, reduce functions. Deletion, quantity adjustment
Free with trial Minus remove icon set. Stop sign. Horizontal line, dash inside circle outline and solid for delete actions, reduce functions, deletion, quantity adjustment, interface controls. Decrease line illustrations Minus remove icon set. Stop sign. Horizontal line, dash inside circle outline and solid for delete actions, reduce functions. Deletion, quantity adjustment
Free with trial Minus remove icon set. Stop sign. Horizontal line, dash inside circle outline and solid for delete actions, reduce functions, deletion, quantity adjustment, interface controls. Decrease line vectors Minus remove icon set. Stop sign. Horizontal line, dash inside circle outline and solid for delete actions, reduce functions. Deletion, quantity adjustment
Free with trial Minus remove icon set. Stop sign. Horizontal line, dash inside circle outline and solid for delete actions, reduce functions, deletion, quantity adjustment, interface controls. Decrease line vectors Minus remove icon set. Stop sign. Horizontal line, dash inside circle outline and solid for delete actions, reduce functions. Deletion, quantity adjustment
Free with trial Minus remove icon set. Stop sign. Horizontal line, dash inside circle outline and solid for delete actions, reduce functions, deletion, quantity adjustment, interface controls. Decrease line illustrations Minus remove icon set. Stop sign. Horizontal line, dash inside circle outline and solid for delete actions, reduce functions. Deletion, quantity adjustment
Free with trial Growth chart line icon. Neumorphic, Blue gradient, 3d pin buttons. Column graph sign. Market analytics symbol. Line icons. Neumorphic buttons with outline signs. Vector. Decrease line vectors Growth chart line icon. Column graph sign. Line icons. Vector. Growth chart line icon. Neumorphic, Blue gradient, 3d pin buttons. Column graph sign. Market. Growth chart line icon. Neumorphic, Blue gradient, 3d pin buttons. Column graph sign. Market analytics symbol. Line icons. Neumorphic buttons with outline signs. Vector
Free with trial Line chart decreae icon Flat line illustration. Line chart decreae icon linear vector graphics sign or symbol set for web app ui. Decrease line vectors Line chart decreae icon Flat line illustration. Line chart decreae icon linear vector graphics sign or symbol set for web app ui
Free with trial Line chart decreae icon Flat line illustration. Line chart decreae icon linear vector graphics sign or symbol set for web app ui. Decrease line vectors Line chart decreae icon Flat line illustration. Line chart decreae icon linear vector graphics sign or symbol set for web app ui
Free with trial A set of sixteen modern line icons depicting various business and finance concepts, including graphs, charts, planning, ideas, and global connectivity. Perfect for presentations, reports, and websites. Decrease line vectors Collection of Business and Finance Line Icons Set. A set of sixteen modern line icons depicting various business and finance concepts, including graphs, charts. A set of sixteen modern line icons depicting various business and finance concepts, including graphs, charts, planning, ideas, and global connectivity. Perfect for presentations, reports, and websites.
Free with trial Elevate your digital interface with this captivating drone-shot line art speaker icon. Perfect for websites and applications, this vector graphic boasts a clean, minimalist design with sharp lines for a modern and professional aesthetic. The aerial perspective adds a touch of sophistication, creating a clear and impactful visual representation of essential audio controls. Easily scalable and. Decrease line illustrations Stunning DroneShot Line Art Speaker Icon Minimalist Volume Control for Modern Web and App Interfaces. Elevate your digital interface with this captivating drone. Elevate your digital interface with this captivating drone-shot line art speaker icon. Perfect for websites and applications, this vector graphic boasts a clean, minimalist design with sharp lines for a modern and professional aesthetic. The aerial perspective adds a touch of sophistication, creating a clear and impactful visual representation of essential audio controls. Easily scalable and
Free with trial Line art illustration shows VR glasses, a plant with upward arrow, steam, and downward arrow. Clean, modern style on a black background. Decrease line vectors Vector illustration of virtual reality glasses with plant and arrow representing growth or decrease. Line art illustration shows VR glasses, a plant with upward. Line art illustration shows VR glasses, a plant with upward arrow, steam, and downward arrow. Clean, modern style on a black background.
Free with trial A red line graph showing a downward trend on a white grid background indicating decline or loss. Generative AI. Decrease line illustrations A red line graph showing a downward trend on a white grid background indicating decline or loss. Generative AI
Free with trial Decrease bar chart icon in generic style. Statistic sign symbol. Illustration. Decrease line vectors Decrease bar chart icon in generic style. Statistic sign symbol. Illustration
Free with trial This compelling red zigzag line graph vividly illustrates a downward market trend, offering a concise yet insightful representation of declining stock prices. The dynamic zigzag pattern clearly highlights fluctuations and sharp drops in the data, making it an ideal tool for visualizing market analysis and economic indicators. The falling red line graph effectively communicates the negative. Decrease line illustrations Analyzing a Declining Market Trend Visualizing Falling Stock Prices with a Red Zigzag Line Graph. This compelling red zigzag line graph vividly illustrates a. This compelling red zigzag line graph vividly illustrates a downward market trend, offering a concise yet insightful representation of declining stock prices. The dynamic zigzag pattern clearly highlights fluctuations and sharp drops in the data, making it an ideal tool for visualizing market analysis and economic indicators. The falling red line graph effectively communicates the negative
Free with trial Pixel icon of decrease magnifying glass. In three variants. Fully editable. Decrease line vectors Pixel icon of decrease magnifying glass. In three variants. Fully editable
Free with trial Percent arrow up and down icon vector in outline style. Percentage increase and decrease arrows sign symbol. Decrease line vectors Percent arrow up and down icon in outline style. Percentage increase and decrease arrows sign symbol. Percent arrow up and down icon vector in outline style. Percent arrow up and down icon vector in outline style. Percentage increase and decrease arrows sign symbol
Free with trial A modern data visualization featuring a line graph and bar chart, ideal for illustrating business trends and performance metrics in reports and presentations. Decrease line illustrations Data visualization with a line graph and bar chart representing trends and comparisons in a clear and modern style for business. A modern data visualization. A modern data visualization featuring a line graph and bar chart, ideal for illustrating business trends and performance metrics in reports and presentations
Free with trial This vibrant line chart illustrates growth and decline trends with colored circles, making it suitable for business presentations, reports, and educational material. Decrease line illustrations Colorful Line Chart Showing Growth and Decline Trends with Green, Yellow, and Red Circles Representing Data Points over Time. This vibrant line chart illustrates. This vibrant line chart illustrates growth and decline trends with colored circles, making it suitable for business presentations, reports, and educational material
Free with trial Report statistics line icon. Neumorphic, Flat shadow, 3d buttons. Column graph sign. Growth diagram symbol. Line report statistics icon. Social media icons. Vector. Decrease line illustrations Report statistics line icon. Column graph sign. Neumorphic buttons. Vector. Report statistics line icon. Neumorphic, Flat shadow, 3d buttons. Column graph sign. Report statistics line icon. Neumorphic, Flat shadow, 3d buttons. Column graph sign. Growth diagram symbol. Line report statistics icon. Social media icons. Vector
Free with trial Decrease Indent Icon. Decrease Indent User Interface Outline Icon Logo Vector Illustration. Decrease line vectors Decrease Indent Icon. Decrease Indent User Interface Outline Icon Logo Vector Illustration
Free with trial Dollar arrow down rate decrease price value finance icon set sign rising business. Vector. Decrease line vectors Dollar arrow down rate decrease price value finance icon set sign rising business. Vector
Free with trial Down graph line icon. Down graph premium line icon. Simple high quality pictogram. Modern outline style icons. Stroke vector illustration on a white background. Decrease line vectors Down graph line icon. Down graph premium line icon. Simple high quality pictogram. Modern outline style icons. Stroke vector illustration on a white background
Free with trial Down graph line icon. Down graph premium line icon. Simple high quality pictogram. Modern outline style icons. Stroke vector illustration on a white background. Decrease line vectors Down graph line icon. Down graph premium line icon. Simple high quality pictogram. Modern outline style icons. Stroke vector illustration on a white background
Free with trial Down graph line icon. Down graph premium line icon. Simple high quality pictogram. Modern outline style icons. Stroke vector illustration on a white background. Decrease line vectors Down graph line icon. Down graph premium line icon. Simple high quality pictogram. Modern outline style icons. Stroke vector illustration on a white background
Free with trial Down graph line icon. Down graph premium line icon. Simple high quality pictogram. Modern outline style icons. Stroke vector illustration on a white background. Decrease line vectors Down graph line icon. Down graph premium line icon. Simple high quality pictogram. Modern outline style icons. Stroke vector illustration on a white background
Free with trial Down graph line icon. Down graph premium line icon. Simple high quality pictogram. Modern outline style icons. Stroke vector illustration on a white background. Decrease line vectors Down graph line icon. Down graph premium line icon. Simple high quality pictogram. Modern outline style icons. Stroke vector illustration on a white background
Free with trial Down graph line icon. Down graph premium line icon. Simple high quality pictogram. Modern outline style icons. Stroke vector illustration on a white background. Decrease line vectors Down graph line icon. Down graph premium line icon. Simple high quality pictogram. Modern outline style icons. Stroke vector illustration on a white background
Free with trial Down graph line icon. Down graph premium line icon. Simple high quality pictogram. Modern outline style icons. Stroke vector illustration on a white background. Decrease line vectors Down graph line icon. Down graph premium line icon. Simple high quality pictogram. Modern outline style icons. Stroke vector illustration on a white background
Free with trial Down graph line icon. Down graph premium line icon. Simple high quality pictogram. Modern outline style icons. Stroke vector illustration on a white background. Decrease line vectors Down graph line icon. Down graph premium line icon. Simple high quality pictogram. Modern outline style icons. Stroke vector illustration on a white background
Free with trial Diagram graph line icon. Halftone dotted pattern. Gradient icon with grain shadow. Column chart sign. Market analytics symbol. Line diagram graph icon. Various designs. Vector. Decrease line illustrations Diagram graph line icon. Column chart sign. Halftone dotted pattern. Vector. Diagram graph line icon. Halftone dotted pattern. Gradient icon with grain shadow. Diagram graph line icon. Halftone dotted pattern. Gradient icon with grain shadow. Column chart sign. Market analytics symbol. Line diagram graph icon. Various designs. Vector
Free with trial Diagram graph line icon. Halftone dotted pattern. Gradient icon with grain shadow. Column chart sign. Market analytics symbol. Line diagram graph icon. Various designs. Vector. Decrease line illustrations Diagram graph line icon. Column chart sign. Halftone dotted pattern. Vector. Diagram graph line icon. Halftone dotted pattern. Gradient icon with grain shadow. Diagram graph line icon. Halftone dotted pattern. Gradient icon with grain shadow. Column chart sign. Market analytics symbol. Line diagram graph icon. Various designs. Vector
Free with trial A digital line graph displays a sharp decline in interest rates, highlighting sudden market shifts and economic downturn trends. Decrease line illustrations A digital line graph displays a sharp decline in interest rates, highlighting sudden market shifts and economic downturn trends.
Free with trial Line graph decline chart icon. Clean vector icon illustrating a declining line graph with push pins, symbolizing data analysis. Decrease line illustrations Line graph decline chart icon. Clean vector icon illustrating a declining line graph with push pins, symbolizing data analysis
Free with trial Set line Server with shield, Password protection, Cost reduction and Coal mine trolley. Business infographic template. Vector. Decrease line illustrations Set line Server with shield, Password protection, Cost reduction and Coal mine trolley. Business infographic template. Vector
Free with trial Percentage arrow up and down line icon. Growth profit icon line icon. Finance interest rate sign business concept. Decrease line vectors Percentage arrow up and down line icon. Growth profit icon line icon. Finance interest rate sign business concept.
Free with trial Decrease bar chart icon set on black circle. Market crash concept. Market crash illustration concept. Decrease line vectors Decrease bar chart icon set on black circle. Market crash concept. Decrease bar chart icon set on black circle. Market crash illustration concept
Free with trial House price or value decrease vector icon. Consist of home or house building, drop down of arrow. Low price, discount or reduction of market price or interest rate of real estate, property. 48x48 px. Decrease line vectors House price or value decrease vector icon. 48x48 pixel perfect and editable stroke. House price or value decrease vector icon. Consist of home or house building. House price or value decrease vector icon. Consist of home or house building, drop down of arrow. Low price, discount or reduction of market price or interest rate of real estate, property. 48x48 px.
Free with trial Percentage arrow up and down line icon. Percentage arrow with percent sign. Design concept for banking, credit, interest rate, finance and money sphere. Decrease line vectors Percentage arrow up and down line icon. Percentage arrow with percent sign.Vector illustration. Percentage arrow up and down line icon. Percentage arrow with. Percentage arrow up and down line icon. Percentage arrow with percent sign. Design concept for banking, credit, interest rate, finance and money sphere
Free with trial Linear increase and decrease oil price drops. flat outline modern logotype graphic infographic design illustration element isolated on white. concept of financial speculation and global glut by opec. Decrease line vectors Linear increase and decrease oil price drops. Flat outline modern logotype graphic infographic design illustration element isolated on white. concept of
Free with trial Dehydration icon, line vector design, eps 10 file, easy to edit. Decrease line vectors Dehydration icon, line vector design. Eps 10 file, easy to edit
Free with trial Statistics line icon. Continuous line with share plane. Column chart sign. Growth graph diagram symbol. 3d star in speech bubble. Graph chart single line ribbon. Loop curve pattern. Vector. Decrease line illustrations Statistics line icon. Column graph chart sign. Continuous line with plane. Vector. Statistics line icon. Continuous line with share plane. Column chart sign. Statistics line icon. Continuous line with share plane. Column chart sign. Growth graph diagram symbol. 3d star in speech bubble. Graph chart single line ribbon. Loop curve pattern. Vector
Free with trial Microphone audio muted sound line style icon. Vector illustration. Decrease line vectors Microphone audio muted sound line style icon. Vector illustration
Free with trial Costs optimization Icon Black line art vector in black and white outline set collection sign. Decrease line vectors Costs optimization outline icon collection or set. Costs optimization Thin vector line art. Costs optimization Icon Black line art vector in black and white. Costs optimization Icon Black line art vector in black and white outline set collection sign
Free with trial Co2, carbon line icons. contains such icons as tree planting, net zero, and reduced carbon dioxide. sustainable development. concepts and renewable energy businesses. vector design. Decrease line illustrations Co2, carbon line icons. contains such icons as tree planting, net zero, and reduced carbon dioxide. sustainable development. Concepts and renewable energy
Free with trial Growth chart line icon. Halftone dotted pattern. Gradient icon with grain shadow. Column graph sign. Market analytics symbol. Line growth chart icon. Various designs. Vector. Decrease line vectors Growth chart line icon. Column graph sign. Halftone dotted pattern. Vector. Growth chart line icon. Halftone dotted pattern. Gradient icon with grain shadow. Growth chart line icon. Halftone dotted pattern. Gradient icon with grain shadow. Column graph sign. Market analytics symbol. Line growth chart icon. Various designs. Vector
Free with trial Growth chart line icon. Halftone dotted pattern. Gradient icon with grain shadow. Column graph sign. Market analytics symbol. Line growth chart icon. Various designs. Vector. Decrease line vectors Growth chart line icon. Column graph sign. Halftone dotted pattern. Vector. Growth chart line icon. Halftone dotted pattern. Gradient icon with grain shadow. Growth chart line icon. Halftone dotted pattern. Gradient icon with grain shadow. Column graph sign. Market analytics symbol. Line growth chart icon. Various designs. Vector
Free with trial Line icon. Arrows up-down. Web line icon. Decrease line vectors Line icon. Arrows up-down. Web line icon. Arrows up-down
Free with trial Round line concept for online trading. Vector linear symbol for online investment. Open path. Decrease line illustrations Round line concept for online trading. Vector linear symbol for online investment. Open path
Free with trial Data analytics descending line graphic outline icon in white and black colors. data analytics descending line graphic flat vector icon from business collection for web, mobile apps and ui. Decrease line vectors Data analytics descending line graphic outline icon in white and black colors. data analytics descending line graphic flat vector. Icon from business collection. data analytics descending line graphic outline icon in white and black colors. data analytics descending line graphic flat vector icon from business collection for web, mobile apps and ui.
Free with trial Line graph showing market trend with data points. Line graph is representing market trend with data points. Decrease line vectors Line graph showing market trend with data points. Line graph is representing market trend with data points
Free with trial Upward and downward zigzag arrow line icon with long shadow. Decrease line vectors Upward and downward zigzag arrow line icon with long shadow. Upward and downward zigzag arrow line icon vector with long shadow
Free with trial Declining graph line icon, business and finance, chart sign vector graphics, a linear pattern on a black background, eps 10. Decrease line vectors Declining graph line icon, business and finance. Chart sign vector graphics, a linear pattern on a black background, eps 10
Free with trial Icon of carbon dioxide reduction , graph with cloud CO2, line color vector illustration. On white. Decrease line vectors Icon of carbon dioxide reduction , graph with cloud CO2, line color vector illustration. On white
Free with trial Reduce costs icon, line, eps 10 file, easy to edit. Decrease line vectors Reduce costs icon, line. Eps 10 file, easy to edit
Free with trial Line chart decreae icon linear graphics set vector in black. Line chart decreae icon linear vector graphics sign or symbol set for web app ui. Decrease line vectors Line chart decreae icon linear graphics set vector in black. Line chart decreae icon linear vector graphics sign or symbol set for web app ui
Free with trial Cost reduction analysis line icon. Accountancy. Expense decline. Economic analysis. Stages and elements of a successful production cycle. Editable stroke. Decrease line vectors Cost reduction analysis line icon. Editable. Cost reduction analysis line icon. Accountancy. Expense decline. Economic analysis. Stages and elements of a. Cost reduction analysis line icon. Accountancy. Expense decline. Economic analysis. Stages and elements of a successful production cycle. Editable stroke
Free with trial Economy and finance line style icon set vector design. Line style icon set design, economy finance and money theme Vector illustration. Decrease line vectors Economy and finance line style icon set vector design. Line style icon set design, economy finance and money theme Vector illustration
Free with trial Economy and finance line style icon set vector design. Line style icon set design, economy finance and money theme Vector illustration. Decrease line vectors Economy and finance line style icon set vector design. Line style icon set design, economy finance and money theme Vector illustration
Free with trial A visually appealing line graph illustrates data fluctuations and trends over time. The minimalist design makes it suitable for presentations and reports in various fields. Decrease line illustrations Line graph depicting data trends with fluctuations and peaks over time in a minimalist style, showcasing analytical insights and. A visually appealing line graph. A visually appealing line graph illustrates data fluctuations and trends over time. The minimalist design makes it suitable for presentations and reports in various fields
Free with trial Hand drawn Simple Set of Scaling arrow Related Vector Line Icons. doodle style. Sketch. Decrease line vectors Hand drawn Simple Set of Scaling arrow Related Vector Line Icons. doodle style. Sketch
Free with trial Up and down percent outline icon on circle line. Lower and higher price arrow sign symbol. Vector. Decrease line vectors Up and down percent outline icon on circle line. Lower and higher price arrow sign symbol. Vector
Free with trial Profit drop line icon. Profit reduction, financial recession. Downfall arrow and banknote. Economical crash, global financial and economic downturn. Isolated vector illustration. Editable stroke. Decrease line vectors Profit drop line icon. Editable illustration. Profit drop line icon. Profit reduction, financial recession. Downfall arrow and banknote. Economical crash, global. Profit drop line icon. Profit reduction, financial recession. Downfall arrow and banknote. Economical crash, global financial and economic downturn. Isolated vector illustration. Editable stroke
 Sign in