Free with trial Bank building showing economic crisis with arrow going down icon. Line icon representing a bank with a chart showing economic losses. Decrease line vectors Bank building showing economic crisis with arrow going down icon. Line icon representing a bank with a chart showing economic losses
Free with trial A red fuel pump nozzle points downward like a falling arrow, superimposed over a colorful bar graph and a declining line graph, symbolizing decreasing fuel prices isolated on a white surface. Decrease line illustrations Fuel price decrease concept isolated on white background. for economy and finance use cases. A red fuel pump nozzle points downward like a falling arrow. A red fuel pump nozzle points downward like a falling arrow, superimposed over a colorful bar graph and a declining line graph, symbolizing decreasing fuel prices isolated on a white surface
Free with trial Energy reduction icon Vector symbol or sign set collection in black and white outline. Decrease line vectors Energy reduction flat line icon set. Energy reduction Thin line illustration vector. Energy reduction icon Vector symbol or sign set collection in black and. Energy reduction icon Vector symbol or sign set collection in black and white outline
Free with trial Costs optimization Icon Flat vector set outline. Costs optimization Icon Thin line illustration set. Decrease line vectors Costs optimization Icon Flat vector set outline. Costs optimization Icon Thin line illustration set
Free with trial Businessman throwing red line graph arrow to target on falling gold bars bar graph for precious metal investment rebalancing and risk management during market crash. Decrease line vectors Businessman throwing red line graph arrow to target on falling gold bars bar graph for precious metal investment rebalancing and. Risk management during market
Free with trial Chemistry lab, Shop cart and Open mail line icons for web app. Glare of light effect. Message icon. Pack of Inventory report, Low percent, Face search pictogram icons. Vector. Decrease line vectors Chemistry lab, Shop cart and Open mail line icons for web app. Pictogram icon. Glare of light icons. Vector. Chemistry lab, Shop cart and Open mail line icons. Chemistry lab, Shop cart and Open mail line icons for web app. Glare of light effect. Message icon. Pack of Inventory report, Low percent, Face search pictogram icons. Vector
Free with trial Overlapping circular layers create a gradient effect with smooth transitions between warm pink, pastel yellow, and soft blue hues. The circles decrease in size towards the center, forming a tunnel-like appearance, with gentle shadows adding depth. The composition is abstract and harmonious, emphasizing the gradual blending of colors and light. Decrease line illustrations Gradient circles in overlapping layout with warm pink and yellow light transitions. Overlapping circular layers create a gradient effect with smooth transitions. Overlapping circular layers create a gradient effect with smooth transitions between warm pink, pastel yellow, and soft blue hues. The circles decrease in size towards the center, forming a tunnel-like appearance, with gentle shadows adding depth. The composition is abstract and harmonious, emphasizing the gradual blending of colors and light.
Free with trial Carbon management icon, reducing co2 gas emission. Carbon management line icon, reducing co2 gas emission vector. Decrease line vectors Carbon management icon, reducing co2 gas emission. Carbon management line icon, reducing co2 gas emission vector
Free with trial Businessman throwing red line graph arrow to target on falling banknotes bar graph for risk management investment rebalancing and financial loss prevention concept. Decrease line vectors Businessman throwing red line graph arrow to target on falling banknotes bar graph for risk management investment rebalancing and. Financial loss prevention
Free with trial Financial chart graphic with coins, blue bar graph, blurred orange line chart. Business profit, income growth, investment, financial analysis, marketing, economic saving money concept. Decrease line illustrations Financial chart graphic with coins, blue bar graph, blurred orange line chart. Business profit, income growth, investment,. Financial analysis, marketing. Financial chart graphic with coins, blue bar graph, blurred orange line chart. Business profit, income growth, investment, financial analysis, marketing, economic saving money concept.
Free with trial Subtract and decrease icon concept. Black and Blue Line Mix and Mislleaneous Icon. Decrease line vectors Subtract and decrease icon concept. Black and Blue Line Mix and Mislleaneous Icon
Free with trial Business team together throwing red line graph arrow to hit target for crisis management risk rebalancing and financial loss prevention in difficult economic market situation. Decrease line vectors Business team together throwing red line graph arrow to hit target for crisis management risk rebalancing and financial loss. Prevention in difficult economic
Free with trial Business chart showing critical error with exclamation point. Simple line chart is showing a critical error with an exclamation point symbol. Decrease line vectors Business chart showing critical error with exclamation point. Simple line chart is showing a critical error with an exclamation point symbol
Free with trial Crude oil price decraese icon flat line symbol set. Vector outline logo. Decrease line vectors Crude oil price decraese icon flat line symbol set. Vector outline logo
Free with trial A close-up view of a financial candlestick chart displaying an overall upward trend. The chart features numerous blue and white candlesticks, which represent price movements over specific periods. Blue candlesticks typically indicate a price increase, while white ones suggest a decrease. Overlaying the candlesticks are two smooth lines, one green and one light blue, which are likely moving. Decrease line illustrations Uptrending candlestick chart illustrating financial market growth and stock trading analysis isolated on white background. A close-up view of a financial. A close-up view of a financial candlestick chart displaying an overall upward trend. The chart features numerous blue and white candlesticks, which represent price movements over specific periods. Blue candlesticks typically indicate a price increase, while white ones suggest a decrease. Overlaying the candlesticks are two smooth lines, one green and one light blue, which are likely moving
Free with trial Graphs and charts, vibrantly colored, display financial data against a dark background. Elements include a bar chart from January to December, a line graph intersecting a stylized world map, and a pie chart indicating percentage changes. Candlestick charts highlight market fluctuations alongside a large dollar sign. The reflections on a glossy surface enhance the visual depth. This representation symbolizes global market analysis with a focus on trends and financial projections. Decrease line illustrations Colorful business graphs and charts displaying financial data with world map in the background for global market analysis. Graphs and charts, vibrantly colored. Graphs and charts, vibrantly colored, display financial data against a dark background. Elements include a bar chart from January to December, a line graph intersecting a stylized world map, and a pie chart indicating percentage changes. Candlestick charts highlight market fluctuations alongside a large dollar sign. The reflections on a glossy surface enhance the visual depth. This representation symbolizes global market analysis with a focus on trends and financial projections.
Free with trial A 3D digital of a business statistics graph showing a clear downward trend. The graphic features a series of vertical teal rectangular bars decreasing in height from left to right, overlaid by a bold red line graph ending in a sharp arrow pointing downward. The number 100 appears in red near the top left corner. The entire financial data visualization is set against a clean, solid. Decrease line illustrations A 3D rendering of a declining bar chart featuring teal columns and a red downward trend arrow with the number 100, isolated on a. A 3D digital of a business. A 3D digital of a business statistics graph showing a clear downward trend. The graphic features a series of vertical teal rectangular bars decreasing in height from left to right, overlaid by a bold red line graph ending in a sharp arrow pointing downward. The number 100 appears in red near the top left corner. The entire financial data visualization is set against a clean, solid
Free with trial Costs optimization Icon Vector symbol or sign set collection in black and white outline. Decrease line vectors Costs optimization flat line icon set. Costs optimization Thin line illustration vector. Costs optimization Icon Vector symbol or sign set collection in black. Costs optimization Icon Vector symbol or sign set collection in black and white outline
Free with trial Professional vector illustration of downward sloping bar graph and connected dots line represents decreasing profits market loss economic recession data analysis results reduction in growth levels and monthly revenue falling. Decrease line illustrations Descending bar chart icon with line graph showing negative business trends and financial decline on transparent background. Professional vector illustration of. Professional vector illustration of downward sloping bar graph and connected dots line represents decreasing profits market loss economic recession data analysis results reduction in growth levels and monthly revenue falling
Free with trial Set of twelve linear icons representing various business and financial concepts. These include documents, briefcase, graphs, charts, and more. Ideal for presentations, websites, or app design. Decrease line vectors Collection of Business and Finance Line Icons. Set of twelve linear icons representing various business and financial concepts. These include documents. Set of twelve linear icons representing various business and financial concepts. These include documents, briefcase, graphs, charts, and more. Ideal for presentations, websites, or app design.
Free with trial Vertebral compression fracture line black icon. Sign for web page, mobile app, button, logo. Vector isolated button. Editable stroke. Decrease line vectors Vertebral compression fracture line black icon. Sign for web page, mobile app, button, logo. Vector isolated button. Editable stroke
Free with trial Vertebral compression fracture line black icon. Sign for web page, mobile app, button, logo. Vector isolated button. Editable stroke. Decrease line vectors Vertebral compression fracture line black icon. Sign for web page, mobile app, button, logo. Vector isolated button. Editable stroke
Free with trial This icon represents a financial transaction, showing money flow with arrows pointing both up and down, symbolizing the fluctuation of value in investments. Decrease line vectors Vector art of financial transaction icon, depicting money flow with arrows indicating both increase and decrease in value or. This icon represents a financial. This icon represents a financial transaction, showing money flow with arrows pointing both up and down, symbolizing the fluctuation of value in investments
Free with trial This vibrant image showcases a collection of colorful 3D charts and graphs, including bar graphs, pie charts, and a line graph, all illustrating positive growth. A calculator and pencil are included, emphasizing the analytical and planning aspects of business success. Perfect for illustrating finan. Decrease line illustrations Colorful 3D Financial Charts and Graphs with Calculator for Business Growth Presentation. This vibrant image showcases a collection of colorful 3D charts and. This vibrant image showcases a collection of colorful 3D charts and graphs, including bar graphs, pie charts, and a line graph, all illustrating positive growth. A calculator and pencil are included, emphasizing the analytical and planning aspects of business success. Perfect for illustrating finan
Free with trial Financial visualization showing a downward candlestick chart and a line graph indicating loss or market depreciation. Decrease line illustrations Declining stock market chart with downward trend arrow business investment analysis downtrend financial recession performance. Financial visualization showing a. Financial visualization showing a downward candlestick chart and a line graph indicating loss or market depreciation
Free with trial Volume down icon Flat line illustration. Volume down icon linear vector graphics sign or symbol set for web app ui. Decrease line vectors Volume down icon Flat line illustration. Volume down icon linear vector graphics sign or symbol set for web app ui
Free with trial This hand-drawn illustration represents a bank building alongside a declining graph, symbolizing the effects of interest rate hikes on economic trends and market fluctuations. Decrease line illustrations Hand Sketch Illustration of Economic Trends Featuring a Bank Building with a Decrease Graph Line Representing Interest Rate Hike. This hand-drawn illustration. This hand-drawn illustration represents a bank building alongside a declining graph, symbolizing the effects of interest rate hikes on economic trends and market fluctuations
Free with trial This image was created using Generative AI. A stark black zigzag line ending in an arrow pointing downwards against a clean white background. This symbol represents a decline, loss, or negative trend, ideal for financial charts and business presentations. Decrease line vectors Black zigzag arrow pointing down on white background. Financial decline icon for charts. Stock market drop symbol. Business loss. This image was created using. This image was created using Generative AI. A stark black zigzag line ending in an arrow pointing downwards against a clean white background. This symbol represents a decline, loss, or negative trend, ideal for financial charts and business presentations
Free with trial Line drawing of a flipchart showing a graph with a downward arrow representing economic downturn. Decrease line vectors Flipchart showing arrow graph going down representing financial crisis. Line drawing of a flipchart showing a graph with a downward arrow representing economic. Line drawing of a flipchart showing a graph with a downward arrow representing economic downturn
Free with trial Businessman throwing red line graph arrow to target board for investment rebalancing risk management and financial loss prevention during economic recession crisis concept. Decrease line vectors Businessman throwing red line graph arrow to target board for investment rebalancing risk management and financial loss prevention. During economic recession
Free with trial A striking image of gold nuggets showcasing wealth and investment potential against a dark backdrop, featuring a financial trend line representing economic growth. Decrease line illustrations Gold nuggets on dark surface with financial trend line in background symbolizing wealth, investment, and economic growth concepts. A striking image of gold. A striking image of gold nuggets showcasing wealth and investment potential against a dark backdrop, featuring a financial trend line representing economic growth
Free with trial An outline style displays a bar chart with a descending trend line, signifying a negative decline or loss. Great for business and financial related projects. Decrease line vectors Declining bar chart icon with arrow showing negative trend in simple outline style. An outline style displays a bar chart with a descending trend line. An outline style displays a bar chart with a descending trend line, signifying a negative decline or loss. Great for business and financial related projects
Free with trial This line art shows simple adjustment and navigation icons, including directional arrows, a center point, and plus and minus symbols. Useful for user interface design and control panels. Decrease line illustrations Navigation and adjustment icons including arrows, circle, plus and minus in outline style. This line art shows simple adjustment and navigation icons, including. This line art shows simple adjustment and navigation icons, including directional arrows, a center point, and plus and minus symbols. Useful for user interface design and control panels
Free with trial Sharp downward trend line on graph red color rapid freefall business Ideal for websites and social media. Decrease line illustrations Sharp downward trend line on graph, red color, rapid, freefall, business. Sharp downward trend line on graph red color rapid freefall business Ideal for. Sharp downward trend line on graph red color rapid freefall business Ideal for websites and social media
Free with trial An isolated line art of a house combined with a meter, showing the efficiency or value level. Great for use in property or real estate designs, presentations, or infographics. Decrease line illustrations Home performance meter in outline style showing energy efficiency or property value. An isolated line art of a house combined with a meter, showing the. An isolated line art of a house combined with a meter, showing the efficiency or value level. Great for use in property or real estate designs, presentations, or infographics
Free with trial Declining financial wealth represented by stacks of coins and downward trend line. Decrease line illustrations The image depicts a visual representation of financial decline or decreasing wealth. It features four progressively smaller stacks. Declining financial wealth. Declining financial wealth represented by stacks of coins and downward trend line
Free with trial This monochromatic bar graph illustrates data trends over time, showcasing variations in performance and metrics, ideal for presentations and business reports. Decrease line illustrations Black and White Bar Graph with Trend Line Showing Data Variations Over Time for Analysis and Reporting Purposes in Business. This monochromatic bar graph. This monochromatic bar graph illustrates data trends over time, showcasing variations in performance and metrics, ideal for presentations and business reports
Free with trial A wireframe room illustrating a three-dimensional perspective grid. The walls, ceiling, and floor are covered in evenly spaced horizontal and vertical lines, forming squares that decrease in size towards the back, creating depth. The overall design emulates a digital or technical space, perhaps used for illustrating spatial concepts or virtual environments. The grid lines are thin and evenly distributed across a white background. Decrease line vectors Futuristic perspective grid box. Abstract wireframe with green grid line on white background. A wireframe room illustrating a three-dimensional perspective grid. A wireframe room illustrating a three-dimensional perspective grid. The walls, ceiling, and floor are covered in evenly spaced horizontal and vertical lines, forming squares that decrease in size towards the back, creating depth. The overall design emulates a digital or technical space, perhaps used for illustrating spatial concepts or virtual environments. The grid lines are thin and evenly distributed across a white background.
Free with trial A wireframe room illustrating a three-dimensional perspective grid. The walls, ceiling, and floor are covered in evenly spaced horizontal and vertical lines, forming squares that decrease in size towards the back, creating depth. The overall design emulates a digital or technical space, perhaps used for illustrating spatial concepts or virtual environments. The grid lines are thin and evenly distributed across a white background. Decrease line vectors Futuristic perspective grid box. Abstract wireframe with green grid line on white background. A wireframe room illustrating a three-dimensional perspective grid. A wireframe room illustrating a three-dimensional perspective grid. The walls, ceiling, and floor are covered in evenly spaced horizontal and vertical lines, forming squares that decrease in size towards the back, creating depth. The overall design emulates a digital or technical space, perhaps used for illustrating spatial concepts or virtual environments. The grid lines are thin and evenly distributed across a white background.
Free with trial This 3d illustration of a floating dollar coin with a flying downward arrow line represents signs of market decline loss in value and financial downturn in a visual economic concept. Decrease line illustrations A floating dollar coin with a purple down arrow shows flying signs of financial loss and currency devaluation in 3d design. This 3d illustration of a floating. this 3d illustration of a floating dollar coin with a flying downward arrow line represents signs of market decline loss in value and financial downturn in a visual economic concept
Free with trial Flat design graphic showcasing vertical scaling through purple arrows pointing up and down, bisected by a light blue line on black. Decrease line vectors Dimensional expansion and compression icon representing vertical scaling and adjustment control in minimalist design. Flat design graphic showcasing vertical. Flat design graphic showcasing vertical scaling through purple arrows pointing up and down, bisected by a light blue line on black
Free with trial Dynamic stock market chart illuminates dark trading room reflects financial volatility. Red line graph shows fluctuations. Trader analyzes data on multiple screens. Global financial. Decrease line illustrations Dynamic stock market chart illuminates dark trading room, reflects financial volatility. Red line graph shows fluctuations. Dynamic stock market chart. Dynamic stock market chart illuminates dark trading room reflects financial volatility. Red line graph shows fluctuations. Trader analyzes data on multiple screens. Global financial.
Free with trial A minimalist line icon of a bottle with blue liquid and a green down arrow symbolizing reduction or refilling, ideal for concepts like hydration, conservation, or data input. Decrease line illustrations Bottle with Blue Liquid and Green Down Arrow Icon Illustrating Reduction or Hydration Concept on a White Background. A minimalist line icon of a bottle with blue. A minimalist line icon of a bottle with blue liquid and a green down arrow symbolizing reduction or refilling, ideal for concepts like hydration, conservation, or data input
Free with trial Sharp downward sloping line graph red arrow pointing down analytics plunge Suitable for digital platforms. Decrease line illustrations Sharp downward sloping line graph, red arrow pointing down, analytics, plunge. Sharp downward sloping line graph red arrow pointing down analytics plunge. Sharp downward sloping line graph red arrow pointing down analytics plunge Suitable for digital platforms
Free with trial Rising real estate cost concept. Row of toy houses with red graph line going down in background. Housing market crisis economic downturn and recession illustration. Affordable home. Decrease line illustrations Rising real estate cost concept. Row of toy houses with red graph line going down in background. Housing market crisis, economic. Rising real estate cost concept. Rising real estate cost concept. Row of toy houses with red graph line going down in background. Housing market crisis economic downturn and recession illustration. Affordable home.
Free with trial A 3D bar graph with a jagged trend line shows rising data followed by a sudden drop, set against a bright blue background. Decrease line illustrations A 3D bar graph with a jagged trend line shows rising data followed by a sudden drop, set against a bright blue background.
Free with trial 3d isometric illustration of a blue line graph decreasing over grey bars, representing a negative trend. Decrease line vectors Blue line decreasing over grey bars showing negative trend. 3d isometric illustration of a blue line graph decreasing over grey bars, representing a negative. 3d isometric illustration of a blue line graph decreasing over grey bars, representing a negative trend
Free with trial Illustration of a businessman in a suit falling off an upward trend line symbolizing a stock market crash or financial crisis, with a cityscape background and a red color palette. Decrease line illustrations Businessman falling off upward trend line in a stock market crash illustration. Illustration of a businessman in a suit falling off an upward trend line. Illustration of a businessman in a suit falling off an upward trend line symbolizing a stock market crash or financial crisis, with a cityscape background and a red color palette.
Free with trial Abstract watercolor painting depicting a downward market trend, symbolized by red line graph over cityscape, representing financial instability, economic downturn, risk, and uncertainty. Spacious empty area designed for product displays and advertisements. Perfect for banners, branding, and marketing visuals. . Generative AI. Decrease line illustrations Watercolor Cityscape Market Trend Abstract watercolor painting depicting a downward market trend symbolized by red line graph. Abstract watercolor painting. Abstract watercolor painting depicting a downward market trend, symbolized by red line graph over cityscape, representing financial instability, economic downturn, risk, and uncertainty. Spacious empty area designed for product displays and advertisements. Perfect for banners, branding, and marketing visuals. . Generative AI
Free with trial Sharp downward sloping line graph red arrow pointing down statistics dip trend Can be used as a banner or header image. Decrease line illustrations Sharp downward sloping line graph, red arrow pointing down, statistics, dip, trend. Sharp downward sloping line graph red arrow pointing down statistics dip. Sharp downward sloping line graph red arrow pointing down statistics dip trend Can be used as a banner or header image
Free with trial Simple icon of a cooling system, represented by three arrows pointing down to a snowflake, ideal for visualizing temperature decrease. Decrease line vectors Three arrows pointing down to snowflake representing cooling system. Simple icon of a cooling system, represented by three arrows pointing down to a snowflake. Simple icon of a cooling system, represented by three arrows pointing down to a snowflake, ideal for visualizing temperature decrease
Free with trial Price low down icon concept. Interest low price 3d percent discount. Icon reduction arrow decrease render symbol finance. Decrease line vectors Price low down icon concept. Interest low price 3d percent discount. Icon reduction arrow decrease render symbol finance
Free with trial Price low down icon concept. Interest low price 3d percent discount. Icon reduction arrow decrease render symbol finance. Decrease line illustrations Price low down icon concept. Interest low price 3d percent discount. Icon reduction arrow decrease render symbol finance
Free with trial Price low down icon concept. Interest low price 3d percent discount. Icon reduction arrow decrease render symbol finance. Decrease line vectors Price low down icon concept. Interest low price 3d percent discount. Icon reduction arrow decrease render symbol finance
Free with trial Price low down icon concept. Interest low price 3d percent discount. Icon reduction arrow decrease render symbol finance. Decrease line vectors Price low down icon concept. Interest low price 3d percent discount. Icon reduction arrow decrease render symbol finance
Free with trial Car insurance, Food app and Manual line icons. Round icon gradient buttons. Pack of Stats, Timer, Low percent icon. Third party, Smartphone recovery, Qr code pictogram. Vector. Decrease line illustrations Car insurance, Food app and Manual line icons. For web app, printing. Round icon buttons. Vector. Car insurance, Food app and Manual line icons. Round icon. Car insurance, Food app and Manual line icons. Round icon gradient buttons. Pack of Stats, Timer, Low percent icon. Third party, Smartphone recovery, Qr code pictogram. Vector
Free with trial A colorful, stylized, and somewhat whimsical looking percentage sign. The sign is made up of two lines, one of which is green and the other brown. The green line is the top of the sign. Decrease line vectors A colorful, stylized, and somewhat whimsical looking percentage sign. The sign is made up of two lines, one of which is green and the other brown. The green
Free with trial Chef hat, Customer survey, Fast delivery line icons. Interest rate, AI generate, Inflation icons. Approved application, Scissors cutting ribbon, Artificial intelligence icons. Vector. Decrease line vectors Chef hat, Customer survey, Fast delivery line icons. Approved application, Scissors cutting ribbon Vector. Chef hat, Customer survey, Fast delivery line icons. Chef hat, Customer survey, Fast delivery line icons. Interest rate, AI generate, Inflation icons. Approved application, Scissors cutting ribbon, Artificial intelligence icons. Vector
Free with trial Bar Chart With Downward Trend Line Solid Icon. Financial Decline, Economic Downturn, And Market Analysis Silhouette Symbol. Business Performance Tracking. Isolated Vector Illustration. Decrease line vectors Bar Chart With Downward Trend Line Solid Icon. Financial Decline, Economic Downturn, And Market Analysis Silhouette. Symbol. Business Performance Tracking. Bar Chart With Downward Trend Line Solid Icon. Financial Decline, Economic Downturn, And Market Analysis Silhouette Symbol. Business Performance Tracking. Isolated Vector Illustration.
Free with trial Interest rate reduction or percent down icon Vector symbol or sign set collection in black and white outline. Decrease line vectors Interest rate reduction or percent down flat line icon set. Interest rate reduction or percent down Thin line illustration vector. Interest rate reduction or. Interest rate reduction or percent down icon Vector symbol or sign set collection in black and white outline
Free with trial Line art icon of a whiteboard with graphs and charts being used for a business presentation. Decrease line vectors Businessman analyzing statistics on whiteboard with graphs and charts. Line art icon of a whiteboard with graphs and charts being used for a business. Line art icon of a whiteboard with graphs and charts being used for a business presentation
Free with trial Line art vector icon of a hand holding a dollar coin with three arrows pointing down, symbolizing economic decline. Decrease line vectors Businessman hand holding dollar coin with three arrows pointing down showing economic crisis. Line art vector icon of a hand holding a dollar coin with three. Line art vector icon of a hand holding a dollar coin with three arrows pointing down, symbolizing economic decline
Free with trial High-Quality Vector Icons Collection with Editable Stroke. Ideal for Professional and Creative Projects. Decrease line vectors Increase and decrease icons High-Quality Vector Icons Collection with Editable Stroke. Ideal for Professional and. High-Quality Vector Icons Collection with. High-Quality Vector Icons Collection with Editable Stroke. Ideal for Professional and Creative Projects.
Free with trial Businessman falls from a stack of coins. Financial crisis. Decrease in capital. Decrease line vectors Businessman falls from a stack of coins. Financial crisis. Decrease in capital. Businessman falls from a stack of coins. Financial crisis. Decrease in capital
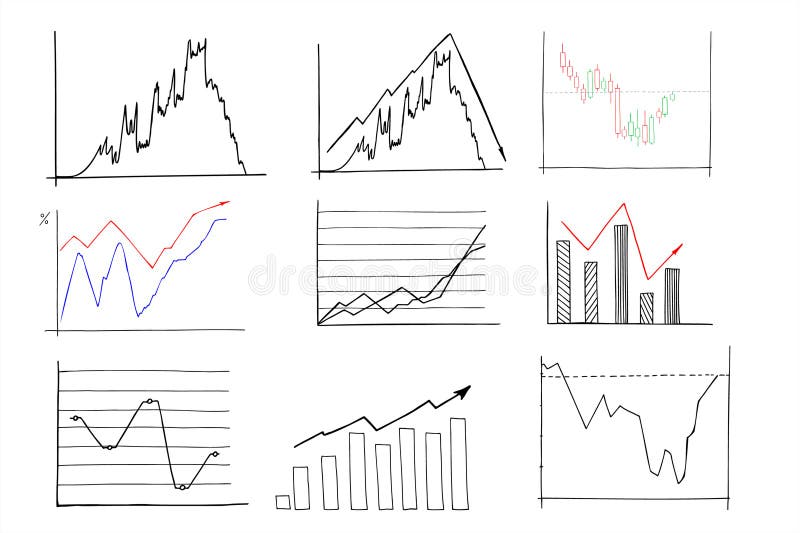
Free with trial Chart line set. Graph, finance report, income growth, economy statistic, diagram, infographic, mind map, data visualization vector illustration. Outline signs of analytic. Editable Stroke. Decrease line vectors Analytical graphic chart with trend lines, columns set hand drawn ink sketch. Change in time of election results or income, plans. Chart line set. Graph, finance. Chart line set. Graph, finance report, income growth, economy statistic, diagram, infographic, mind map, data visualization vector illustration. Outline signs of analytic. Editable Stroke
Free with trial Modern abstract zigzag-shaped chart depicting fluctuations in data analysis representing concept. Decrease line illustrations Modern abstract zigzag-shaped line chart representing fluctuations in data analysis concept. Modern abstract zigzag-shaped chart depicting fluctuations in data. Modern abstract zigzag-shaped chart depicting fluctuations in data analysis representing concept
Free with trial Cost reduction concept icon with downward arrows, money bag, and minimalist design for financial management and budget savings in business investment and economic planning. Decrease line vectors Line art icon illustrating cost reduction concept with a money bag and downward arrows. Cost reduction concept icon with downward arrows, money bag, and. Cost reduction concept icon with downward arrows, money bag, and minimalist design for financial management and budget savings in business investment and economic planning
Free with trial Percent downline in Thin line black color. flat simple vector symbols illustration. Percent down icon vector icon on white background. EPS10. Decrease line vectors Percent downline in Thin line black color. flat simple vector symbols illustration. Percent down icon vector icon on white background. EPS10
Free with trial Percent downline in Thin line black color. flat simple vector symbols illustration. Percent down icon vector icon on white background. EPS10. Decrease line vectors Percent downline in Thin line black color. flat simple vector symbols illustration. Percent down icon vector icon on white background. EPS10
Free with trial Percent downline in Thin line black color. flat simple vector symbols illustration. Percent down icon vector icon on white background. EPS10. Decrease line vectors Percent downline in Thin line black color. flat simple vector symbols illustration. Percent down icon vector icon on white background. EPS10
Free with trial Percent downline in Thin line black color. flat simple vector symbols illustration. Percent down icon vector icon on white background. EPS10. Decrease line vectors Percent downline in Thin line black color. flat simple vector symbols illustration. Percent down icon vector icon on white background. EPS10
Free with trial Percent downline in Thin line black color. flat simple vector symbols illustration. Percent down icon vector icon on white background. EPS10. Decrease line vectors Percent downline in Thin line black color. flat simple vector symbols illustration. Percent down icon vector icon on white background. EPS10
Free with trial Percent downline in Thin line black color. flat simple vector symbols illustration. Percent down icon vector icon on white background. EPS10. Decrease line vectors Percent downline in Thin line black color. flat simple vector symbols illustration. Percent down icon vector icon on white background. EPS10
Free with trial Graph depicting contrasting trends one line decreasing while the other increases in orange hues, Generated by AI. Decrease line illustrations Graph depicting contrasting trends one line decreasing while the other increases in orange hues. Generated by AI
Free with trial Reduction chartline in Thin line black color. flat simple vector symbols illustration. Reduction chart icon vector icon on white background. EPS10. Decrease line vectors Reduction chartline in Thin line black color. flat simple vector symbols illustration. Reduction chart icon vector icon on white background. EPS10
Free with trial Reduction chartline in Thin line black color. flat simple vector symbols illustration. Reduction chart icon vector icon on white background. EPS10. Decrease line vectors Reduction chartline in Thin line black color. flat simple vector symbols illustration. Reduction chart icon vector icon on white background. EPS10
Free with trial Reduction chartline in Thin line black color. flat simple vector symbols illustration. Reduction chart icon vector icon on white background. EPS10. Decrease line vectors Reduction chartline in Thin line black color. flat simple vector symbols illustration. Reduction chart icon vector icon on white background. EPS10
Free with trial Generative ai, The image shows a red grid with a white line graph that is pointing downwards, indicating a downward trend. The graph is overlaid on top of a series of red bars, which also show a downward trend. The image is a representation of a de. Decrease line illustrations The image contains a red and white downward trending line graph with a large arrow pointing down. The graph is depicted on a red. Generative ai, The image shows. generative ai, The image shows a red grid with a white line graph that is pointing downwards, indicating a downward trend. The graph is overlaid on top of a series of red bars, which also show a downward trend. The image is a representation of a de
Free with trial Car insurance, Food app and Manual line icons. Round icon gradient buttons. Pack of Stats, Timer, Low percent icon. Third party, Smartphone recovery, Qr code pictogram. Vector. Decrease line vectors Car insurance, Food app and Manual line icons. For web app, printing. Round icon buttons. Vector. Car insurance, Food app and Manual line icons. Round icon. Car insurance, Food app and Manual line icons. Round icon gradient buttons. Pack of Stats, Timer, Low percent icon. Third party, Smartphone recovery, Qr code pictogram. Vector
Free with trial Composite trend artwork sketch photo collage of monochrome young woman walk step huge analyzing arrow go down direction crisis decrease. Decrease line illustrations Composite trend artwork sketch photo collage of monochrome young woman walk step huge analyzing arrow go down direction. Crisis decrease
 Sign in