Free with trial Undo delete or remove outline symbol with looping arrow for graphic element and design projects on white background. AI generated. Decrease line vectors Undo delete or remove outline symbol with looping arrow for graphic element and design projects on white background. AI generated
Free with trial Conceptual image depicting real estate market analysis. A magnifying glass focuses on a brightly lit house model, surrounded by other house models and a rising graph, all set on a reflective surface. The scene suggests research, investment, and growth in the housing market. Ideal for illustrating articles or presentations on real estate trends, property valuation, and housing market forecasts. Decrease line illustrations Real Estate Market Analysis. Conceptual image depicting real estate market analysis. A magnifying glass focuses on a brightly lit house model, surrounded by. Conceptual image depicting real estate market analysis. A magnifying glass focuses on a brightly lit house model, surrounded by other house models and a rising graph, all set on a reflective surface. The scene suggests research, investment, and growth in the housing market. Ideal for illustrating articles or presentations on real estate trends, property valuation, and housing market forecasts.
Free with trial A black and white minimalist line art illustration of a circular spiral design. The design consists of a series of curved lines arranged in concentric layers, creating a spiral pattern that rotates clockwise. The lines are thick and bold, forming a series of overlapping loops that decrease in size towards the center. The spiral has a hollow center creating a perfect circle. The entire design is rendered in solid black against a white background. The lines have a consistent thickness and maintain smooth curves throughout the spiral pattern. The illustration has a clean, geometric quality with sharp edges and precise line work. Decrease line vectors Circular spiral pattern in bold black lines with hollow center. A black and white minimalist line art illustration of a circular spiral design. The design. A black and white minimalist line art illustration of a circular spiral design. The design consists of a series of curved lines arranged in concentric layers, creating a spiral pattern that rotates clockwise. The lines are thick and bold, forming a series of overlapping loops that decrease in size towards the center. The spiral has a hollow center creating a perfect circle. The entire design is rendered in solid black against a white background. The lines have a consistent thickness and maintain smooth curves throughout the spiral pattern. The illustration has a clean, geometric quality with sharp edges and precise line work.
Free with trial Candlestick Chart vector Professional Financial Trading icon or symbol. Decrease line vectors Candlestick Chart vector Professional Financial Trading icon or symbol. Candlestick Chart vector Professional Financial Trading concept icon or symbol
Free with trial Downward zigzag arrow icon. Simple black zigzag arrow pointing downward, indicating decline or zigzag movement. Decrease line illustrations Downward zigzag arrow icon. Simple black zigzag arrow pointing downward, indicating decline or zigzag movement
Free with trial Minus Symbol within a Circle Negative Sign in Round Border Shape. AI generated. Decrease line vectors Minus Symbol within a Circle Negative Sign in Round Border Shape. AI generated
Free with trial Scale with illustrations of cash and home stocks. The concept of inflation. Stock Illustration. Home price is decrease. Decrease line vectors Scale with illustrations of cash and home stocks. The concept of inflation. Stock Illustration. Home price is decrease
Free with trial Conceptual image representing cost cutting and financial analysis. Decrease line illustrations Cost Cutting Analysis Scissors Cutting Downward Graph Under Magnifier. Conceptual image representing cost cutting and financial analysis. Conceptual image representing cost cutting and financial analysis.
Free with trial Conceptual design showing a security analysis of a declining graph. Decrease line illustrations Data Security Analysis Declining Graph Under Magnifying Glass. Conceptual design showing a security analysis of a declining graph. Conceptual design showing a security analysis of a declining graph.
Free with trial This image showcases a geometric spiral pattern, featuring concentric rings that decrease in size towards the center. Each ring has a jagged outline filled with shaded lines, offering a dynamic abstract design. Decrease line illustrations Geometric Spiral Pattern with Shaded Lines on a White Background. This image showcases a geometric spiral pattern, featuring concentric rings that decrease in. This image showcases a geometric spiral pattern, featuring concentric rings that decrease in size towards the center. Each ring has a jagged outline filled with shaded lines, offering a dynamic abstract design.
Free with trial A simple and clean minimalist outline of a rectangular shape with two horizontal lines inside, representing the subtract or minus symbol. This icon is perfect for use in user interfaces, websites, and applications where a clear and concise symbol is needed to indicate subtraction or removal. Decrease line vectors Minimalist Outline Rectangular Subtract Symbol Inside Shape Sign Icon. A simple and clean minimalist outline of a rectangular shape with two horizontal lines. A simple and clean minimalist outline of a rectangular shape with two horizontal lines inside, representing the subtract or minus symbol. This icon is perfect for use in user interfaces, websites, and applications where a clear and concise symbol is needed to indicate subtraction or removal.
Free with trial The image depicts a wooden easel holding a white board with a downward-trending red line, a pie chart showing a small green segment, and a red warning triangle. Below the easel, three stacks of gold coins symbolize financial loss or economic downturn. The visual elements collectively suggest financial warnings, market decline, or poor investment returns. Decrease line illustrations Financial decline illustrated with warning and pie chart graphics on easel with gold coins. The image depicts a wooden easel holding a white board with a. The image depicts a wooden easel holding a white board with a downward-trending red line, a pie chart showing a small green segment, and a red warning triangle. Below the easel, three stacks of gold coins symbolize financial loss or economic downturn. The visual elements collectively suggest financial warnings, market decline, or poor investment returns
Free with trial Concentric circles create a three-dimensional effect on a white background. The rings decrease in size toward the center, forming a gently spiraling pattern. The texture is smooth, with soft shadows adding depth and the appearance of layered, recessed surfaces. The monochromatic tone gives a minimalist and modern feel, making it suitable as a backdrop for design or presentation purposes. Decrease line illustrations Abstract White Circular Pattern Background. Concentric circles create a three-dimensional effect on a white background. The rings decrease in size toward the. Concentric circles create a three-dimensional effect on a white background. The rings decrease in size toward the center, forming a gently spiraling pattern. The texture is smooth, with soft shadows adding depth and the appearance of layered, recessed surfaces. The monochromatic tone gives a minimalist and modern feel, making it suitable as a backdrop for design or presentation purposes.
Free with trial Minimalist line art illustration of weighing scale showing footprints and arrows indicating weight reduction. Decrease line vectors Bathroom scale icon with downward arrows representing weight loss progress and fitness. Minimalist line art illustration of weighing scale showing footprints and. Minimalist line art illustration of weighing scale showing footprints and arrows indicating weight reduction
Free with trial Shopping Cart Icon with Downward Arrow, Black Outline on White Background, Symbol. For Declining Sales and Ecommerce Discount Strategy. Decrease line vectors Shopping Cart Icon with Downward Arrow, Black Outline on White Background, Symbol. For Declining Sales and Ecommerce Discount Strategy
Free with trial Shopping Cart Icon with Downward Arrow, Black Outline on White Background, Symbol. For Declining Sales and Ecommerce Discount Strategy. Decrease line vectors Shopping Cart Icon with Downward Arrow, Black Outline on White Background, Symbol. For Declining Sales and Ecommerce Discount Strategy
Free with trial Vector of a businessman in a blue suit sewing together a broken golden upward arrow over declining bar charts and a falling red trend line. Background features gears and rising graphs symbolizing business mechanics and growth. Concept represents economic recovery, crisis management, turnaround strategy, financial repair and resilience. Ideal for articles, presentations and marketing about business solutions, investment, leadership, risk management, recession recovery and corporate strategy. Decrease line vectors Businessman Sewing Broken Growth Arrow for Recovery. Vector of a businessman in a blue suit sewing together a broken golden upward arrow over declining bar. Vector of a businessman in a blue suit sewing together a broken golden upward arrow over declining bar charts and a falling red trend line. Background features gears and rising graphs symbolizing business mechanics and growth. Concept represents economic recovery, crisis management, turnaround strategy, financial repair and resilience. Ideal for articles, presentations and marketing about business solutions, investment, leadership, risk management, recession recovery and corporate strategy.
Free with trial An upward trending bar graph displayed on a laptop screen, illuminated against a backdrop of blurred city lights at night. Shows financial success and progress. Decrease line illustrations Financial Growth Chart on Laptop Screen at Night. An upward trending bar graph displayed on a laptop screen, illuminated against a backdrop of blurred city. An upward trending bar graph displayed on a laptop screen, illuminated against a backdrop of blurred city lights at night. Shows financial success and progress.
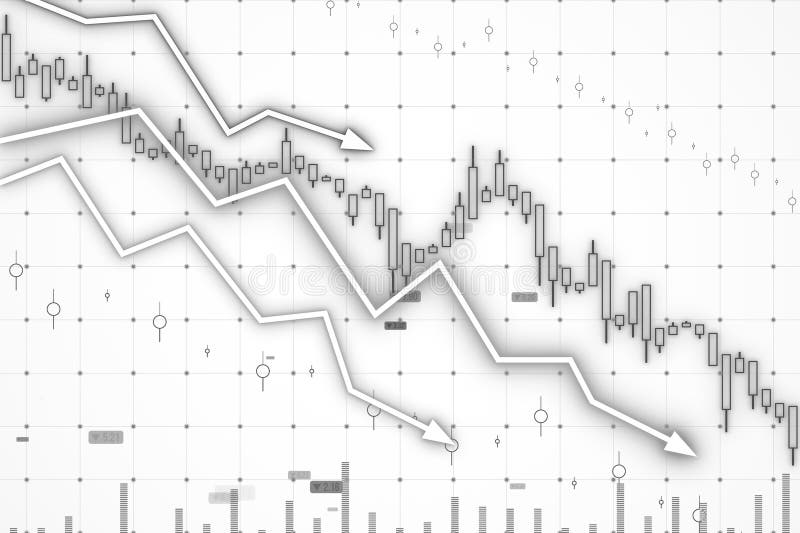
Free with trial Declining stock market trend illustration. 3D Rendering. A graph showing a downward trend on a grid background. Decrease line illustrations Declining stock market trend illustration. 3D Rendering. A graph showing a downward trend on a grid background. 3D Rendering
Free with trial A glowing spiral design on a black background. The spiral consists of multiple concentric circles that decrease in size as they rotate clockwise. The circles transition from a bright cyan blue on the outer edge to a vibrant pink in the center. The spiral has 8 complete circles, each one slightly smaller than the previous one. The spiral design has a neon-like glow effect, creating a luminous appearance against the dark background. The spiral is perfectly centered in the frame. The image has a professional, modern aesthetic with sharp contrast between the bright spiral and the deep black background. The spiral creates a sense of movement and rotation from its clockwise direction. Decrease line illustrations A glowing spiral design on a black background. The spiral consists of multiple concentric circles that decrease in size as they rotate clockwise. The circles
Free with trial This image features a simple plus and minus sign icon in a flat design style. Perfect for user interface design, app development, and website design. Decrease line vectors Simple Plus and Minus Sign Icon, Flat Design. This image features a simple plus and minus sign icon in a flat design style. Perfect for user interface design. This image features a simple plus and minus sign icon in a flat design style. Perfect for user interface design, app development, and website design.
Free with trial Abstract Arrow Design Featuring Geometric Shapes, Illustrating a Downward Trend or. Decline in a Conceptual Graphic. Decrease line vectors Abstract Arrow Design Featuring Geometric Shapes, Illustrating a Downward Trend or. Decline in a Conceptual Graphic
Free with trial Two circular icons representing plus and minus signs, a basic mathematical concept. Decrease line vectors A simple illustration showing two black circles one with a plus and one. Two circular icons representing plus and minus signs, a basic mathematical concept. Two circular icons representing plus and minus signs, a basic mathematical concept.
Free with trial A hand removes coins from stacks, mirroring a downward trending graph generated by AI. The image visually represents economic decline, financial loss, or decreasing market value. The stacks of coins symbolize assets, dwindling in line with the graph's trajectory. Decrease line illustrations Declining Investments: AI-Generated Visualization. A hand removes coins from stacks, mirroring a downward trending graph generated by AI. The image visually. A hand removes coins from stacks, mirroring a downward trending graph generated by AI. The image visually represents economic decline, financial loss, or decreasing market value. The stacks of coins symbolize assets, dwindling in line with the graph's trajectory.
Free with trial Power consumption reduction icon, linear design, eps 10 file, easy to edit. Decrease line vectors Power consumption reduction icon, linear design. Eps 10 file, easy to edit
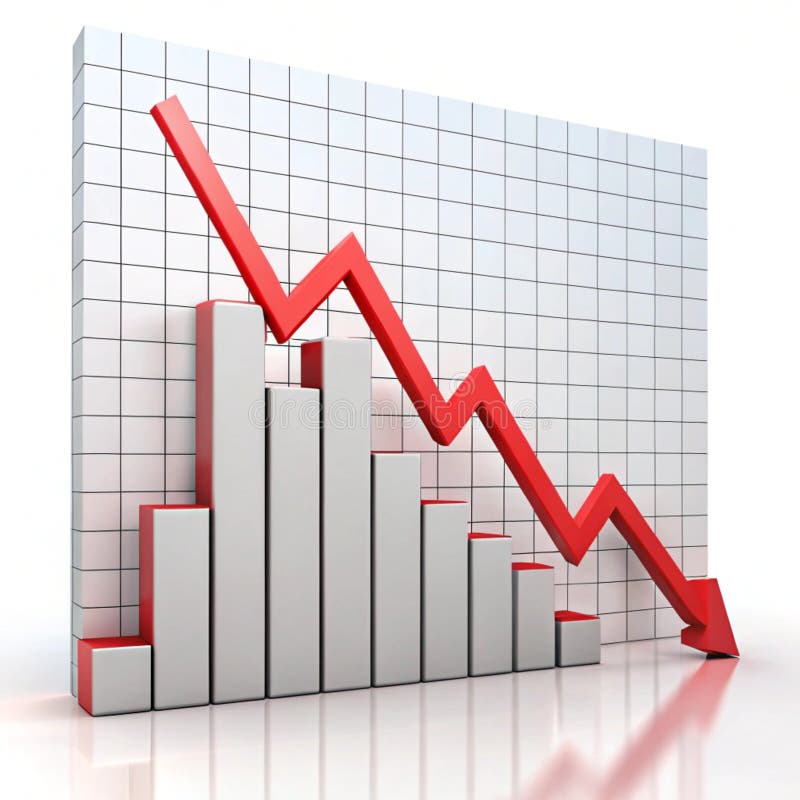
Free with trial A sharp red arrow with a jagged line points downwards, indicating a decline or loss, isolated on a white background. Decrease line illustrations Red downward trend arrow isolated on white background. A sharp red arrow with a jagged line points downwards, indicating a decline or loss, isolated on a white. A sharp red arrow with a jagged line points downwards, indicating a decline or loss, isolated on a white background
Free with trial Concentric black ovals on a white background create an abstract swirl pattern. The design consists of thicker, evenly spaced lines that decrease in size towards the center, forming a hypnotic effect. The lines are smooth and consistent, radiating outward from the center, with each oval increasing in size sequentially. The overall appearance is bold and graphic, emphasizing contrast and symmetry. Decrease line vectors Black and white swirl background Abstract Silhouette Design. Concentric black ovals on a white background create an abstract swirl pattern. The design consists. Concentric black ovals on a white background create an abstract swirl pattern. The design consists of thicker, evenly spaced lines that decrease in size towards the center, forming a hypnotic effect. The lines are smooth and consistent, radiating outward from the center, with each oval increasing in size sequentially. The overall appearance is bold and graphic, emphasizing contrast and symmetry.
Free with trial Timer Switch Setting. An icon showing a switch with a timer function and a minus sign, indicating time reduction, can be used in digital interfaces. Decrease line illustrations Timer Switch Setting. An icon showing a switch with a timer function and a minus sign, indicating time reduction, can be used in digital interfaces
Free with trial A bold and sharp red zigzag arrow pointing downward, ideal for visual indicators in presentations, infographics, and digital designs. Decrease line illustrations Red downward zigzag arrow icon. A bold and sharp red zigzag arrow pointing downward, ideal for visual indicators in presentations, infographics, and digital. A bold and sharp red zigzag arrow pointing downward, ideal for visual indicators in presentations, infographics, and digital designs
Free with trial Up or down vector icon, eps 10 file, easy to edit. Decrease line vectors Up or down vector icon. Eps 10 file, easy to edit
Free with trial A minimalist black and white line drawing of a leaf design. The leaf is drawn with clean, continuous black lines on a white background. The leaf has five elongated oval-shaped segments arranged in a symmetrical pattern along a central stem. Each segment has subtle curved lines within them, creating a delicate, flowing texture. The leaf design is positioned diagonally, with the stem extending from the bottom left to the upper right of the frame. The segments decrease in size towards the tip, creating a natural tapering effect. The drawing style is simple and artistic, with no shading or texture fill, maintaining a clean, graphic quality. Decrease line vectors Leaf with five oval segments tapering along central diagonal stem. A minimalist black and white line drawing of a leaf design. The leaf is drawn with clean. A minimalist black and white line drawing of a leaf design. The leaf is drawn with clean, continuous black lines on a white background. The leaf has five elongated oval-shaped segments arranged in a symmetrical pattern along a central stem. Each segment has subtle curved lines within them, creating a delicate, flowing texture. The leaf design is positioned diagonally, with the stem extending from the bottom left to the upper right of the frame. The segments decrease in size towards the tip, creating a natural tapering effect. The drawing style is simple and artistic, with no shading or texture fill, maintaining a clean, graphic quality.
Free with trial Graph with Downward Trend and Hand Icon Pointing to It Featuring Business, Finance,. Economics with Stock Market and Decline Elements for Analysis. Decrease line vectors Graph with Downward Trend and Hand Icon Pointing to It Featuring Business, Finance,. Economics with Stock Market and Decline Elements for Analysis
Free with trial This graphic illustration depicts the concepts of stress, calmness, energy level, and mental load. The image features four distinct sections, each representing one of these aspects. The stress section is represented by a gauge with a needle pointing to a high level, indicating a sense of anxiety or overwhelm. The calmness section features a wavy line, symbolizing a peaceful and serene state. The energy level section is illustrated with a bar graph, showing a decrease in energy. The mental load section is represented by a gauge with a needle pointing to a high level, indicating a heavy mental burden. This illustration can be used to represent the importance of maintaining a balance between stress and calmness, and the impact it has on our mental health and well-being. Decrease line vectors Mental health A graphic illustration of stress, calmness, energy level, and mental load. This graphic illustration depicts the concepts of stress, calmness. This graphic illustration depicts the concepts of stress, calmness, energy level, and mental load. The image features four distinct sections, each representing one of these aspects. The stress section is represented by a gauge with a needle pointing to a high level, indicating a sense of anxiety or overwhelm. The calmness section features a wavy line, symbolizing a peaceful and serene state. The energy level section is illustrated with a bar graph, showing a decrease in energy. The mental load section is represented by a gauge with a needle pointing to a high level, indicating a heavy mental burden. This illustration can be used to represent the importance of maintaining a balance between stress and calmness, and the impact it has on our mental health and well-being.
Free with trial A visual representation of declining house values, symbolized by a house icon with downward arrows and a dollar sign, indicating economic downturn and financial loss. Decrease line vectors Vector art of house with downward arrows and dollar sign. A visual representation of declining house values, symbolized by a house icon with downward arrows and. A visual representation of declining house values, symbolized by a house icon with downward arrows and a dollar sign, indicating economic downturn and financial loss
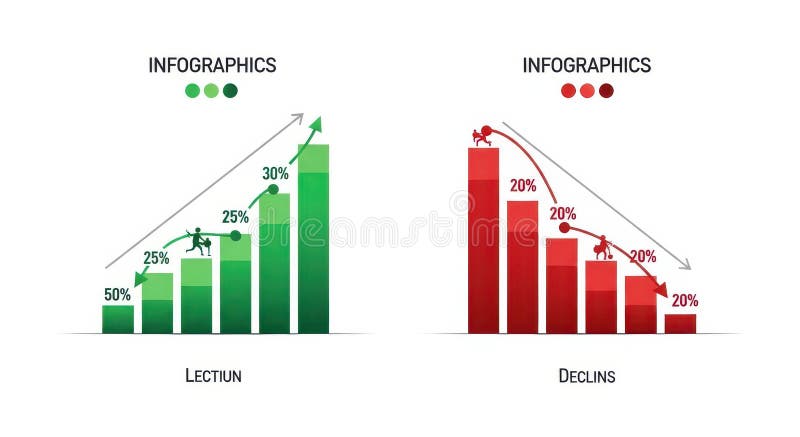
Free with trial The image displays two infographics side by side. the left infographic, titled "lection," depicts a green bar graph showing growth, starting at 50% and increasing to 30% with a figure climbing the bars. an upward-pointing arrow indicates positive growth. the right infographic, titled "declins," shows a red bar graph illustrating decline, starting at 20% and decreasing to 20% with a figure falling down the bars. a downward-pointing arrow indicates negative growth. Decrease line illustrations Infographics showing growth and decline charts. The image displays two infographics side by side. the left infographic, titled 'lection,' depicts a green bar. the image displays two infographics side by side. the left infographic, titled "lection," depicts a green bar graph showing growth, starting at 50% and increasing to 30% with a figure climbing the bars. an upward-pointing arrow indicates positive growth. the right infographic, titled "declins," shows a red bar graph illustrating decline, starting at 20% and decreasing to 20% with a figure falling down the bars. a downward-pointing arrow indicates negative growth.
Free with trial Black Wi-Fi symbol composed of four semicircular arcs and a pointed bottom segment, set against a pale pink background. The arcs decrease in size from top to bottom, forming a cohesive and symmetrical design. This icon typically represents wireless internet connectivity. Decrease line vectors Semicircular Wi-Fi symbol with pointed bottom on pale pink. Black Wi-Fi symbol composed of four semicircular arcs and a pointed bottom segment, set against a. Black Wi-Fi symbol composed of four semicircular arcs and a pointed bottom segment, set against a pale pink background. The arcs decrease in size from top to bottom, forming a cohesive and symmetrical design. This icon typically represents wireless internet connectivity.
Free with trial A computer displays a dramatic downward trending graph, generated by AI, symbolizing a market crash or economic downturn. The image is a 3D rendering showing a clean, modern workspace setting, highlighting the severity of the financial decline depicted on screen. Decrease line illustrations Market Crash Simulation. A computer displays a dramatic downward trending graph, generated by AI, symbolizing a market crash or economic downturn. The image is a. A computer displays a dramatic downward trending graph, generated by AI, symbolizing a market crash or economic downturn. The image is a 3D rendering showing a clean, modern workspace setting, highlighting the severity of the financial decline depicted on screen.
Free with trial A vibrant green upward trending arrow signifies growth, progress, and positive development. The arrow's design is visually appealing and represents a successful trajectory. The dark background emphasizes the upward movement. Decrease line illustrations Green Arrow Growth Chart. A vibrant green upward trending arrow signifies growth, progress, and positive development. The arrow's design is visually appealing. A vibrant green upward trending arrow signifies growth, progress, and positive development. The arrow's design is visually appealing and represents a successful trajectory. The dark background emphasizes the upward movement.
Free with trial Declining Bar Graph Representing Downturn or Reduction in Statistics. AI generated. Decrease line vectors Declining Bar Graph Representing Downturn or Reduction in Statistics. AI generated
Free with trial Comprehensive cardiology icon. Representative moisture symbols. Healthcare medicine Vector. Essential healthcare emblem. EPS 10. Decrease line vectors Comprehensive cardiology icon. Representative moisture symbols. Healthcare medicine Vector. Essential healthcare emblem. EPS 10
Free with trial Red stock market investment decline chart. Decrease line vectors Red stock market investment decline chart.
Free with trial A black industrial pipeline is entwined with green vines, symbolizing nature reclaiming technology. In the background, solar panels and white wind turbines populate the green field under a bright sun, contrasting with the fossil fuel infrastructure. Leaves swirl through the air, reflecting movement toward renewable energy sources. The scene depicts the transition from traditional energy to sustainable alternatives, underlining the harmonious blend of technology and nature for a greener future. Decrease line illustrations From Fossil Fuels to a Greener Future. A black industrial pipeline is entwined with green vines, symbolizing nature reclaiming technology. In the background. A black industrial pipeline is entwined with green vines, symbolizing nature reclaiming technology. In the background, solar panels and white wind turbines populate the green field under a bright sun, contrasting with the fossil fuel infrastructure. Leaves swirl through the air, reflecting movement toward renewable energy sources. The scene depicts the transition from traditional energy to sustainable alternatives, underlining the harmonious blend of technology and nature for a greener future.
Free with trial A black industrial pipeline is entwined with green vines, symbolizing nature reclaiming technology. In the background, solar panels and white wind turbines populate the green field under a bright sun, contrasting with the fossil fuel infrastructure. Leaves swirl through the air, reflecting movement toward renewable energy sources. The scene depicts the transition from traditional energy to sustainable alternatives, underlining the harmonious blend of technology and nature for a greener future. Decrease line illustrations From Fossil Fuels to a Greener Future. A black industrial pipeline is entwined with green vines, symbolizing nature reclaiming technology. In the background. A black industrial pipeline is entwined with green vines, symbolizing nature reclaiming technology. In the background, solar panels and white wind turbines populate the green field under a bright sun, contrasting with the fossil fuel infrastructure. Leaves swirl through the air, reflecting movement toward renewable energy sources. The scene depicts the transition from traditional energy to sustainable alternatives, underlining the harmonious blend of technology and nature for a greener future.
Free with trial A visually striking shot of an overloaded red shopping cart filled with colorful boxes. It is set against an abstract background featuring finance related trends. Decrease line illustrations Red shopping cart is overloaded with colorful boxes against abstract finance backdrop. A visually striking shot of an overloaded red shopping cart filled with. A visually striking shot of an overloaded red shopping cart filled with colorful boxes. It is set against an abstract background featuring finance related trends
Free with trial Money loan interest rate hand drawn doodle icons set collection in flat style. Payment benefit vector illustration on isolated background. Discount sign business concept. Decrease line vectors Money loan interest rate hand drawn doodle icons set collection in flat style. Payment benefit vector illustration on isolated. Background. Discount sign
Free with trial Money loan interest rate hand drawn doodle icons set collection in flat style. Payment benefit vector illustration on isolated background. Discount sign business concept. Decrease line vectors Money loan interest rate hand drawn doodle icons set collection in flat style. Payment benefit vector illustration on isolated. Background. Discount sign
Free with trial Flat showing fuel price fluctuations with a red gas pump nozzle, oil barrel, fuel pump and industrial tanks surrounded by rising and falling arrows, bar charts, line graphs, dollar signs and percentage symbols. Red downward arrow contrasts with upward trends indicating market volatility, inflation and energy costs. Ideal for business, finance, economy, petroleum industry articles, presentations and reports about gasoline prices, oil crisis and economic analysis. Decrease line vectors Fuel Price Increase with Oil Market Graphs Illustration. Flat showing fuel price fluctuations with a red gas pump nozzle, oil barrel, fuel pump and industrial. Flat showing fuel price fluctuations with a red gas pump nozzle, oil barrel, fuel pump and industrial tanks surrounded by rising and falling arrows, bar charts, line graphs, dollar signs and percentage symbols. Red downward arrow contrasts with upward trends indicating market volatility, inflation and energy costs. Ideal for business, finance, economy, petroleum industry articles, presentations and reports about gasoline prices, oil crisis and economic analysis.
Free with trial World map with a prominent red downward trend line indicating a global recession or financial market crash. Red arrows pointing downwards are superimposed over different continents, emphasizing a global economic downturn. The map is illuminated in shades of blue and purple against a dark background, enhancing the visual impact of the red elements. The composition suggests widespread economic decline across various regions. Decrease line illustrations Global recession and financial market crash shown by a declining red graph and arrows over a world map. World map with a prominent red downward trend line. World map with a prominent red downward trend line indicating a global recession or financial market crash. Red arrows pointing downwards are superimposed over different continents, emphasizing a global economic downturn. The map is illuminated in shades of blue and purple against a dark background, enhancing the visual impact of the red elements. The composition suggests widespread economic decline across various regions.
Free with trial Abstract blue up and down arrow icons illustration set minimalist molecular grid design isolated on white background for technology business growth data analysis and finance ui ux. Decrease line vectors Abstract blue up and down arrow icons illustration set minimalist molecular grid design isolated on white background for. Technology business growth data. Abstract blue up and down arrow icons illustration set minimalist molecular grid design isolated on white background for technology business growth data analysis and finance ui ux
Free with trial Dollar price up and down icon in trendy style. USD growth and decline sign symbol. Vector. Decrease line vectors Dollar price up and down icon in trendy style. USD growth and decline sign symbol. Vector
Free with trial A 3D rendered image of a red arrow pointing downwards, suggesting a negative trend or decline. The arrow has a feathered fletching and casts a shadow on a white background, emphasizing the downward direction. The image is clean and minimalist, perfect for illustrating concepts of loss, decline, or. Decrease line illustrations Red Arrow Downward Trend. A 3D rendered image of a red arrow pointing downwards, suggesting a negative trend or decline. The arrow has a feathered fletching and. A 3D rendered image of a red arrow pointing downwards, suggesting a negative trend or decline. The arrow has a feathered fletching and casts a shadow on a white background, emphasizing the downward direction. The image is clean and minimalist, perfect for illustrating concepts of loss, decline, or
Free with trial The image shows a stylized, neon blue graph depicting a downward trend, overlaid on a background resembling the interior of a theater or auditorium. the graph is composed of many small, glowing particles, giving it a digital or futuristic appearance. the background features rows of empty seats and stage lighting, suggesting a performance venue. the overall impression is one of economic downturn or financial loss, visualized in an unusual and somewhat theatrical setting. Decrease line illustrations Declining stock market graph in theater setting. The image shows a stylized, neon blue graph depicting a downward trend, overlaid on a background resembling the. the image shows a stylized, neon blue graph depicting a downward trend, overlaid on a background resembling the interior of a theater or auditorium. the graph is composed of many small, glowing particles, giving it a digital or futuristic appearance. the background features rows of empty seats and stage lighting, suggesting a performance venue. the overall impression is one of economic downturn or financial loss, visualized in an unusual and somewhat theatrical setting.
Free with trial Simple bar graph showing downward trend with arrow, decline in progress. AI generated. Decrease line vectors Simple bar graph showing downward trend with arrow, decline in progress. AI generated
Free with trial A bear figurine is positioned in front of a computer monitor showing a declining stock market graph. The graph displays a sharp decline in value, represented by a red line on a black background. The bear figurine is likely a symbol of a bear market, indicating a pessimistic outlook on the economy or a specific investment. The image conveys a sense of concern and worry about the financial situation. Decrease line illustrations A bear figurine stands in front of a computer monitor displaying a declining stock market graph. A bear figurine is positioned in front of a computer monitor. A bear figurine is positioned in front of a computer monitor showing a declining stock market graph. The graph displays a sharp decline in value, represented by a red line on a black background. The bear figurine is likely a symbol of a bear market, indicating a pessimistic outlook on the economy or a specific investment. The image conveys a sense of concern and worry about the financial situation.
Free with trial A striking abstract composition featuring a dense pattern of black halftone dots that gradually decrease in size and density, creating a dynamic visual effect against a clean white backdrop. Decrease line illustrations Abstract black and white halftone dot pattern fading into white background. A striking abstract composition featuring a dense pattern of black halftone dots that. A striking abstract composition featuring a dense pattern of black halftone dots that gradually decrease in size and density, creating a dynamic visual effect against a clean white backdrop
Free with trial 3D icon featuring a silver metallic effect in the shape of a negative trend graph. Bars in descending order from left to right are accompanied by a downward-pointing arrow. The icon is framed in a rounded square, all elements sharing a polished, reflective surface that suggests a modern and sleek design. Decrease line vectors Negative Trend Graph 3D icon with silver metallic effect. 3D icon featuring a silver metallic effect in the shape of a negative trend graph. Bars in descending. 3D icon featuring a silver metallic effect in the shape of a negative trend graph. Bars in descending order from left to right are accompanied by a downward-pointing arrow. The icon is framed in a rounded square, all elements sharing a polished, reflective surface that suggests a modern and sleek design.
Free with trial Bold red downward zigzag arrow on white background, minimalist design. Decrease line illustrations Red downward zigzag arrow graphic. Bold red downward zigzag arrow on white background, minimalist design. Bold red downward zigzag arrow on white background, minimalist design.
Free with trial Radial design featuring alternating blue and dark blue elliptical shapes arranged in a spiral pattern, converging toward the center against a white background. Decrease line illustrations Radial design featuring alternating blue and dark blue elliptical shapes arranged in a spiral pattern on white background. Radial design featuring alternating. Radial design featuring alternating blue and dark blue elliptical shapes arranged in a spiral pattern, converging toward the center against a white background
Free with trial Sketchy bar graph illustration of financial decline and economic loss. AI generated. Decrease line vectors Sketchy bar graph illustration of financial decline and economic loss. AI generated
Free with trial Red glowing arrow made of light and sparks indicates a downward trend. Financial graph showing fall in market value or business decline concept. Decrease line illustrations Red glowing arrow made of light and sparks indicates a downward trend. Financial graph showing fall in market value or business decline concept
Free with trial Set of percentage symbols with hand-drawn arrows portraying both growth and decline, perfect for illustrating financial trends and business data. Decrease line vectors Percentage symbols with sketch style arrows indicating growth and decline, ideal for demonstrating financial performance and. Set of percentage symbols with hand. Set of percentage symbols with hand-drawn arrows portraying both growth and decline, perfect for illustrating financial trends and business data
Free with trial Solid and outline icon of volume down. Design. Decrease line vectors Solid and outline icon of volume down. Design
Free with trial Blue flat visualization showing bar chart and downward arrow over data grid with world map overlay. Analytics, finance, data analysis, digital, infographic, corporate, trend. Decrease line illustrations Blue flat visualization showing bar chart and downward arrow over data grid with world map overlay. Analytics, finance, data analysis, digital, infographic
Free with trial The image depicts a financial graph with a downward trend, represented by red and blue neon lines against a dark, textured concrete wall and floor. the graph starts high on the left and sharply declines towards the lower right, ending with a prominent red arrow pointing downwards. a spotlight from above illuminates the graph, casting shadows and highlighting the rough texture of the concrete, creating a dramatic and somber mood. the overall composition conveys a sense of economic downturn or financial loss. Decrease line illustrations Descending financial graph on dark concrete wall. The image depicts a financial graph with a downward trend, represented by red and blue neon lines against a. the image depicts a financial graph with a downward trend, represented by red and blue neon lines against a dark, textured concrete wall and floor. the graph starts high on the left and sharply declines towards the lower right, ending with a prominent red arrow pointing downwards. a spotlight from above illuminates the graph, casting shadows and highlighting the rough texture of the concrete, creating a dramatic and somber mood. the overall composition conveys a sense of economic downturn or financial loss.
Free with trial A glossy, light blue 3D rendering of a percentage symbol, isolated on a white background. The symbol is smooth and reflective, giving a modern and clean look. Ideal for various design projects, particularly those related to sales, discounts, or financial topics. Decrease line illustrations 3D Blue Percentage Sign. A glossy, light blue 3D rendering of a percentage symbol, isolated on a white background. The symbol is smooth and reflective, giving a. A glossy, light blue 3D rendering of a percentage symbol, isolated on a white background. The symbol is smooth and reflective, giving a modern and clean look. Ideal for various design projects, particularly those related to sales, discounts, or financial topics.
Free with trial A striking 3D rendering depicts a significant financial market decline, symbolized by a bold red arrow sharply pointing downwards across a dark grey background. The scene includes a subtle line graph and bar charts in shades of red and grey, illustrating a negative trend in data. This image effectively conveys concepts of economic recession, stock market crash, business losses, and financial crisis. Ideal for articles, presentations, and reports discussing market downturns, investment risks, or economic challenges. Decrease line illustrations Financial Market Decline with Red Arrow Chart. A striking 3D rendering depicts a significant financial market decline, symbolized by a bold red arrow sharply. A striking 3D rendering depicts a significant financial market decline, symbolized by a bold red arrow sharply pointing downwards across a dark grey background. The scene includes a subtle line graph and bar charts in shades of red and grey, illustrating a negative trend in data. This image effectively conveys concepts of economic recession, stock market crash, business losses, and financial crisis. Ideal for articles, presentations, and reports discussing market downturns, investment risks, or economic challenges.
Free with trial Red financial chart with a sharp downward trend indicating a market crash or economic decline. The graph features jagged, descending lines with timestamps labeled on the x-axis as 06 231 and 08 231. The dark background enhances the focus on the bright red line, making the steep drop in value evident. Occasional data points are highlighted with small glowing dots, emphasizing key moments. The overall design conveys a sense of urgency and loss in financial markets. Decrease line illustrations Dramatic downward trend financial chart illustrating market crash, economic decline, and losses. Red financial chart with a sharp downward trend indicating a. Red financial chart with a sharp downward trend indicating a market crash or economic decline. The graph features jagged, descending lines with timestamps labeled on the x-axis as 06 231 and 08 231. The dark background enhances the focus on the bright red line, making the steep drop in value evident. Occasional data points are highlighted with small glowing dots, emphasizing key moments. The overall design conveys a sense of urgency and loss in financial markets.
Free with trial This showcases a comprehensive set of nine distinct black outline arrow icons on a clean white background. The collection features various arrow designs representing concepts such as multi-directional movement, expansion, contraction, up and down, left and right, two-way exchange, and circular refresh. These versatile symbols are ideal for web design, user interfaces, infographics, presentations, maps, and any project requiring clear visual indicators for direction, navigation, choice, or data flow. Decrease line vectors Versatile Directional Arrow Icons Set. This showcases a comprehensive set of nine distinct black outline arrow icons on a clean white background. The collection. This showcases a comprehensive set of nine distinct black outline arrow icons on a clean white background. The collection features various arrow designs representing concepts such as multi-directional movement, expansion, contraction, up and down, left and right, two-way exchange, and circular refresh. These versatile symbols are ideal for web design, user interfaces, infographics, presentations, maps, and any project requiring clear visual indicators for direction, navigation, choice, or data flow.
Free with trial Health data icon with heartbeat and declining bar chart. Blue square icon with heart rate line, heart symbol, and falling bar chart for health analytics. Decrease line vectors Health data icon with heartbeat and declining bar chart. Blue square icon with heart rate line, heart symbol, and falling bar chart for health analytics
Free with trial A comprehensive set of minimalist linear icons depicting financial analytics and business trends, featuring stacks of coins and both upward and downward trending bar charts. Decrease line vectors Linear Business and Financial Growth Icon Set for Analytics, Investment, and Economic Trend Visualization. A comprehensive set of minimalist linear icons. A comprehensive set of minimalist linear icons depicting financial analytics and business trends, featuring stacks of coins and both upward and downward trending bar charts.
Free with trial Simple graphic design showing interconnected circles, one with a plus sign and the other with a minus sign. Useful for website design, apps, and presentations. Decrease line vectors Plus and Minus Circle Icons: Add and Subtract Symbols. Simple graphic design showing interconnected circles, one with a plus sign and the other with a minus sign. Simple graphic design showing interconnected circles, one with a plus sign and the other with a minus sign. Useful for website design, apps, and presentations.
Free with trial Downfall icon vector image. Suitable for mobile apps, web apps and print media. Decrease line vectors Downfall icon vector image. Suitable for mobile apps, web apps and print media
Free with trial Growth vector icon. Graph or diagram with arrow going up and down. Vector. Illustration. Decrease line vectors Growth vector icon. Graph or diagram with arrow going up and down. Vector. Illustration
Free with trial A black arrow composed of a series of diminishing circles curves downward, ending in a solid triangular arrowhead. The arrow creates a sweeping arc from left to right, enhancing the dynamic motion of the design. The circles decrease in size as they approach the arrowhead, suggesting movement or progression. This minimalist graphic is set against a plain white background, emphasizing the boldness and clarity of the shapes. Decrease line illustrations Arrow with ball. A black arrow composed of a series of diminishing circles curves downward, ending in a solid triangular arrowhead. The arrow creates a sweeping. A black arrow composed of a series of diminishing circles curves downward, ending in a solid triangular arrowhead. The arrow creates a sweeping arc from left to right, enhancing the dynamic motion of the design. The circles decrease in size as they approach the arrowhead, suggesting movement or progression. This minimalist graphic is set against a plain white background, emphasizing the boldness and clarity of the shapes.
Free with trial Red sad face beside a line graph showing a downward trend and a bar graph. Ideal for business loss, economic decline, performance issues, challenges, setbacks, analytics, trends. Simple flat metaphor. Decrease line vectors Declining Chart with Sad Face and Bar Graph Representing Negative Trend and Challenges. Red sad face beside a line graph showing a downward trend and a bar graph. Red sad face beside a line graph showing a downward trend and a bar graph. Ideal for business loss, economic decline, performance issues, challenges, setbacks, analytics, trends. Simple flat metaphor
Free with trial A neon orange graph on a black background shows a sharp decline, symbolizing financial loss or a negative trend. Decrease line illustrations Neon orange downward trending graph with arrow indicating financial decline on a black background. A neon orange graph on a black background shows a sharp. A neon orange graph on a black background shows a sharp decline, symbolizing financial loss or a negative trend
Free with trial Illustration of a smartphone displaying financial charts and a stack of gold coins with dollar signs. Arrows circulate around the phone, suggesting a cycle of investment and growth. The image represents mobile banking, online trading, and the potential for financial success through digital platforms. Decrease line illustrations Mobile Investment and Financial Growth. Illustration of a smartphone displaying financial charts and a stack of gold coins with dollar signs. Arrows circulate. Illustration of a smartphone displaying financial charts and a stack of gold coins with dollar signs. Arrows circulate around the phone, suggesting a cycle of investment and growth. The image represents mobile banking, online trading, and the potential for financial success through digital platforms.
Free with trial A person's open palm supports a glowing neon graph illustrating the relationship between cost and quality with upward and downward arrows. Decrease line illustrations Hand holding glowing cost quality graph palm open. A person's open palm supports a glowing neon graph illustrating the relationship between cost and quality with. A person's open palm supports a glowing neon graph illustrating the relationship between cost and quality with upward and downward arrows
Free with trial Chat arrow down icon. Chat arrow down vector icon set. black and white colors. EPS10. Decrease line vectors Chat arrow down icon. Chat arrow down vector icon set. black and white colors. EPS10
Free with trial Downward graph chart. Isolated on transparent background. Decrease line illustrations Downward graph chart. Isolated on transparent background
 Sign in