Free with trial A dramatic low-light close-up of a investor hand holding a mobile phone displaying a crashing candlestick chart and a bright red sell signal. The background shows a blurred, out-of-focus red market line trending downward. Perfect for financial news, economic crisis reports, cryptocurrency panic trading, and online mobile brokerage app marketing. Decrease line illustrations Hand holding smartphone with stock market crash graph and red sell alert notification over blurred financial charts background. A dramatic low-light close-up of. A dramatic low-light close-up of a investor hand holding a mobile phone displaying a crashing candlestick chart and a bright red sell signal. The background shows a blurred, out-of-focus red market line trending downward. Perfect for financial news, economic crisis reports, cryptocurrency panic trading, and online mobile brokerage app marketing
Free with trial Closeup of male hand analyzing financial graph with stylus. Decrease line illustrations Closeup of male hand analyzing financial graph with stylus.
Free with trial A set of hand drawn black and white graphs and charts for business analysis. Decrease line illustrations A collection of six hand drawn graphs and charts in black and white .ai generate. A set of hand drawn black and white graphs and charts for business analysis. a set of hand drawn black and white graphs and charts for business analysis.
Free with trial Falling financial chart with a sharp decline. Space for text. Decrease line illustrations Falling financial chart with a sharp decline. Space for text. Falling financial chart with a sharp decline. Space for text
Free with trial Decreasing graph icon Business chart with downward arrow Financial loss symbol. AI generated. Decrease line vectors Decreasing graph icon Business chart with downward arrow Financial loss symbol. AI generated
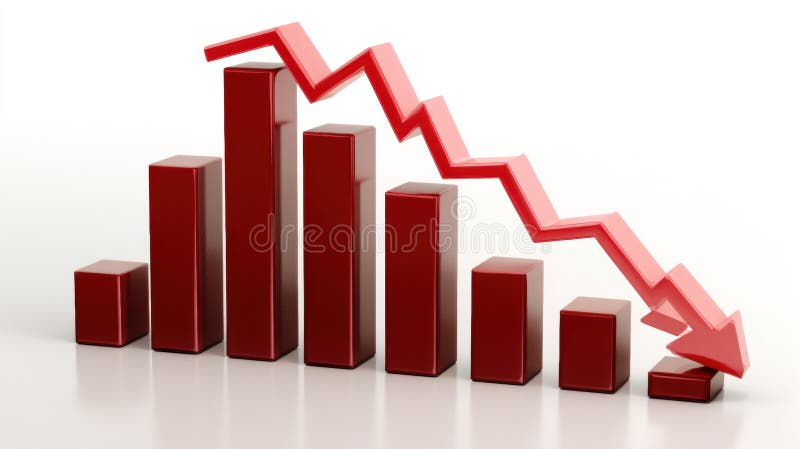
Free with trial This 3D rendering shows a bar graph with a sharp downward trend, symbolized by a large red arrow. The graph visually represents a significant decline or decrease in a particular metric. The dark red bars and bright red arrow create a strong visual impact. Decrease line illustrations Declining Bar Graph. This 3D rendering shows a bar graph with a sharp downward trend, symbolized by a large red arrow. The graph visually represents a. This 3D rendering shows a bar graph with a sharp downward trend, symbolized by a large red arrow. The graph visually represents a significant decline or decrease in a particular metric. The dark red bars and bright red arrow create a strong visual impact.
Free with trial A collection of twenty-four colorful flat line icons arranged in a grid on white background, featuring finance, economy and logistics symbols including globe, delivery trucks, gas pump, charts, graphs, money, dollar coins, magnifying glass, money bag and clipboard. Green, blue and beige palette with dark outlines. Perfect for business presentations, financial reports, infographics, websites, apps and marketing materials related to banking, investment, trade, shipping and market analysis. Decrease line vectors Set of Financial Economy and Logistics Icons. A collection of twenty-four colorful flat line icons arranged in a grid on white background, featuring finance. A collection of twenty-four colorful flat line icons arranged in a grid on white background, featuring finance, economy and logistics symbols including globe, delivery trucks, gas pump, charts, graphs, money, dollar coins, magnifying glass, money bag and clipboard. Green, blue and beige palette with dark outlines. Perfect for business presentations, financial reports, infographics, websites, apps and marketing materials related to banking, investment, trade, shipping and market analysis.
Free with trial Stock market chart displaying investment trends with red and blue candlesticks on a dark background. The chart features a timeline labeled by months at the top and numbers at the bottom, illustrating dynamic financial data. Candlesticks show market fluctuations, with red indicating a decrease and blue an increase in value. A faint blue line overlays the candles, representing the moving average. The scene is likely within a financial or trading setting, emphasizing the analysis of market activity. Decrease line illustrations Dynamic stock market chart with vibrant red and blue candles showing investment trends and financial data. Stock market chart displaying investment trends with. Stock market chart displaying investment trends with red and blue candlesticks on a dark background. The chart features a timeline labeled by months at the top and numbers at the bottom, illustrating dynamic financial data. Candlesticks show market fluctuations, with red indicating a decrease and blue an increase in value. A faint blue line overlays the candles, representing the moving average. The scene is likely within a financial or trading setting, emphasizing the analysis of market activity.
Free with trial Model of house shot on graph depicting mortgage rates. image. Decrease line illustrations Model of house shot on graph depicting mortgage rates. Ai generated image. Model of house shot on graph depicting mortgage rates. image
Free with trial Simple yet effective double lined bold down arrow icon, ideal for website design and app interfaces. This vector illustration symbolizes downloading, saving, or accessing content. Decrease line vectors Double Lined Bold Down Arrow Icon Download Button Symbol. Simple yet effective double lined bold down arrow icon, ideal for website design and app interfaces. Simple yet effective double lined bold down arrow icon, ideal for website design and app interfaces. This vector illustration symbolizes downloading, saving, or accessing content.
Free with trial A conceptual illustration depicting a line graph, structured like a broken bridge, dramatically falling and sinking into the water. This powerful visual metaphor represents a severe economic downturn, financial crisis, stock market crash, or business failure. The collapsing structure plunging into the sea symbolizes recession, bankruptcy, overwhelming debt, and hitting rock bottom. The minimalist vector art style makes it a versatile image for presentations and articles on finance, risk, and economic collapse. Decrease line vectors Economic Downturn and Financial Crisis Concept. A conceptual illustration depicting a line graph, structured like a broken bridge, dramatically falling and. A conceptual illustration depicting a line graph, structured like a broken bridge, dramatically falling and sinking into the water. This powerful visual metaphor represents a severe economic downturn, financial crisis, stock market crash, or business failure. The collapsing structure plunging into the sea symbolizes recession, bankruptcy, overwhelming debt, and hitting rock bottom. The minimalist vector art style makes it a versatile image for presentations and articles on finance, risk, and economic collapse.
Free with trial Black outline of descending bar chart with downward arrow, isolated on white background. concept of economic decline, data analysis, financial crisis, statistics. Decrease line vectors Black outline of descending bar chart with downward arrow, isolated on white background. concept of economic decline, data. Analysis, financial crisis
Free with trial Indent and outdent text formatting icon set for UI design vector. Ideal for web application toolbars and word processor menus. EPS 10. Decrease line vectors Indent and outdent text formatting icon set for UI design vector. Ideal for web application toolbars and word processor menus. EPS 10
Free with trial A neon glowing graph with blue bars and pink zigzag arrow showing fluctuating growth on black background. Generative AI. Decrease line illustrations Neon glowing graph with blue bars and pink zigzag arrow showing fluctuating growth on black background. A neon glowing graph with blue bars and pink zigzag arrow. A neon glowing graph with blue bars and pink zigzag arrow showing fluctuating growth on black background. Generative AI
Free with trial This image was created using Generative AI. A simple line graph showing a downward trend with a black arrow pointing down, indicating decline or loss. Decrease line vectors Declining graph chart with downward trend arrow. This image was created using Generative AI. A simple line graph showing a downward trend with a black arrow. This image was created using Generative AI. A simple line graph showing a downward trend with a black arrow pointing down, indicating decline or loss
Free with trial A colorful collection of flat line icons related to gasoline prices and fuel economy isolated on white background. Includes gas pumps, fuel nozzles, price displays, rising and falling arrows, cars, gauges, charts, money symbols, payment and eco fuel concepts. Perfect for illustrating articles about energy costs, inflation, transportation, oil market trends, and sustainability. Ideal for websites, presentations, infographics, apps, and financial reports on petrol pricing. Decrease line vectors Fuel Price Icons Set with Gas Station Symbols. A colorful collection of flat line icons related to gasoline prices and fuel economy isolated on white background. A colorful collection of flat line icons related to gasoline prices and fuel economy isolated on white background. Includes gas pumps, fuel nozzles, price displays, rising and falling arrows, cars, gauges, charts, money symbols, payment and eco fuel concepts. Perfect for illustrating articles about energy costs, inflation, transportation, oil market trends, and sustainability. Ideal for websites, presentations, infographics, apps, and financial reports on petrol pricing.
Free with trial A colorful chart illustrating energy consumption trends during the spring months of March, April, and May. The chart features a decreasing line graph with floral accents, representing a decline in energy use. Ideal for illustrating sustainability, environmental reports, or seasonal trends. Decrease line illustrations Energy Consumption Chart Spring Months Flowers. A colorful chart illustrating energy consumption trends during the spring months of March, April, and May. The. A colorful chart illustrating energy consumption trends during the spring months of March, April, and May. The chart features a decreasing line graph with floral accents, representing a decline in energy use. Ideal for illustrating sustainability, environmental reports, or seasonal trends
Free with trial This flat-style infographic illustrates a renewable energy distribution network. A central hub featuring a wind turbine and sun symbolizes clean power generation, with teal pipelines and yellow arrows radiating outward to supply various sectors. Connected elements include residential houses, industrial factories, hospitals, and electric vehicles charging at stations. A crossed-out oil barrel with a downward arrow signifies the transition away from fossil fuels. Ideal for concepts regarding sustainable energy, green infrastructure, and environmental conservation. Decrease line vectors Renewable Energy Distribution Network Infographic. This flat-style infographic illustrates a renewable energy distribution network. A central hub featuring a. This flat-style infographic illustrates a renewable energy distribution network. A central hub featuring a wind turbine and sun symbolizes clean power generation, with teal pipelines and yellow arrows radiating outward to supply various sectors. Connected elements include residential houses, industrial factories, hospitals, and electric vehicles charging at stations. A crossed-out oil barrel with a downward arrow signifies the transition away from fossil fuels. Ideal for concepts regarding sustainable energy, green infrastructure, and environmental conservation.
Free with trial Linear shopping bags and downward arrows depicting retail sales and consumer trends, isolated on white generated using AI. Decrease line illustrations Shopping bags outline icon with downward arrows for retail concepts. Linear shopping bags and downward arrows depicting retail sales and consumer trends. Linear shopping bags and downward arrows depicting retail sales and consumer trends, isolated on white generated using AI.
Free with trial A comprehensive collection of modern blue business and financial icons displayed on a grid background. Visual elements include increasing and decreasing bar graphs, currency symbols such as dollar and yen, secure bank vaults, security shields, wallets with money, pie charts, database storage, and business partnership handshakes. This versatile set is ideal for corporate infographics, financial presentations, website design, mobile banking applications, economic reports, and commercial accounting dashboards. Decrease line vectors Set of Blue Business and Finance Vector Icons. A comprehensive collection of modern blue business and financial icons displayed on a grid background. Visual. A comprehensive collection of modern blue business and financial icons displayed on a grid background. Visual elements include increasing and decreasing bar graphs, currency symbols such as dollar and yen, secure bank vaults, security shields, wallets with money, pie charts, database storage, and business partnership handshakes. This versatile set is ideal for corporate infographics, financial presentations, website design, mobile banking applications, economic reports, and commercial accounting dashboards.
Free with trial Three dark grey arrows pointing downwards, stacked vertically, create a simple yet effective visual. This minimalist design is perfect for website interfaces, presentations, or any project requiring a clear indication of downward movement or progression. Decrease line vectors Three Stacked Down Arrows: Simple Geometric Design Element. Three dark grey arrows pointing downwards, stacked vertically, create a simple yet effective visual. Three dark grey arrows pointing downwards, stacked vertically, create a simple yet effective visual. This minimalist design is perfect for website interfaces, presentations, or any project requiring a clear indication of downward movement or progression.
Free with trial The image shows a red line graph sharply decreasing against a backdrop of a city skyline. A light blue line graph also shows a downward trend. Several stylized coronavirus illustrations are superimposed on the image. The overall color palette is cool toned, with the red graph line providing a stark contrast. The style is graphic and illustrative, suggesting a visual representation of economic, generated by AI. Decrease line illustrations Red Decreasing Stock Market Graph Cityscape Coronavirus. The image shows a red line graph sharply decreasing against a backdrop of a city skyline. A light blue. The image shows a red line graph sharply decreasing against a backdrop of a city skyline. A light blue line graph also shows a downward trend. Several stylized coronavirus illustrations are superimposed on the image. The overall color palette is cool toned, with the red graph line providing a stark contrast. The style is graphic and illustrative, suggesting a visual representation of economic, generated by AI.
Free with trial Colorful Infographic Data Visualization On Beige. Background. Decrease line illustrations Colorful Infographic Data Visualization On Beige. Background
Free with trial Red arrow going down stock icon on white background. Bankruptcy, financial market crash icon for your web site design, logo, app, UI. graph chart down trend symbol. chart going down sign. Decrease line vectors Red arrow going down stock icon on white background. Bankruptcy, financial market crash icon for your web site design. Logo, app, UI. graph chart down trend. Red arrow going down stock icon on white background. Bankruptcy, financial market crash icon for your web site design, logo, app, UI. graph chart down trend symbol.chart going down sign.
Free with trial Download progress, time running out, sand flowing downward. Simple, clean vector icon. Decrease line vectors Hourglass Icon Downloading Process, Time Management Symbol. Download progress, time running out, sand flowing downward. Simple, clean vector icon. Download progress, time running out, sand flowing downward. Simple, clean vector icon.
Free with trial A collection of 16 high-quality vector icons focusing on Net Zero goals, carbon offsetting, green technology, and climate change solutions. Perfect for corporate ESG reports and eco-friendly branding. Decrease line vectors Net Zero and Carbon Credit Icon Set, Sustainable Emission Reduction Symbols, Carbon Neutrality and Environmental Conservation. A collection of 16 high-quality. A collection of 16 high-quality vector icons focusing on Net Zero goals, carbon offsetting, green technology, and climate change solutions. Perfect for corporate ESG reports and eco-friendly branding
Free with trial A collection of 15 high-quality vector icons focusing on Net Zero goals, carbon offsetting, green technology, and climate change solutions. Perfect for corporate ESG reports and eco-friendly branding. Decrease line vectors Net Zero and Carbon Credit Icon Set, Sustainable Emission Reduction Symbols, Carbon Neutrality and Environmental Conservation. A collection of 15 high-quality. A collection of 15 high-quality vector icons focusing on Net Zero goals, carbon offsetting, green technology, and climate change solutions. Perfect for corporate ESG reports and eco-friendly branding
Free with trial A collection of 15 high-quality vector icons focusing on Net Zero goals, carbon offsetting, green technology, and climate change solutions. Perfect for corporate ESG reports and eco-friendly branding. Decrease line vectors Net Zero and Carbon Credit Icon Set, Sustainable Emission Reduction Symbols, Carbon Neutrality and Environmental Conservation. A collection of 15 high-quality. A collection of 15 high-quality vector icons focusing on Net Zero goals, carbon offsetting, green technology, and climate change solutions. Perfect for corporate ESG reports and eco-friendly branding
Free with trial A collection of 16 high-quality vector icons focusing on Net Zero goals, carbon offsetting, green technology, and climate change solutions. Perfect for corporate ESG reports and eco-friendly branding. Decrease line vectors Net Zero and Carbon Credit Icon Set, Sustainable Emission Reduction Symbols, Carbon Neutrality and Environmental Conservation. A collection of 16 high-quality. A collection of 16 high-quality vector icons focusing on Net Zero goals, carbon offsetting, green technology, and climate change solutions. Perfect for corporate ESG reports and eco-friendly branding
Free with trial A collection of 15 high-quality vector icons focusing on Net Zero goals, carbon offsetting, green technology, and climate change solutions. Perfect for corporate ESG reports and eco-friendly branding. Decrease line vectors Net Zero and Carbon Credit Icon Set, Sustainable Emission Reduction Symbols, Carbon Neutrality and Environmental Conservation. A collection of 15 high-quality. A collection of 15 high-quality vector icons focusing on Net Zero goals, carbon offsetting, green technology, and climate change solutions. Perfect for corporate ESG reports and eco-friendly branding
Free with trial Collection of 16 high-quality vector icons focusing on Net Zero goals, carbon offsetting, green technology, and climate change solutions. Perfect for corporate ESG reports and eco-friendly branding. Decrease line vectors Net Zero and Carbon Credit Icon Set, Sustainable Emission Reduction Symbols, Carbon Neutrality and Environmental Conservation. Collection of 16 high-quality. Collection of 16 high-quality vector icons focusing on Net Zero goals, carbon offsetting, green technology, and climate change solutions. Perfect for corporate ESG reports and eco-friendly branding
Free with trial Digital illustration depicting a financial decline with red downward-trending graphs, coin stacks, and scattered currency symbols. Set against a dark grid background with neon highlights, this image conveys themes of market loss, economic recession, and financial analysis—ideal for business, editorial, and presentation use. Decrease line illustrations Economic Downturn Illustration Red Decline Graph with Coin Stacks on Digital Grid. Digital illustration depicting a financial decline with red downward-trending. Digital illustration depicting a financial decline with red downward-trending graphs, coin stacks, and scattered currency symbols. Set against a dark grid background with neon highlights, this image conveys themes of market loss, economic recession, and financial analysis—ideal for business, editorial, and presentation use.
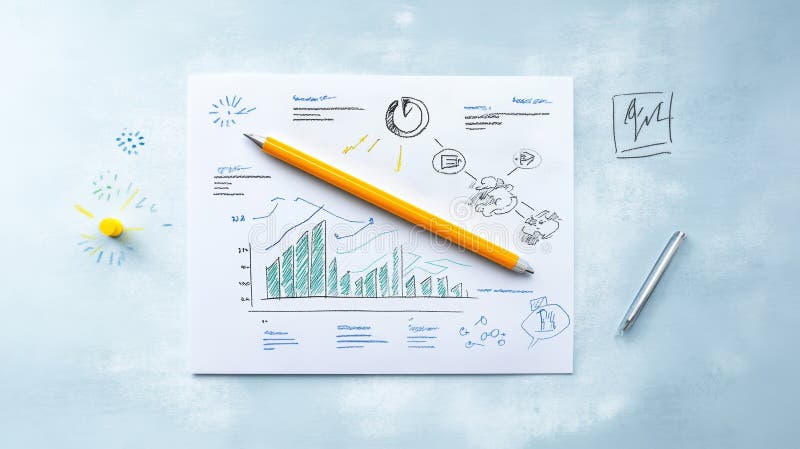
Free with trial Pencil and paper, a detailed illustration of graph for data analysis visualization. Graph depiction on paper with a pencil ,Generative ai. Decrease line illustrations Pencil and paper, a detailed illustration of graph for data analysis visualization. Graph depiction on paper with a pencil ,Generative ai
Free with trial This image was created using Generative AI. A set of financial icons featuring graphs, charts, and money. Business and finance concepts. Decrease line vectors Financial icons set with graphs, charts, and money. This image was created using Generative AI. A set of financial icons featuring graphs, charts, and money. This image was created using Generative AI. A set of financial icons featuring graphs, charts, and money. Business and finance concepts
Free with trial Collection of thirty-two colorful flat line icons related to business, finance and economy on white background. Includes symbols for money, banking, investment, charts, growth, taxes, bills, shopping carts, shipping, logistics, real estate and analytics. Designed in orange, red, blue and yellow outline style. Perfect concept for financial reports, presentations, websites, mobile apps, infographics and marketing materials illustrating global trade, commerce and economic trends. Decrease line vectors Colorful Business Finance and Economy Icon Set. Collection of thirty-two colorful flat line icons related to business, finance and economy on white background. Collection of thirty-two colorful flat line icons related to business, finance and economy on white background. Includes symbols for money, banking, investment, charts, growth, taxes, bills, shopping carts, shipping, logistics, real estate and analytics. Designed in orange, red, blue and yellow outline style. Perfect concept for financial reports, presentations, websites, mobile apps, infographics and marketing materials illustrating global trade, commerce and economic trends.
Free with trial Stack of gold coins are arranged against a backdrop of a red descending graph line, signifying financial loss, economic downturn, and market challenges. Image is generated using AI. Decrease line illustrations Stack Of Coins With Falling Graph. Stack of gold coins are arranged against a backdrop of a red descending graph line, signifying financial loss, economic. Stack of gold coins are arranged against a backdrop of a red descending graph line, signifying financial loss, economic downturn, and market challenges. Image is generated using AI
Free with trial Infographic collage illustrating rising fuel prices and economic inflation with multiple line and bar charts showing upward and downward trends. Central image features a fuel pump nozzle over a bold red-orange rising arrow, surrounded by icons of shopping carts, houses, coins, and delivery trucks. Blue, gray, and red graphs depict cost increases. Ideal for articles on energy, economy, inflation, logistics, and financial analysis. Decrease line vectors Rising Fuel Prices and Inflation Economic Charts. Infographic collage illustrating rising fuel prices and economic inflation with multiple line and bar charts. Infographic collage illustrating rising fuel prices and economic inflation with multiple line and bar charts showing upward and downward trends. Central image features a fuel pump nozzle over a bold red-orange rising arrow, surrounded by icons of shopping carts, houses, coins, and delivery trucks. Blue, gray, and red graphs depict cost increases. Ideal for articles on energy, economy, inflation, logistics, and financial analysis.
Free with trial A bold diagonal arrow pointing toward the bottom-right direction, symbolizing decline, downward trends, price drops, and lower-right navigation. Decrease line vectors Diagonal Downward Pointing Arrow Trend Symbol. A bold diagonal arrow pointing toward the bottom-right direction, symbolizing decline, downward trends, price. A bold diagonal arrow pointing toward the bottom-right direction, symbolizing decline, downward trends, price drops, and lower-right navigation.
Free with trial Chart illustrating performance trends with emotive faces, team photos, analytic symbols thumbs up an atom and checkmark. Ideal for teamwork, strategy, data, feedback, process, analysis charts. Decrease line vectors Business Performance Trends Featuring Emotional Reactions Across Team Members and Analytics. Chart illustrating performance trends with emotive faces, team. Chart illustrating performance trends with emotive faces, team photos, analytic symbols thumbs up an atom and checkmark. Ideal for teamwork, strategy, data, feedback, process, analysis charts
Free with trial A sleek and modern 3D rendering of a percentage symbol, featuring two circular shapes connected by a diagonal line. The design is minimalist, with a light gray color and soft shadows, creating a clean and professional appearance against a plain white background. Decrease line illustrations Minimalist percentage symbol in clean 3d design. A sleek and modern 3D rendering of a percentage symbol, featuring two circular shapes connected by a diagonal. A sleek and modern 3D rendering of a percentage symbol, featuring two circular shapes connected by a diagonal line. The design is minimalist, with a light gray color and soft shadows, creating a clean and professional appearance against a plain white background
Free with trial A simple black outline of a percent sign sits centered against a solid peach background, with two rounded circles separated by a slanting diagonal stroke. Its clean, hand-drawn contours and generous empty space give the graphic a minimalist, uncluttered appearance. The warm, even color and strong dark lines create a calm, clear visual contrast suitable for illustrating percentages or mathematical concepts. Decrease line vectors Minimalist Percent Symbol Graphic Design. A simple black outline of a percent sign sits centered against a solid peach background, with two rounded circles. A simple black outline of a percent sign sits centered against a solid peach background, with two rounded circles separated by a slanting diagonal stroke. Its clean, hand-drawn contours and generous empty space give the graphic a minimalist, uncluttered appearance. The warm, even color and strong dark lines create a calm, clear visual contrast suitable for illustrating percentages or mathematical concepts.
Free with trial A silver laptop sits on a light brown wooden surface. Its screen displays a dark background with a grid pattern and a prominent red line graph sharply declining from left to right. The red line is brightly lit, creating a strong visual contrast against the dark background. The overall mood is one of concern or warning, suggesting a negative trend or decline. The image is clean and simple, focusing, generated by AI. Decrease line illustrations Laptop Screen Showing Red Downward Trend Graph computer. A silver laptop sits on a light brown wooden surface. Its screen displays a dark background with a grid. A silver laptop sits on a light brown wooden surface. Its screen displays a dark background with a grid pattern and a prominent red line graph sharply declining from left to right. The red line is brightly lit, creating a strong visual contrast against the dark background. The overall mood is one of concern or warning, suggesting a negative trend or decline. The image is clean and simple, focusing, generated by AI.
Free with trial A clean, minimalist set of line art icons representing business and service plan management. The icons depict 'Plan Switch' with a toggle symbol, 'Upgrade' with an upward arrow, and 'Downgrade' with a downward arrow. Another 'Downgrade' icon shows a document transitioning to a dollar sign, indicating a change in service level or cost. These graphics are ideal for websites, apps, presentations, and marketing materials related to subscription services, software features, or financial planning. Decrease line illustrations Business Plan Icons: Upgrade, Downgrade, and Switch. A clean, minimalist set of line art icons representing business and service plan management. The icons. A clean, minimalist set of line art icons representing business and service plan management. The icons depict 'Plan Switch' with a toggle symbol, 'Upgrade' with an upward arrow, and 'Downgrade' with a downward arrow. Another 'Downgrade' icon shows a document transitioning to a dollar sign, indicating a change in service level or cost. These graphics are ideal for websites, apps, presentations, and marketing materials related to subscription services, software features, or financial planning.
Free with trial A collection of thirty-two colorful flat line icons arranged in grid on white background illustrating logistics, delivery, supply chain and financial concepts. Includes trucks, delivery workers, parcels, warehouse, drone, fuel, maps, gears, charts showing profit loss, expenses, money bags, coins and scales. Bright orange, blue and red colors with black outlines. Ideal for business presentations, e-commerce, transportation, accounting and marketing materials. Decrease line vectors Colorful Logistics and Business Finance Icon Set. A collection of thirty-two colorful flat line icons arranged in grid on white background illustrating logistics. A collection of thirty-two colorful flat line icons arranged in grid on white background illustrating logistics, delivery, supply chain and financial concepts. Includes trucks, delivery workers, parcels, warehouse, drone, fuel, maps, gears, charts showing profit loss, expenses, money bags, coins and scales. Bright orange, blue and red colors with black outlines. Ideal for business presentations, e-commerce, transportation, accounting and marketing materials.
Free with trial Set of six green eco-friendly line icons on white background illustrating carbon footprint management, CO2 emissions tracking, energy efficiency, and sustainable development. Includes symbols for industrial processes, audit checklist, digital monitoring, footprint report, renewable energy roadmap, and global performance gauge. Perfect for environmental presentations, sustainability reports, climate change articles, ESG infographics, and green business concepts promoting net zero and decarbonization strategies. Decrease line vectors Green Carbon Footprint Sustainability Icons Set. Set of six green eco-friendly line icons on white background illustrating carbon footprint management, CO2. Set of six green eco-friendly line icons on white background illustrating carbon footprint management, CO2 emissions tracking, energy efficiency, and sustainable development. Includes symbols for industrial processes, audit checklist, digital monitoring, footprint report, renewable energy roadmap, and global performance gauge. Perfect for environmental presentations, sustainability reports, climate change articles, ESG infographics, and green business concepts promoting net zero and decarbonization strategies.
Free with trial A set of twenty-eight flat line icons in orange, black and gray illustrating energy crisis, fuel prices, and economic trends. Includes symbols for oil pumps, gas stations, power grids, solar panels, wind turbines, batteries, rising and falling charts, dollars, inflation, supply chain breaks, global trade, and consumer stress. Isolated on white background. Ideal for financial reports, news articles, presentations, and websites covering energy markets, inflation, sustainability, and economic forecasting. Decrease line vectors Energy Crisis Market Trends Icon Collection Set. A set of twenty-eight flat line icons in orange, black and gray illustrating energy crisis, fuel prices, and. A set of twenty-eight flat line icons in orange, black and gray illustrating energy crisis, fuel prices, and economic trends. Includes symbols for oil pumps, gas stations, power grids, solar panels, wind turbines, batteries, rising and falling charts, dollars, inflation, supply chain breaks, global trade, and consumer stress. Isolated on white background. Ideal for financial reports, news articles, presentations, and websites covering energy markets, inflation, sustainability, and economic forecasting.
Free with trial Collection of colorful line icons related to finance, economy and logistics on white background, featuring money bags, dollar coins, banknotes, bar charts with up and down arrows, calculator, briefcase, delivery truck, cargo ship, boxes and location pins. Large central icon shows falling graph over money and bars symbolizing recession, loss and market crash. Ideal for business presentations, economic reports, banking, investment, accounting and supply chain concepts. Decrease line vectors Financial crisis icons set with declining chart. Collection of colorful line icons related to finance, economy and logistics on white background, featuring money. Collection of colorful line icons related to finance, economy and logistics on white background, featuring money bags, dollar coins, banknotes, bar charts with up and down arrows, calculator, briefcase, delivery truck, cargo ship, boxes and location pins. Large central icon shows falling graph over money and bars symbolizing recession, loss and market crash. Ideal for business presentations, economic reports, banking, investment, accounting and supply chain concepts.
Free with trial A collection of thirty-two colorful flat line business and finance icons arranged in grid on white background. Includes charts, graphs, candlesticks, pie charts, bull and bear markets, rockets, wallets, coins, calculator, shopping cart, target, gears, clock, real estate and documents. Modern outline style with blue, red and orange colors. Perfect for financial presentations, investment apps, banking websites, economic reports, marketing materials and infographics illustrating growth, trading and success concepts. Decrease line vectors Colorful Business Finance Stock Market Icon Set. A collection of thirty-two colorful flat line business and finance icons arranged in grid on white background. A collection of thirty-two colorful flat line business and finance icons arranged in grid on white background. Includes charts, graphs, candlesticks, pie charts, bull and bear markets, rockets, wallets, coins, calculator, shopping cart, target, gears, clock, real estate and documents. Modern outline style with blue, red and orange colors. Perfect for financial presentations, investment apps, banking websites, economic reports, marketing materials and infographics illustrating growth, trading and success concepts.
Free with trial Flat showing an oil barrel with fuel pump nozzle in center surrounded by rising orange and falling gray arrows, bar charts, line graphs, cargo ship, airplane, factories, pressure gauge and gold coins on white background. Concept represents crude oil price volatility, fuel cost inflation, energy market trends, transportation expenses and industrial impact. Ideal for business, finance, economy articles, energy reports and investment presentations. Decrease line vectors Rising Oil Prices Affecting Global Economy Growth. Flat showing an oil barrel with fuel pump nozzle in center surrounded by rising orange and falling gray arrows. Flat showing an oil barrel with fuel pump nozzle in center surrounded by rising orange and falling gray arrows, bar charts, line graphs, cargo ship, airplane, factories, pressure gauge and gold coins on white background. Concept represents crude oil price volatility, fuel cost inflation, energy market trends, transportation expenses and industrial impact. Ideal for business, finance, economy articles, energy reports and investment presentations.
Free with trial A vector illustration depicting a red downward trending line graph with a coin falling below it. The word FAILURE is prominently displayed alongside the graph. The color palette is primarily red and maroon against a light gray background. The style is simple and minimalist, suitable for presentations or reports related to financial loss or business failure. The image conveys a sense of decline and. Decrease line illustrations Red Downward Trend Graph Coin Failure Vector Illustration. A vector illustration depicting a red downward trending line graph with a coin falling below it. The. A vector illustration depicting a red downward trending line graph with a coin falling below it. The word FAILURE is prominently displayed alongside the graph. The color palette is primarily red and maroon against a light gray background. The style is simple and minimalist, suitable for presentations or reports related to financial loss or business failure. The image conveys a sense of decline and
Free with trial A graphic illustration depicts a bear symbolizing a bear market, juxtaposed with a descending stock chart. A prominent red arrow points downward, indicating a decrease. The background features a grid of fluctuating stock prices and numerical indicators, emphasizing market downturn. The overall color scheme is blue with red accents. The image conveys the concept of declining financial performance in stock markets. Decrease line illustrations Bear Market Illustration with Stock Chart and Decreasing Arrow. A graphic illustration depicts a bear symbolizing a bear market, juxtaposed with a descending. A graphic illustration depicts a bear symbolizing a bear market, juxtaposed with a descending stock chart. A prominent red arrow points downward, indicating a decrease. The background features a grid of fluctuating stock prices and numerical indicators, emphasizing market downturn. The overall color scheme is blue with red accents. The image conveys the concept of declining financial performance in stock markets.
Free with trial Vector showing a large balance scale comparing transportation costs in a modern city. One side holds a fuel pump, taxi, truck, money bags, coins and rising cost symbols representing expensive private car use. The other side holds a tram and cyclist representing affordable public transport. City skyline, roads and cars appear below with a declining graph line. Ideal for articles on fuel prices, economy, sustainability, urban mobility and financial planning. Decrease line vectors Cost Comparison Between Cars and Public Transport. Vector showing a large balance scale comparing transportation costs in a modern city. One side holds a fuel. Vector showing a large balance scale comparing transportation costs in a modern city. One side holds a fuel pump, taxi, truck, money bags, coins and rising cost symbols representing expensive private car use. The other side holds a tram and cyclist representing affordable public transport. City skyline, roads and cars appear below with a declining graph line. Ideal for articles on fuel prices, economy, sustainability, urban mobility and financial planning.
Free with trial Declining red arrow and bar graph against a matching backdrop visually represent a significant economic downturn and financial market losses indicating potential business risks and investment failure. Decrease line illustrations Red downward trend line and bar graph illustrate economic decline and financial market downturn effect. Declining red arrow and bar graph against a matching. Declining red arrow and bar graph against a matching backdrop visually represent a significant economic downturn and financial market losses indicating potential business risks and investment failure
Free with trial Decreasing stacked coins icon representing financial loss and economic decline. Decrease line illustrations Decreasing stacked coins icon representing financial loss and economic decline.
Free with trial Decreasing stacked coins icon representing financial loss and economic decline. Decrease line illustrations Decreasing stacked coins icon representing financial loss and economic decline.
Free with trial This infographic visually represents the concept of the 'long tail' versus 'niche' markets. A curved line descends from a high point labeled 'LONG' and then flattens out, indicating a broad range of products or services with low individual demand. This is contrasted with a series of bars, initially tall and labeled 'HITS', representing popular items, which then decrease in height and become more numerous, illustrating the 'niche' market where many specialized items collectively form a significant market share. The chart is ideal for illustrating business strategies, market analysis, and economic trends. Decrease line vectors Long Tail vs. Niche Market Performance Chart. This infographic visually represents the concept of the 'long tail' versus 'niche' markets. A curved line descends. This infographic visually represents the concept of the 'long tail' versus 'niche' markets. A curved line descends from a high point labeled 'LONG' and then flattens out, indicating a broad range of products or services with low individual demand. This is contrasted with a series of bars, initially tall and labeled 'HITS', representing popular items, which then decrease in height and become more numerous, illustrating the 'niche' market where many specialized items collectively form a significant market share. The chart is ideal for illustrating business strategies, market analysis, and economic trends.
Free with trial Growth and decline 3D bar chart with upward trend. 3D bar chart illustrating decline in red and growth in green with upward trend line. Decrease line illustrations Growth and decline 3D bar chart with upward trend. 3D bar chart illustrating decline in red and growth in green with upward trend line
Free with trial Abstract 3D render of a colorful descending bar chart with cubes. Perfect for data visualization, business presentations, or illustrating trends. Representing financial, statistical or marketing information. Decrease line illustrations Colorful 3D Bar Chart, Data Visualization Concept. Abstract 3D render of a colorful descending bar chart with cubes. Perfect for data visualization, business. Abstract 3D render of a colorful descending bar chart with cubes. Perfect for data visualization, business presentations, or illustrating trends. Representing financial, statistical or marketing information.
Free with trial Set of sixteen clean energy and eco friendly icons. Modern flat icons representing renewable energy, sustainability, and smart home technology concepts. Decrease line vectors Set of sixteen clean energy and eco friendly icons. Modern flat icons representing renewable energy, sustainability, and smart home technology concepts
Free with trial Colorful flat line icon set titled Subsidy Policy Impact arranged in grid on white background. Includes symbols for taxation, agriculture, farming tractor, housing, shopping discounts, renewable energy, public transport, education, healthcare costs, small business, international shipping, industry, fuel, and financial growth charts. Modern outline style with red, blue, green and orange colors. Ideal for economic presentations, government policy reports, financial articles, educational materials, and infographics about subsidies and economic development. Decrease line vectors Subsidy Policy Impact Colorful Economy Icons Set. Colorful flat line icon set titled Subsidy Policy Impact arranged in grid on white background. Includes symbols. Colorful flat line icon set titled Subsidy Policy Impact arranged in grid on white background. Includes symbols for taxation, agriculture, farming tractor, housing, shopping discounts, renewable energy, public transport, education, healthcare costs, small business, international shipping, industry, fuel, and financial growth charts. Modern outline style with red, blue, green and orange colors. Ideal for economic presentations, government policy reports, financial articles, educational materials, and infographics about subsidies and economic development.
Free with trial The image depicts a visual metaphor for financial decline or economic downturn. It shows four progressively smaller stacks of gold coins, each stack decreasing in height from left to right. A bold red downward-sloping arrow overlays the stacks, emphasizing the trend of decreasing value or wealth. This imagery is often used to symbolize economic recession, loss of savings, or diminishing returns in. Decrease line illustrations Declining financial prosperity represented by shrinking stacks of gold coins and a downward trend line. The image depicts a visual metaphor for financial decline. The image depicts a visual metaphor for financial decline or economic downturn. It shows four progressively smaller stacks of gold coins, each stack decreasing in height from left to right. A bold red downward-sloping arrow overlays the stacks, emphasizing the trend of decreasing value or wealth. This imagery is often used to symbolize economic recession, loss of savings, or diminishing returns in
Free with trial Stock Chart Icon on Red Background. A black stock chart icon with upward and downward trends is displayed on a red background to represent business growth. Decrease line illustrations Stock Chart Icon on Red Background. A black stock chart icon with upward and downward trends is displayed on a red background to represent business growth
Free with trial A whiteboard displays a hand-drawn graph depicting a sharp downward trend in a market or economic indicator. Red markers highlight significant drops, illustrating a period of substantial decline. The graph suggests a potential crisis or recession. Decrease line illustrations Declining Market Trend. A whiteboard displays a hand-drawn graph depicting a sharp downward trend in a market or economic indicator. Red markers highlight. A whiteboard displays a hand-drawn graph depicting a sharp downward trend in a market or economic indicator. Red markers highlight significant drops, illustrating a period of substantial decline. The graph suggests a potential crisis or recession.
Free with trial Colorful flat line icon collection illustrating inflation, rising costs and economic downturn on white background. Includes symbols for groceries, housing, fuel, utilities, transport, healthcare, education, savings, logistics and global finance with up and down arrows, money stacks and piggy banks. Central devaluation concept. Ideal for financial articles, economics presentations, business reports, news about cost of living crisis, recession and budgeting. Decrease line vectors Inflation Rising Prices Cost Of Living Icons Set. Colorful flat line icon collection illustrating inflation, rising costs and economic downturn on white. Colorful flat line icon collection illustrating inflation, rising costs and economic downturn on white background. Includes symbols for groceries, housing, fuel, utilities, transport, healthcare, education, savings, logistics and global finance with up and down arrows, money stacks and piggy banks. Central devaluation concept. Ideal for financial articles, economics presentations, business reports, news about cost of living crisis, recession and budgeting.
Free with trial A collection of twenty-four colorful flat line icons on white background representing business, finance and logistics concepts including factory growth, cargo ship, airplane, handshake deal, bar charts, shopping cart, real estate, delivery truck, coins, piggy bank, innovation bulb, balance scale, wallet, time management, global shipping, warehouse forklift, drone delivery, train freight, currency decline, fuel pump, oil barrel and money tree. Ideal for presentations, websites, apps, infographics and marketing materials. Decrease line vectors Colorful Business Finance and Logistics Icon Set. A collection of twenty-four colorful flat line icons on white background representing business, finance and. A collection of twenty-four colorful flat line icons on white background representing business, finance and logistics concepts including factory growth, cargo ship, airplane, handshake deal, bar charts, shopping cart, real estate, delivery truck, coins, piggy bank, innovation bulb, balance scale, wallet, time management, global shipping, warehouse forklift, drone delivery, train freight, currency decline, fuel pump, oil barrel and money tree. Ideal for presentations, websites, apps, infographics and marketing materials.
Free with trial A vibrant 3D rendered image featuring a large, stylized arrow pointing downwards, outlined with bright blue and pink neon lights. The arrow stands on a dark, textured floor, from which glowing parallel lines of similar neon hues extend into the distance, creating a sense of depth and direction. This modern and futuristic graphic is ideal for concepts related to download, direction, data flow, decline, or digital navigation. Generated by AI. Decrease line illustrations Neon Down Arrow and Glowing Lines on Dark Textured Surface. A vibrant 3D rendered image featuring a large, stylized arrow pointing downwards, outlined with. A vibrant 3D rendered image featuring a large, stylized arrow pointing downwards, outlined with bright blue and pink neon lights. The arrow stands on a dark, textured floor, from which glowing parallel lines of similar neon hues extend into the distance, creating a sense of depth and direction. This modern and futuristic graphic is ideal for concepts related to download, direction, data flow, decline, or digital navigation. Generated by AI
Free with trial A colorful graphic of a globe with the words "Economic Outlook" written below it. The image is abstract and has a playful, whimsical feel to it. Decrease line illustrations A colorful graphic of a globe with the words "Economic Outlook" written below it. The image is abstract and has a playful, whimsical feel to it
Free with trial Simple logo design with three horizontal, rounded teal bars stacked vertically on a dark background. The bars decrease in length from top to bottom, forming a stylized, abstract shape. Decrease line vectors Strawberry menu icon for navigation button. Simple logo design with three horizontal, rounded teal bars stacked vertically on a dark background. The bars. Simple logo design with three horizontal, rounded teal bars stacked vertically on a dark background. The bars decrease in length from top to bottom, forming a stylized, abstract shape.
Free with trial Set of six black business charts icons showing growth and decline trends with arrows and bars in vector style clear and simple design calm. Generative AI. Decrease line vectors Business growth and decline charts arrows statistics bar graph icons vector illustration. Set of six black business charts icons showing growth and decline. Set of six black business charts icons showing growth and decline trends with arrows and bars in vector style clear and simple design calm. Generative AI
Free with trial Minus Icon Symbol mark in filled style. Minus Icon Vector symbol or sign set collection in black and white outline. Decrease line vectors Minus Icon Symbol mark in filled style. Minus Icon Vector symbol or sign set collection in black and white outline
Free with trial A man in a blue suit and striped tie draws a white line graph showing declining profits and increasing costs against a dark blue gradient background. Decrease line illustrations Man in blue suit draws declining profit graph holding smartphone business chart. A man in a blue suit and striped tie draws a white line graph showing declining. A man in a blue suit and striped tie draws a white line graph showing declining profits and increasing costs against a dark blue gradient background
Free with trial Infographic showing fluctuating economic trends with rising arrows, bar charts and line graphs. Includes icons for housing, shopping cart groceries, fuel pump and falling coins representing inflation, cost of living and market volatility. Blue, red, gray and orange symbols on white background. Ideal for finance, economy, recession, budgeting, real estate and energy articles, presentations and reports about price increases and financial planning. Decrease line vectors Rising Inflation Costs Housing Groceries Fuel Chart. Infographic showing fluctuating economic trends with rising arrows, bar charts and line graphs. Includes. Infographic showing fluctuating economic trends with rising arrows, bar charts and line graphs. Includes icons for housing, shopping cart groceries, fuel pump and falling coins representing inflation, cost of living and market volatility. Blue, red, gray and orange symbols on white background. Ideal for finance, economy, recession, budgeting, real estate and energy articles, presentations and reports about price increases and financial planning.
Free with trial The image features two arrows, one red and one green, pointing in opposite directions. The red arrow points upwards and contains a percentage symbol, while the green arrow points downwards and features a zigzag line. The arrows are set against a plain white background. Decrease line illustrations A red arrow and a green arrow with percentage and zigzag symbols. The image features two arrows, one red and one green, pointing in opposite directions. The red. The image features two arrows, one red and one green, pointing in opposite directions. The red arrow points upwards and contains a percentage symbol, while the green arrow points downwards and features a zigzag line. The arrows are set against a plain white background
Free with trial A collection of forty colorful flat line icons arranged in a grid on white background featuring financial, logistics and food cost symbols. Includes dollar coins, money bags, banknotes, growth charts, delivery trucks, shipping containers, and restaurant plates with coins. Designed in orange, green and red tones with brown outlines. Perfect for illustrating economy, trade, inflation, transport, business finance, e-commerce and food price concepts in presentations, websites and infographics. Decrease line vectors Colorful Finance Logistics and Food Cost Icons Set. A collection of forty colorful flat line icons arranged in a grid on white background featuring financial. A collection of forty colorful flat line icons arranged in a grid on white background featuring financial, logistics and food cost symbols. Includes dollar coins, money bags, banknotes, growth charts, delivery trucks, shipping containers, and restaurant plates with coins. Designed in orange, green and red tones with brown outlines. Perfect for illustrating economy, trade, inflation, transport, business finance, e-commerce and food price concepts in presentations, websites and infographics.
Free with trial Business go bankruptcy icon, economic crisis and money loss, downturn symbol, features closed store, kiosk, or shop building. Isolated vector linear sign of financial distress, wrong niche selection. Decrease line vectors Business go bankruptcy icon, crisis and money loss. Business go bankruptcy icon, economic crisis and money loss, downturn symbol, features closed store, kiosk. Business go bankruptcy icon, economic crisis and money loss, downturn symbol, features closed store, kiosk, or shop building. Isolated vector linear sign of financial distress, wrong niche selection
Free with trial A 3D golden financial graph depicts a downward trend, with a prominent descending line and accompanying bar chart elements. The metallic gold material and smooth, wavy lines flowing beneath create a sense of dynamic movement. The dark blue background provides contrast to the golden elements. Decrease line illustrations Golden Downward Trend Financial Graph with Wavy Lines and Bar Chart decline loss. A 3D golden financial graph depicts a downward trend, with a prominent. A 3D golden financial graph depicts a downward trend, with a prominent descending line and accompanying bar chart elements. The metallic gold material and smooth, wavy lines flowing beneath create a sense of dynamic movement. The dark blue background provides contrast to the golden elements
Free with trial A minimalist vector icon of a low battery status on a white background. The simple outline features a grey fill indicating a low charge level. Ideal for technology, UI design, and energy depletion concepts. Decrease line vectors Minimalist Low Battery Status Icon Vector Illustration. A minimalist vector icon of a low battery status on a white background. The simple outline features a. A minimalist vector icon of a low battery status on a white background. The simple outline features a grey fill indicating a low charge level. Ideal for technology, UI design, and energy depletion concepts.
Free with trial Hand drawn bar graph showing a downward trend with a sale tag for discounts price reductions and market decline. AI generated. Decrease line vectors Hand drawn bar graph showing a downward trend with a sale tag for discounts price reductions and market decline. AI generated
 Sign in