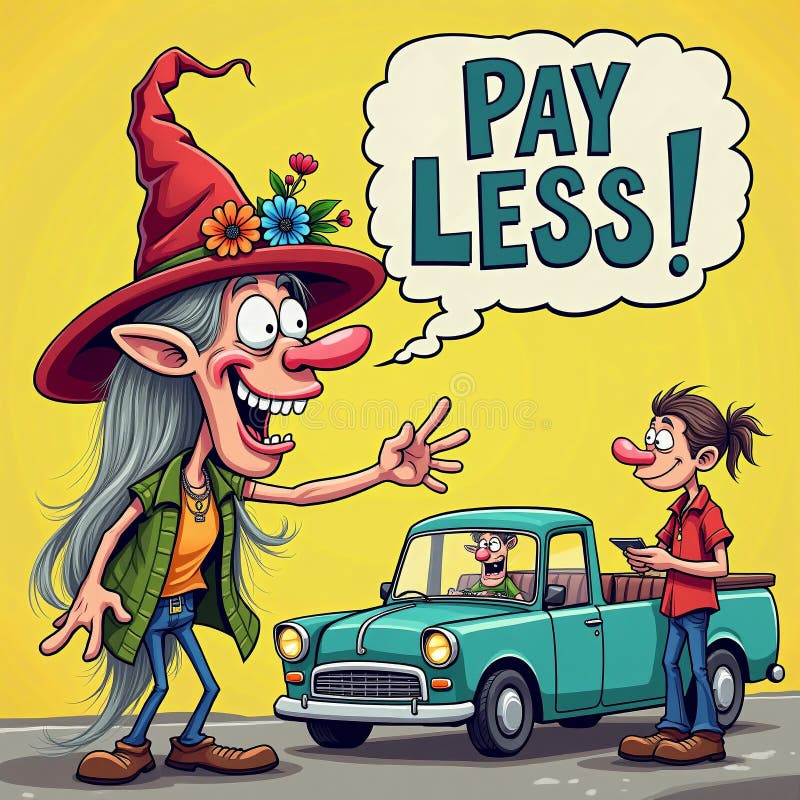
Free with trial Sign text character of pay less and smart shop shopper consumer is product price increase decrease and buyer education information AI illustration cartoon is happy face used car buy and value check checking. Speech blank bubble. Decrease price illustrations Sign text character pay less smart shop shopper consumer product price education information. Sign text character of pay less and smart shop shopper consumer is product price increase decrease and buyer education information AI illustration cartoon is happy face used car buy and value check checking. Speech blank bubble.
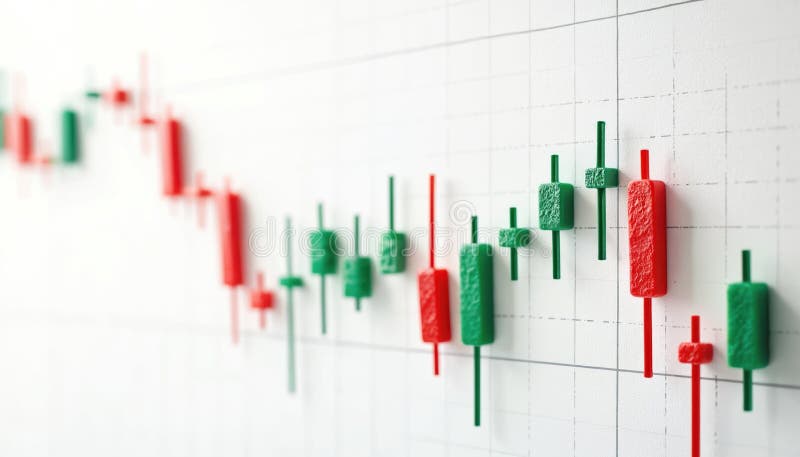
Free with trial Candlestick chart shows stock market fluctuations. Green candles show price increase, red candles pointing price decrease. Financial diagram of investment chart shows up down trends. Decrease price illustrations Candlestick chart shows stock market fluctuations. Green candles show price increase, red candles pointing price decrease.
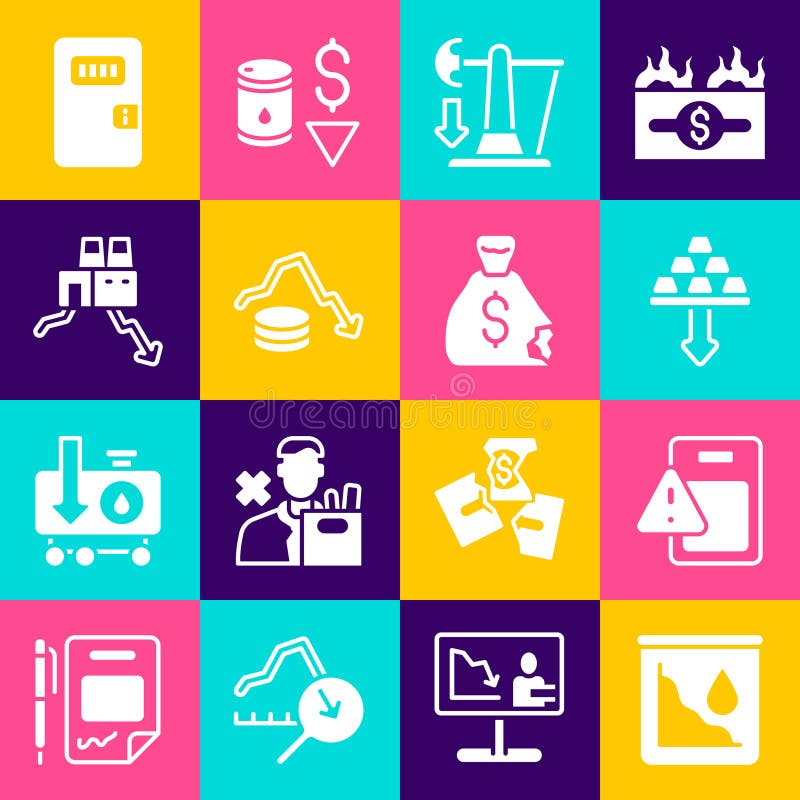
Free with trial Set Drop in crude oil price Global economic crisis Gold bars Dollar rate decrease Shutdown of factory Prison cell door and Money bag icon. Vector. Decrease price illustrations Set Drop in crude oil price, Global economic crisis, Gold bars, Dollar rate decrease, Shutdown of factory, Prison cell. Set Drop in crude oil price Global economic crisis Gold bars Dollar rate decrease Shutdown of factory Prison cell door and Money bag icon. Vector.
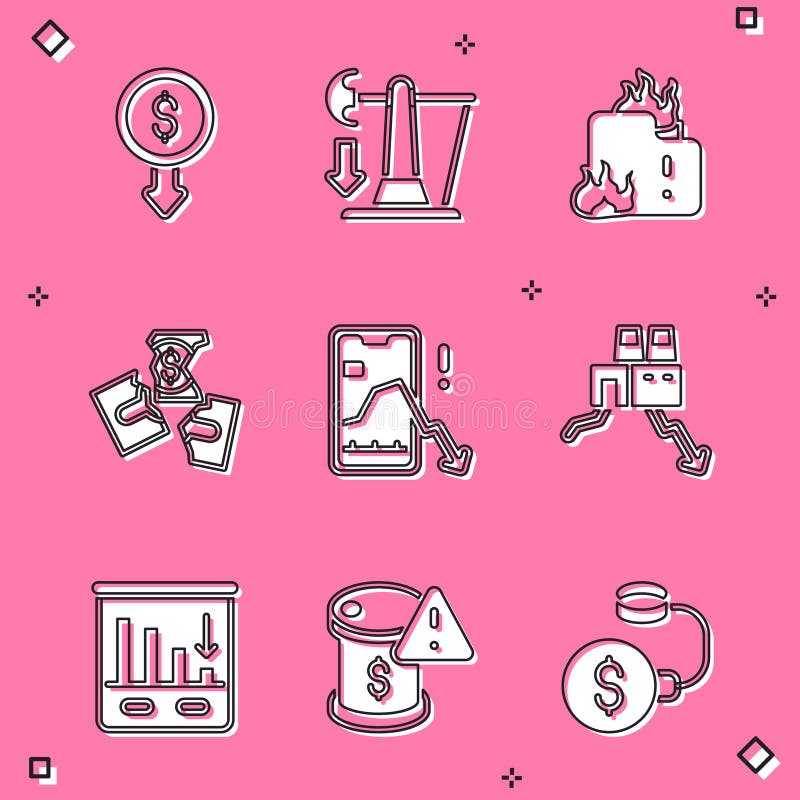
Free with trial Price, rate, profit increase and decrease icon, coin sign with arrow up and down. Decrease price vectors Price, rate, profit increase and decrease icon
Free with trial A bold red downward arrow symbolizes a decline in price or value, positioned between two black oil barrels, representing the oil industry and market trends. Perfect for financial, energy, or business graphics. Decrease price illustrations Oil barrel price drop or decrease illustration. A bold red downward arrow symbolizes a decline in price or value, positioned between two black oil barrels, representing the oil industry and market trends. Perfect for financial, energy, or business graphics
Free with trial This graphic features a bold red downward-pointing arrow, signifying a decrease or reduction. Adjacent to the arrow is a prominent red percentage symbol, reinforcing the theme of discounts or sales. Below these elements, the word 'REDUZIERT' (German for 'reduced') is displayed with a strikethrough, indicating a change from an original price or value. The composition is clean and simple, set. Decrease price vectors A red down arrow and percentage symbol illustrate a price reduction concept. This graphic features a bold red downward-pointing arrow, signifying a decrease or. This graphic features a bold red downward-pointing arrow, signifying a decrease or reduction. Adjacent to the arrow is a prominent red percentage symbol, reinforcing the theme of discounts or sales. Below these elements, the word 'REDUZIERT' (German for 'reduced') is displayed with a strikethrough, indicating a change from an original price or value. The composition is clean and simple, set
Free with trial Image is a digital graphic featuring a person in a dark suit, blurred in the background, with a focus on their hand pointing forward. The background is dark, creating a contrast with the bright text in the foreground. The word 'PRICE' is prominently displayed in bold, white, uppercase letters. Next to the text is a red downward arrow enclosed in a square bracket, symbolizing a decrease. The. Decrease price illustrations Price reduction concept with focused hand gesture. Image is a digital graphic featuring a person in a dark suit, blurred in the background, with a focus on their hand pointing forward. The background is dark, creating a contrast with the bright text in the foreground. The word 'PRICE' is prominently displayed in bold, white, uppercase letters. Next to the text is a red downward arrow enclosed in a square bracket, symbolizing a decrease. The
Free with trial Housing price falling down, Businessman investor and homeowner experiencing a decrease in the housing market. Decrease price vectors Housing price falling down, Businessman investor and homeowner experiencing a decrease in the housing market
Free with trial A set of black industrial oil barrels with a bold red downward arrow, indicating a price decrease or decline in oil costs. Perfect for financial, business, and economic stock imagery. Decrease price illustrations Oil barrels with downward price arrow symbolizing drop. A set of black industrial oil barrels with a bold red downward arrow, indicating a price decrease or decline in oil costs. Perfect for financial, business, and economic stock imagery
Free with trial This image depicts a candlestick chart used in financial markets to represent price movements of a security, asset, or currency. The chart shows a series of red and green bars, each representing a specific time period, with the green bars indicating a price increase and the red bars indicating a price decrease. Decrease price illustrations Candlestick chart showing price movements with red and green bars. This image depicts a candlestick chart used in financial markets to represent price movements of a security, asset, or currency. The chart shows a series of red and green bars, each representing a specific time period, with the green bars indicating a price increase and the red bars indicating a price decrease
Free with trial The image features a bold, green downward arrow with a white percentage symbol in the center, set against a stark white background. The arrow is slightly tilted to the right, adding a dynamic touch to the overall design. This icon is commonly used to represent a decrease in value, price, or quantity. Decrease price illustrations A vibrant green downward arrow with a percentage symbol indicating a decrease. The image features a bold, green downward arrow with a white percentage symbol in the center, set against a stark white background. The arrow is slightly tilted to the right, adding a dynamic touch to the overall design. This icon is commonly used to represent a decrease in value, price, or quantity
Free with trial A vibrant 3D rendered blue arrow points downwards, signifying a decrease or decline. Attached to the arrow is a pink circular emblem featuring a white percentage sign. This graphic is isolated on a white background, making it suitable for representing concepts like price drops, sales, economic downturns, or negative trends. Decrease price illustrations 3D Blue Downward Arrow with a Pink Percentage Sign Emblem decrease decline. A vibrant 3D rendered blue arrow points downwards, signifying a decrease or decline. Attached to the arrow is a pink circular emblem featuring a white percentage sign. This graphic is isolated on a white background, making it suitable for representing concepts like price drops, sales, economic downturns, or negative trends
Free with trial The image shows a stack of three shiny golden coins placed on a black rectangular platform. Behind the coins, there is a downward-pointing arrow, indicating a decline or drop, often used to symbolize a decrease in price or value in financial contexts. The overall composition suggests themes related to economics, finance, or market trends. Decrease price illustrations Stacked golden coins with a downward price trend arrow on a black platform. The image shows a stack of three shiny golden coins placed on a black rectangular platform. Behind the coins, there is a downward-pointing arrow, indicating a decline or drop, often used to symbolize a decrease in price or value in financial contexts. The overall composition suggests themes related to economics, finance, or market trends
Free with trial The image shows a tag with a percentage symbol inside it, attached to a ring at the top, and an arrow pointing downward indicating a decrease in price or a sale discount. Decrease price illustrations Image depicting a price reduction or discount sale with a percentage sign tag. The image shows a tag with a percentage symbol inside it, attached to a ring at the top, and an arrow pointing downward indicating a decrease in price or a sale discount
Free with trial The image shows a stack of gold-colored coins with a prominent Bitcoin logo on one coin. A large purple arrow points downward, symbolizing a decline or drop in value or price, likely representing a decrease in cryptocurrency value. Decrease price illustrations Bitcoin coins stacked with a downward price trend arrow indicating decline. The image shows a stack of gold-colored coins with a prominent Bitcoin logo on one coin. A large purple arrow points downward, symbolizing a decline or drop in value or price, likely representing a decrease in cryptocurrency value
Free with trial This image shows a candlestick chart, which is a type of financial chart used to describe price movements of securities, derivatives, or currencies. Each candlestick typically shows one day's worth of price data, with green bars indicating an increase in price and red bars indicating a decrease. The chart provides a visual representation of the opening, closing, high, and low prices for each. Decrease price illustrations A candlestick chart displaying stock market price movements over time with green and red bars. This image shows a candlestick chart, which is a type of financial chart used to describe price movements of securities, derivatives, or currencies. Each candlestick typically shows one day's worth of price data, with green bars indicating an increase in price and red bars indicating a decrease. The chart provides a visual representation of the opening, closing, high, and low prices for each
Free with trial Where the price will go up or down. Increase or decrease of the indicator. Market uncertainty and price speculation trends. Forecasting challenges and investor sentiment shifts. Decrease price illustrations Where the price will go up or down. Increase or decrease of the indicator. Market uncertainty and price speculation trends
Free with trial Where the price will go up or down. Increase or decrease of the indicator. Market uncertainty and price speculation trends. Forecasting challenges and investor sentiment shifts. Decrease price illustrations Where the price will go up or down. Increase or decrease of the indicator. Market uncertainty and price speculation trends
Free with trial Where the price will go up or down. Increase or decrease of the indicator. Market uncertainty and price speculation trends. Forecasting challenges and investor sentiment shifts. Decrease price illustrations Where the price will go up or down. Increase or decrease of the indicator. Market uncertainty and price speculation trends
Free with trial Where the price will go up or down. Increase or decrease of the indicator. Market uncertainty and price speculation trends. Forecasting challenges and investor sentiment shifts. Decrease price illustrations Where the price will go up or down. Increase or decrease of the indicator. Market uncertainty and price speculation trends
Free with trial The image illustrates the concept of deflation, showing a downward trend in the overall price level of goods and services in the economy , vintage charm. Decrease price illustrations Economic downturn. Deflation is a decrease in the general price level in an economy. The image illustrates the concept of deflation, showing a downward trend in the overall price level of goods and services in the economy , vintage charm
Free with trial A vibrant illustration of a coin with a downward arrow, symbolizing financial loss or price reduction, set against a green background, conveying a clear message. Decrease price vectors Illustration of a coin with a downward arrow, indicating a decrease in value, , symbolizing financial loss or price reduction. A vibrant illustration of a coin with a downward arrow, symbolizing financial loss or price reduction, set against a green background, conveying a clear message
Free with trial The concept of a decrease or increase in the bitcoin price after halving. Decrease price vectors Bitcoin price after Halving event. Vector illustration. The concept of a decrease or increase in the bitcoin price after halving.
Free with trial Set Prison cell door, Dollar rate decrease, Calculation of expenses and Drop in crude oil price on seamless pattern. Vector. Decrease price illustrations Set Prison cell door, Dollar rate decrease, Calculation of expenses and Drop in crude oil price on seamless pattern
Free with trial Crude oil price decraese icon Vector symbol or sign set collection in black and white outline. Decrease price vectors Crude oil price decrease flat line icon set. Crude oil price decrease Thin line illustration vector. crude oil price decraese icon Vector symbol or sign set collection in black and white outline
Free with trial Red percent decrease arrow and green percent increase arrow. Interest rates inflation economy concept. Up and down arrows for financial market change. Price decrease increase symbol. Decrease price illustrations Red percent decrease arrow and green percent increase arrow represent interest rates inflation economy. Red percent decrease arrow and green percent increase arrow. Interest rates inflation economy concept. Up and down arrows for financial market change. Price decrease increase symbol
Free with trial Set Drop in crude oil price, Dollar rate decrease, Storm and Shutdown of factory icon. Vector. Decrease price illustrations Set Drop in crude oil price, Dollar rate decrease, Storm and Shutdown of factory icon. Vector
Free with trial Set Global economic crisis Dollar rate decrease Drop in crude oil price Tearing money banknote Employee dismissal Mobile stock trading and Falling property prices icon. Vector. Decrease price vectors Set Global economic crisis, Dollar rate decrease, Drop in crude oil price, Tearing money banknote, Employee dismissal. Set Global economic crisis Dollar rate decrease Drop in crude oil price Tearing money banknote Employee dismissal Mobile stock trading and Falling property prices icon. Vector.
Free with trial Set Dollar rate decrease, Drop in crude oil price, Gold bars and Hanging sign with Sale on seamless pattern. Vector. Decrease price vectors Set Dollar rate decrease, Drop in crude oil price, Gold bars and Hanging sign with Sale on seamless pattern. Vector
Free with trial A graphic icon shows a stylized gold bar with two sparkle symbols on either side, suggesting value or shine. Above, a speech bubble contains a downward-facing arrow and a dollar sign, indicating a decrease or decline in value or price. The design uses a simple black and white color scheme, conveying information clearly and directly. Decrease price vectors Gold Price Down. A graphic icon shows a stylized gold bar with two sparkle symbols on either side, suggesting value or shine. Above, a speech bubble contains a downward-facing arrow and a dollar sign, indicating a decrease or decline in value or price. The design uses a simple black and white color scheme, conveying information clearly and directly.
Free with trial Bear or bearish market trend in crypto currency or stocks. Trade exchange background, down arrow graph for decrease in rates. Cryptocurrency price chart, blockchain technology. Global economy crash. , AI. Decrease price illustrations Bear or bearish market trend in crypto currency or stocks. Trade exchange background, down arrow graph for decrease in rates.
Free with trial Bear or bearish market trend in crypto currency or stocks. Trade exchange background, down arrow graph for decrease in rates. Cryptocurrency price chart, blockchain technology. Global economy crash. , AI. Decrease price illustrations Bear or bearish market trend in crypto currency or stocks. Trade exchange background, down arrow graph for decrease in rates.
Free with trial Bear or bearish market trend in crypto currency or stocks. Trade exchange background, down arrow graph for decrease in rates. Cryptocurrency price chart, blockchain technology. Global economy crash. , AI. Decrease price illustrations Bear or bearish market trend in crypto currency or stocks. Trade exchange background, down arrow graph for decrease in rates.
Free with trial Bear or bearish market trend in crypto currency or stocks. Trade exchange background, down arrow graph for decrease in rates. Cryptocurrency price chart, blockchain technology. Global economy crash. , AI. Decrease price illustrations Bear or bearish market trend in crypto currency or stocks. Trade exchange background, down arrow graph for decrease in rates.
Free with trial Bear or bearish market trend in crypto currency or stocks. Trade exchange background, down arrow graph for decrease in rates. Cryptocurrency price chart, blockchain technology. Global economy crash. , AI. Decrease price illustrations Bear or bearish market trend in crypto currency or stocks. Trade exchange background, down arrow graph for decrease in rates.
Free with trial Bear or bearish market trend in crypto currency or stocks. Trade exchange background, down arrow graph for decrease in rates. Cryptocurrency price chart, blockchain technology. Global economy crash. , AI. Decrease price illustrations Bear or bearish market trend in crypto currency or stocks. Trade exchange background, down arrow graph for decrease in rates.
Free with trial Bear or bearish market trend in crypto currency or stocks. Trade exchange background, down arrow graph for decrease in rates. Cryptocurrency price chart, blockchain technology. Global economy crash. , AI. Decrease price illustrations Bear or bearish market trend in crypto currency or stocks. Trade exchange background, down arrow graph for decrease in rates.
Free with trial Bear or bearish market trend in crypto currency or stocks. Trade exchange background, down arrow graph for decrease in rates. Cryptocurrency price chart, blockchain technology. Global economy crash. , AI. Decrease price illustrations Bear or bearish market trend in crypto currency or stocks. Trade exchange background, down arrow graph for decrease in rates.
Free with trial Bear or bearish market trend in crypto currency or stocks. Trade exchange background, down arrow graph for decrease in rates. Cryptocurrency price chart, blockchain technology. Global economy crash. , AI. Decrease price illustrations Bear or bearish market trend in crypto currency or stocks. Trade exchange background, down arrow graph for decrease in rates.
Free with trial Candlestick chart showing a series of red and green bars representing price fluctuations over time. Each rectangular bar displays financial data, with green indicating an increase and red indicating a decrease. Thin vertical lines extend above and below the bars, illustrating price range. Numerical values such as 20. 800 and 213. 500 label specific points on the chart, judging stock or currency performance. Horizontal lines suggest moving averages, highlighting trends in the data. Decrease price illustrations Candlestick chart showing a series of red and green bars representing price
Free with trial 3D price and discount icons with down arrow and percent sign. Modern vector design symbolizing sale, offer, and financial decrease for business, economy, or Black Friday promotion. Decrease price vectors 3D price and discount icons with down arrow and percent sign. Modern vector design symbolizing sale, offer, and
Free with trial 3D low price icons with red up and down arrows showing rate drop and market decline. Abstract financial vector about price decrease, percent change, and economic fall in modern business design. Decrease price vectors 3D low price icons with red up and down arrows showing rate drop and market decline. Abstract financial vector about
Free with trial Five oil barrels of varying sizes are arranged in a declining order. A bold orange arrow points downward, symbolizing a decrease in oil prices, illustrating market dynamics. Decrease price illustrations Art collage, Oil barrel sizes decrease, reflecting energy market trends and price fluctuations. Five oil barrels of varying sizes are arranged in a declining order. A bold orange arrow points downward, symbolizing a decrease in oil prices, illustrating market dynamics
Free with trial Increase and decrease, optimization of price, competition thin black and red outline symbols vector illustration Price and discount, cost reduction, profit growth financial strategy line icon set. Decrease price vectors Price and discount, cost reduction, profit growth financial strategy line icon set
Free with trial A 3D rendered blue arrow is pointing downwards, indicating a decrease or decline. Attached to the curve of the arrow is a pink circular badge with a white percentage symbol (%) in the center. The icon is set against a clean white background, suggesting a concept related to price reduction, sales, or negative financial trends. Decrease price illustrations Blue Downward Arrow with Pink Percentage Sign Icon on White Background decrease decline. A 3D rendered blue arrow is pointing downwards, indicating a decrease or decline. Attached to the curve of the arrow is a pink circular badge with a white percentage symbol (%) in the center. The icon is set against a clean white background, suggesting a concept related to price reduction, sales, or negative financial trends
Free with trial A 3D rendered blue arrow points downwards, symbolizing a decrease or reduction. Adjacent to the arrow is a pink circular icon containing a white percentage symbol. The composition is set against a clean white background, suggesting a concept related to sales, discounts, price drops, or negative financial trends. Decrease price illustrations Downward Arrow with Percentage Symbol on White Background decrease reduction. A 3D rendered blue arrow points downwards, symbolizing a decrease or reduction. Adjacent to the arrow is a pink circular icon containing a white percentage symbol. The composition is set against a clean white background, suggesting a concept related to sales, discounts, price drops, or negative financial trends
Free with trial Photo vertical collage picture person holding two arrows up down percentage balance profit increase decrease stress price. Decrease price illustrations Photo vertical collage picture person holding two arrows up down percentage balance profit increase decrease stress
Free with trial Reverse Inflation and fix the cost of living conceptual image, price tag with arrow going backward surrounded by labels with percentage of decrease. Decrease price illustrations Reverse Inflation and fix the cost of living concept, price tag with arrow going backward surrounded by labels with percentage of
Free with trial 3D Percentage commission icon. Decrease in interest rate, brokerage, low price, reduce cost, sale percent tax. Trendy and modern vector in 3d style. Decrease price vectors 3D Percentage commission icon. Decrease in interest rate, brokerage, low price, reduce cost, sale percent tax
Free with trial Coin with warning sign and arrow down. Money decrease, falling value, currency depreciation, price down, profit loss, warning of financial crisis, recession. 3d vector icon. Cartoon minimal style. Decrease price vectors Coin with warning sign and arrow down. Money decrease, falling value, currency depreciation, price down, profit loss, warning of
Free with trial Set Dollar rate decrease, Drop in crude oil price, Employee dismissal and Pie chart infographic. Business infographic template. Vector. Decrease price vectors Set Dollar rate decrease, Drop in crude oil price, Employee dismissal and Pie chart infographic. Business infographic
Free with trial Percentage decrease icon with downward arrow pointing into a download symbol. Price reduction or savings. Decrease price vectors Percentage decrease icon with downward arrow pointing into a download symbol. Price reduction or savings
Free with trial This vibrant illustration depicts a coin with a dollar sign and a downward arrow, symbolizing a decrease in value. It is perfect for financial or economic themes. Decrease price vectors Illustration of a coin with a dollar sign and a downward arrow, , symbolizing a decrease in value or a price reduction. This vibrant illustration depicts a coin with a dollar sign and a downward arrow, symbolizing a decrease in value. It is perfect for financial or economic themes
Free with trial Set line Dollar rate decrease Shutdown of factory Money bomb dollar crisis Drop in crude oil price Falling property prices Contract money and pen and Bank building icon. Vector. Decrease price illustrations Set line Dollar rate decrease, Shutdown of factory, Money bomb dollar crisis, Drop in crude oil price, Falling property. Set line Dollar rate decrease Shutdown of factory Money bomb dollar crisis Drop in crude oil price Falling property prices Contract money and pen and Bank building icon. Vector.
Free with trial Set line Drop in crude oil price, Dollar rate decrease, Debt ball chained to coin and Bank building icon. Vector. Decrease price illustrations Set line Drop in crude oil price, Dollar rate decrease, Debt ball chained to coin and Bank building icon. Vector
Free with trial Set Dollar rate decrease Drop in crude oil price Fire burning house Tearing money banknote Mobile stock trading Shutdown of factory Pie chart infographic and icon. Vector. Decrease price vectors Set Dollar rate decrease, Drop in crude oil price, Fire burning house, Tearing money banknote, Mobile stock trading. Set Dollar rate decrease Drop in crude oil price Fire burning house Tearing money banknote Mobile stock trading Shutdown of factory Pie chart infographic and icon. Vector.
Free with trial Set line Employee dismissal Global economic crisis Pie chart infographic Dollar rate decrease Safe Briefcase and Drop crude oil price icon. Vector. Decrease price vectors Set line Employee dismissal, Global economic crisis, Pie chart infographic, Dollar rate decrease, Safe, Briefcase and. Set line Employee dismissal Global economic crisis Pie chart infographic Dollar rate decrease Safe Briefcase and Drop crude oil price icon. Vector.
Free with trial Set Global economic crisis Drop in crude oil price Dollar rate decrease Employee dismissal Hanging sign with Sale and Gold bars icon. Vector. Decrease price illustrations Set Global economic crisis, Drop in crude oil price, Dollar rate decrease, Employee dismissal, Hanging sign with Sale. Set Global economic crisis Drop in crude oil price Dollar rate decrease Employee dismissal Hanging sign with Sale and Gold bars icon. Vector.
Free with trial Set Fire in burning house Broken piggy bank Pie chart infographic Contract money and pen Drop crude oil price Gold bars Dollar rate decrease and icon. Vector. Decrease price vectors Set Fire in burning house, Broken piggy bank, Pie chart infographic, Contract money and pen, Drop crude oil price, Gold. Set Fire in burning house Broken piggy bank Pie chart infographic Contract money and pen Drop crude oil price Gold bars Dollar rate decrease and icon. Vector.
Free with trial Set Isometric line Dollar rate decrease, Global economic crisis, Pie chart infographic and Drop crude oil price icon. Vector. Decrease price illustrations Set Isometric line Dollar rate decrease, Global economic crisis, Pie chart infographic and Drop crude oil price icon
Free with trial Set line Drop in crude oil price, Dollar rate decrease, Pie chart infographic and Prison cell door on seamless pattern. Vector. Decrease price vectors Set line Drop in crude oil price, Dollar rate decrease, Pie chart infographic and Prison cell door on seamless pattern
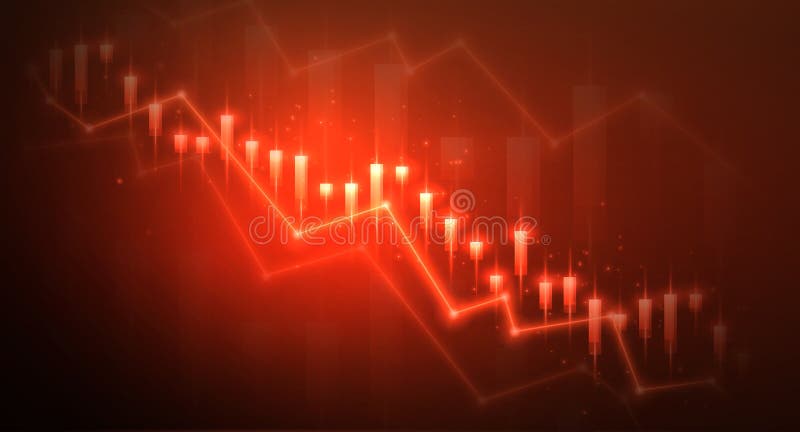
Free with trial Bear represents falling stock market on red chart background. Financial graph shows investment loss, price decrease. Bearish concept symbolizes economic recession, downturn global. Decrease price illustrations Bear represents falling stock market on red chart background. Financial graph shows investment loss, price decrease. Bearish
Free with trial Financial graph, Business concept, Price increase, Price decrease. Decrease price vectors Financial graph, Business concept, Price increase, Price decrease
Free with trial Set line Drop in crude oil price Stop delivery cargo truck and Dollar rate decrease icon. Vector. Decrease price vectors Set line Drop in crude oil price, Stop delivery cargo truck and Dollar rate decrease icon. Vector
Free with trial Stock and economic crisis graph background. Trade exchange, financial decrease, bed business strategy, digital asset, loss investment fund, online broker, stock collapse and crisis concept. Decrease price vectors Stock and economic crisis graph background. Trade exchange, financial decrease
Free with trial Gold bars with red downward financial graph. Concept of falling gold market price, economic crisis, and investment loss, vector illustration eps10. Decrease price vectors Gold bars with red downward financial graph. Concept of falling gold market price, economic crisis, and investment loss
Free with trial Gold bars with red downward financial graph and arrows. Concept of falling gold market price, economic crisis, and investment loss, vector illustration eps10. Decrease price vectors Gold bars with red downward financial graph and arrows. Concept of falling gold market price, economic crisis, and investment loss
Free with trial Crude oil barrels with red falling arrows and financial graphs representing oil price crash, energy crisis and economic downturn, vector illustration eps10. Decrease price vectors Crude oil barrels with red falling arrows and financial graphs representing oil price crash, energy crisis and economic downturn. Crude oil barrels with red falling arrows and financial graphs representing oil price crash, energy crisis and economic downturn, vector illustration eps10
Free with trial Stock and economic crisis graph background. Trade exchange, financial decrease, bed business strategy, digital asset, loss investment fund, online broker, stock collapse and crisis concept. Decrease price illustrations Stock and economic crisis graph background. Trade exchange, financial decrease
Free with trial Decrease financial business on white background. Isolated 3D illustration. Decrease price illustrations Decrease financial business on white background. Isolated 3D illustration
Free with trial Stock and economic crisis graph background. Trade exchange, financial decrease, bed business strategy, digital asset, loss investment fund, online broker, stock collapse and crisis concept. Decrease price illustrations Stock and economic crisis graph background. Trade exchange, financial decrease
Free with trial Broker trader analyzing economic crisis. Trade exchange, financial decrease, bed business strategy, digital asset, loss investment fund, online broker, stock collapse and crisis concept. Decrease price vectors Broker trader analyzing economic crisis. Trade exchange, financial decrease
Free with trial Stock market bull vs bear price trade volatility background vector. Decrease price vectors Stock market bull vs bear price trade volatility background
Free with trial Price Drop Icon. A flat illustration featuring a gold dollar coin with three red arrows pointing down. Decrease price vectors Price Drop Icon
Free with trial Line and Glyph Vector Icons. Chart, Down Arrow, and Price Tag. Deflation, Price Drop for a Product or Service. Price Concept. Decrease price vectors Price Drop Icons. Line and Glyph Vector Icons. Chart, Down Arrow, and Price Tag. Deflation, Price Drop for a Product or Service. Price Concept
Free with trial Bullish vs bearish stock market price indicator chart background vector. Decrease price vectors Bullish vs bearish stock market price indicator chart background
Free with trial Vector Icon. Chart, Down Arrow, and Price Tag. Deflation, Price Drop for a Product or Service. Price Concept. Decrease price vectors Colored Price Drop Icon. Vector Icon. Chart, Down Arrow, and Price Tag. Deflation, Price Drop for a Product or Service. Price Concept
Free with trial Oil Price Drop : Oil price drop represents a significant decrease in the market price of oil. Decrease price vectors Oil Price Drop
Free with trial Decrease : Decrease represents a reduction in value, profit, or financial performance over a specific period. Decrease price vectors Illustration of Decrease. Decrease : Decrease represents a reduction in value, profit, or financial performance over a specific period.