Free with trial Red minus forty percent discount sale offer for promotion and price reduction. Clearance deal for discount. Sale offer for price reduction. Promotion for discount. Discount for clearance. Decrease price vectors Red Minus Forty Percent Discount Sale Offer Promotion Price Reduction Clearance Deal. Red minus forty percent discount sale offer for promotion and price reduction. Clearance deal for discount. Sale offer for price reduction. Promotion for discount. Discount for clearance
Free with trial Graphic downward arrow sign with 'PRICE' pointing to a red line, perfect for sales promotions, discounts, Black Friday, Cyber Monday deals, business offers, financial ads, and pricing strategies, this image is generated using AI. Decrease price vectors Graphic downward arrow sign with \'PRICE\' pointing to a red line, perfect for sales promotions, discounts, Black Friday, Cyber. Graphic downward arrow sign with 'PRICE' pointing to a red line, perfect for sales promotions, discounts, Black Friday, Cyber Monday deals, business offers, financial ads, and pricing strategies, this image is generated using AI
Free with trial Inflation and recession conceptual image, price tags with arrow going up and text. Decrease price illustrations Price tags with arrow going up and text, Inflation and recession concept. Inflation and recession conceptual image, price tags with arrow going up and text
Free with trial A powerful conceptual visual showing a large white arrow crashing through a red wall and tiled floor beside the words Price Drop. Perfect for themes of economic shifts and retail promotions. Decrease price illustrations Large White Arrow Smashing Through a Red Wall with Price Drop Text Representing Market Change. A powerful conceptual visual showing a large white arrow crashing through a red wall and tiled floor beside the words Price Drop. Perfect for themes of economic shifts and retail promotions
Free with trial Decrease bar chart icon set on black circle. Market crash illustration concept. Decrease price vectors Decrease bar chart icon set on black circle. Market crash concept. Decrease bar chart icon set on black circle. Market crash illustration concept
Free with trial Percent growth and decline icon vector. Increase and decrease percentage arrow concept. Decrease price vectors Percent growth and decline icon. Increase and decrease percentage arrow concept
Free with trial Current market price and expected market price to calculate desired profit and target cost vector. Decrease price vectors Current market price and expected market price to calculate desired profit and target cost
Free with trial This conceptual financial illustration features bold blue text reading 'PRICE DROP' above a large downward arrow pointing to a pile of gold dollar coins on a cracked blue surface, symbolizing economic shifts or sales. Decrease price illustrations Financial Concept of Price Drop Featuring Gold Coins and Blue Downward Arrow on Cracked Surface. This conceptual financial illustration features bold blue text reading 'PRICE DROP' above a large downward arrow pointing to a pile of gold dollar coins on a cracked blue surface, symbolizing economic shifts or sales
Free with trial Set Dollar rate decrease, Credit card, Safe and icon. Vector. Decrease price illustrations Set Dollar rate decrease, Credit card, Safe and icon. Vector
Free with trial Abstract illustration of financial crisis, economic downturn. Falling red forex chart on grid. Concept of market crash, stock exchange rate decrease, bankrupt business falling price. Decrease price illustrations Abstract illustration of financial crisis, economic downturn. Falling red forex chart on grid. Concept of market crash, stock
Free with trial Red arrow pointing downwards declining market, financial downturn, investment loss, business crisis. Economic concepts decrease, failure, debt, bankruptcy, recession. Represents. Decrease price illustrations Red arrow pointing downwards, declining market, financial downturn, investment loss, business crisis. Economic concepts decrease. Red arrow pointing downwards declining market, financial downturn, investment loss, business crisis. Economic concepts decrease, failure, debt, bankruptcy, recession. Represents.
Free with trial Dollar arrow up and down outline icon on circle line. Increase and decrease USD sign symbol vector. Decrease price vectors Dollar arrow up and down outline icon on circle line. Increase and decrease USD sign symbol
Free with trial Yellow business trend line graph shows financial decline, revenue decrease with white arrow pointing downward, market fall concept. Decrease price illustrations Yellow business trend line graph shows financial decline, revenue decrease with white arrow pointing downward
Free with trial Discount graphic icon. Price is lowered sign isolated on white background. Reduction cost symbol. Vector illustration. Decrease price vectors Graphic symbol of price reduction. Discount graphic icon. Price is lowered sign isolated on white background. Reduction cost symbol. Vector illustration
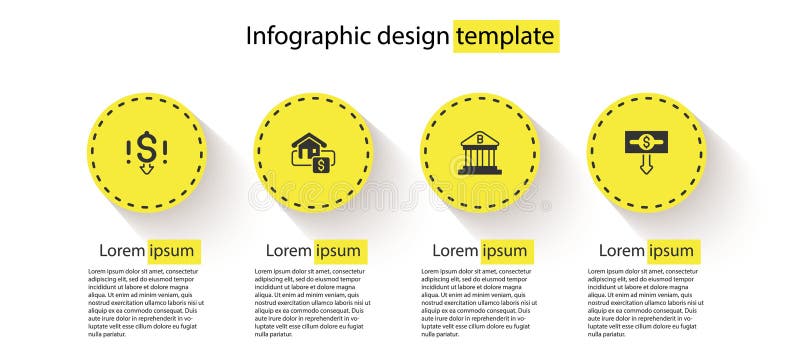
Free with trial Set Dollar rate decrease, Hanging sign with Sale, Bank building and. Business infographic template. Vector. Decrease price illustrations Set Dollar rate decrease, Hanging sign with Sale, Bank building and . Business infographic template. Vector
Free with trial Businessman miniature figure standing with percentage sign and coins stacking for considering of increase or decrease interest rating to get dividend and profit concept. Decrease price illustrations Businessman miniature figure standing with percentage sign and coins stacking for considering of increase or decrease interest
Free with trial A digital graphic depicting a financial chart with two prominent line graphs. A blue line trends upward, representing a rising stock price, while a red line trends downward, indicating a decrease in trading volume. The chart is set against a faint, blurred city background, featuring a grid system on the vertical axis labeled 'Volume' and a horizontal axis labeled 'Time', with a red arrow at the. Decrease price illustrations A financial line chart showing the inverse relationship between stock price and trading volume data. A digital graphic depicting a financial chart with two prominent line graphs. A blue line trends upward, representing a rising stock price, while a red line trends downward, indicating a decrease in trading volume. The chart is set against a faint, blurred city background, featuring a grid system on the vertical axis labeled 'Volume' and a horizontal axis labeled 'Time', with a red arrow at the
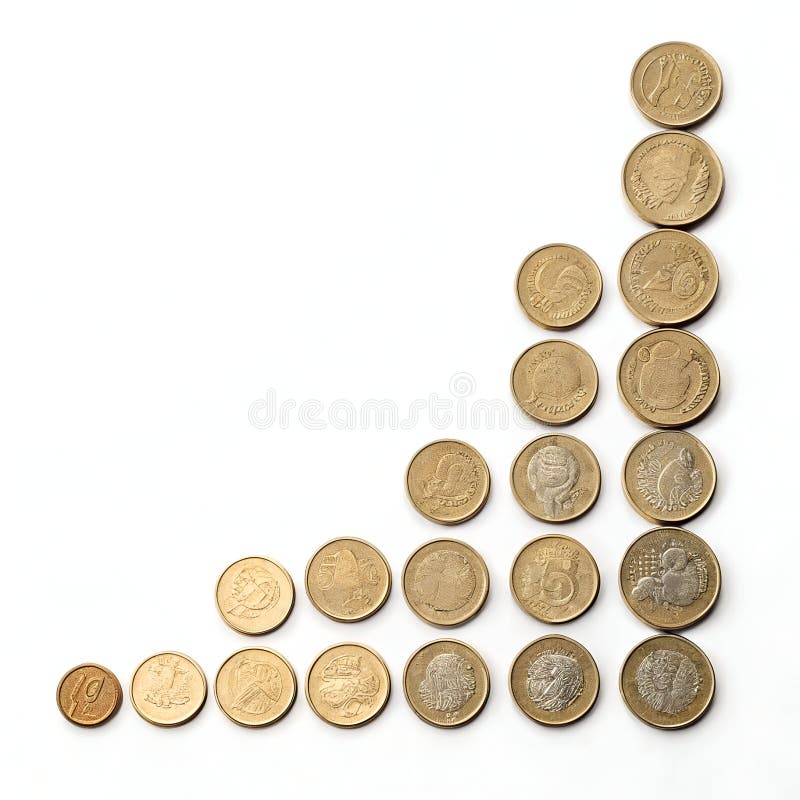
Free with trial Coins showing a decrease in value isolated on a white background, ideal for economic, financial, and market-related designs. Decrease price illustrations Coins Decrease Isolated on White Background. Coins showing a decrease in value isolated on a white background, ideal for economic, financial, and market-related designs.
Free with trial The image depicts a financial chart displaying price movements over time. It features candlestick bars in blue and yellow, indicating price changes, with a red line representing a moving average. The x-axis represents time, while the y-axis represents price. Decrease price illustrations A detailed financial chart showing price movements over time with candlestick bars and moving average line. The image depicts a financial chart displaying price movements over time. It features candlestick bars in blue and yellow, indicating price changes, with a red line representing a moving average. The x-axis represents time, while the y-axis represents price
Free with trial Oil price fluctuation crude fuel tax finance planning with gas icon over notebook anxiety and strategy focus. Generative AI. Decrease price illustrations Oil price fluctuation crude fuel tax finance planning with gas icon over notebook anxiety and strategy focus
Free with trial Abstract vector showing price decreasing and investment increasing, using blue lines and pink accents. Simple composition, balanced for illustrative purposes. Decrease price vectors Abstract visual illustrating price reduction, investment, and financial dynamics on a black background. Abstract vector showing price decreasing and investment increasing, using blue lines and pink accents. Simple composition, balanced for illustrative purposes.
Free with trial Bitcoin cryptocurrency price chart with green arrow down. Downward trend financial loss graph on exchange market. Digital virtual money crypto business finance. Decrease price illustrations Bitcoin cryptocurrency price chart with green arrow down. Downward trend financial loss graph on exchange market. Digital virtual
Free with trial Decrease vector icon on the white background. EPS 10. Decrease price vectors Decrease thin line vector icon set. Decrease vector icon on the white background. EPS 10
Free with trial Decrease vector icon on the white background. EPS 10. Decrease price vectors Decrease thin line vector icon set. Decrease vector icon on the white background. EPS 10
Free with trial Decrease vector icon on the white background. EPS 10. Decrease price vectors Decrease thin line vector icon set. Decrease vector icon on the white background. EPS 10
Free with trial Decrease vector icon on the white background. EPS 10. Decrease price vectors Decrease thin line vector icon set. Decrease vector icon on the white background. EPS 10
Free with trial Decrease vector icon on the white background. EPS 10. Decrease price vectors Decrease thin line vector icon set. Decrease vector icon on the white background. EPS 10
Free with trial Decrease vector icon on the white background. EPS 10. Decrease price vectors Decrease thin line vector icon set. Decrease vector icon on the white background. EPS 10
Free with trial Decrease vector icon on the white background. EPS 10. Decrease price vectors Decrease thin line vector icon set. Decrease vector icon on the white background. EPS 10
Free with trial Decrease vector icon on the white background. EPS 10. Decrease price vectors Decrease thin line vector icon set. Decrease vector icon on the white background. EPS 10
Free with trial Change in Market equilibrium when demand, supply and price changes vector. Decrease price vectors Change in Market equilibrium when demand, supply and price changes
Free with trial Set Global economic crisis, , Burning dollar bill and Drop crude oil price. Business infographic template. Vector. Decrease price illustrations Set Global economic crisis, , Burning dollar bill and Drop crude oil price. Business infographic template. Vector
Free with trial Frosted glass Dollar rate decrease icon isolated on blue background. Cost reduction. Money symbol with down arrow. Business lost crisis decrease. Square frosted glass button. 3D render illustration. Decrease price illustrations Frosted glass Dollar rate decrease icon isolated on blue background. Cost reduction. Money symbol with down arrow
Free with trial Frosted glass Dollar rate decrease icon isolated on blue background. Cost reduction. Money symbol with down arrow. Business lost crisis decrease. Square frosted glass button. 3D render illustration. Decrease price illustrations Frosted glass Dollar rate decrease icon isolated on blue background. Cost reduction. Money symbol with down arrow
Free with trial Set Isometric line Mobile stock trading, Global economic crisis, Drop crude oil price and Briefcase icon. Vector. Decrease price illustrations Set Isometric line Mobile stock trading, Global economic crisis, Drop crude oil price and Briefcase icon. Vector
Free with trial Oil barrels stand near falling stock chart. Crude oil price falls. Petroleum market plunges suffers losses. Energy industry faces financial crisis. Fossil fuels impact global economy. Decrease price illustrations Oil barrels stand near falling stock chart. Crude oil price falls. Petroleum market plunges, suffers losses. Energy industry. Oil barrels stand near falling stock chart. Crude oil price falls. Petroleum market plunges suffers losses. Energy industry faces financial crisis. Fossil fuels impact global economy.
Free with trial This isometric illustration showcases a blue platform with a purple price tag, embodying a modern and minimalist design aesthetic for various applications. Decrease price vectors Vector art of isometric illustration of a blue platform with a purple price tag, showcasing a modern and minimalist design. This isometric illustration showcases a blue platform with a purple price tag, embodying a modern and minimalist design aesthetic for various applications
Free with trial Percent growth and decline icon. Increase and decrease percentage arrow sign symbol vector. Decrease price vectors Percent growth and decline icon. Increase and decrease percentage arrow sign symbol
Free with trial The image portrays a downward graph representing deflation, symbolizing a period of economic decline and reduced consumer spending , timeless background beauty. Decrease price illustrations Economic Downturn. Deflation is a decrease in the general price level in an economy. The image portrays a downward graph representing deflation, symbolizing a period of economic decline and reduced consumer spending , timeless background beauty
Free with trial Percent growth and decline arrow icon vector. Increase and decrease percentage arrow sign symbol. Decrease price vectors Percent growth and decline arrow icon. Increase and decrease percentage arrow sign symbol
Free with trial Decrease vector icon on the white background. EPS 10. Decrease price vectors Decrease thin line vector icon set. Decrease vector icon on the white background. EPS 10
Free with trial Decrease vector icon on the white background. EPS 10. Decrease price vectors Decrease thin line vector icon set. Decrease vector icon on the white background. EPS 10
Free with trial Set Mobile stock trading, Dollar rate decrease, Briefcase and Falling property prices icon. Vector. Decrease price vectors Set Mobile stock trading, Dollar rate decrease, Briefcase and Falling property prices icon. Vector
Free with trial Up and down arrow icon on circle line. Increase and decrease sign symbol illustration. Decrease price vectors Up and down arrow icon on circle line. Increase and decrease sign symbol
Free with trial Powerful red arrow crashing through gray coins, symbolizing price drops, sales, discounts, and financial downturns. Ideal for Black Friday, Cyber Monday, clearance events, or economic news, this image is generated using AI. Decrease price vectors Powerful red arrow crashing through gray coins, symbolizing price drops, sales, discounts, and financial downturns. Ideal for
Free with trial A graphic illustration depicting the fluctuating value of digital currency, shown with a price performance chart and coins. this visual represents market ups and downs and financial trends. Decrease price vectors Stylized illustration showing digital currency market volatility and virtual coin price trends on financial growth chart. a graphic illustration depicting the fluctuating value of digital currency, shown with a price performance chart and coins. this visual represents market ups and downs and financial trends
Free with trial House in supermarket trolley and green arrow down. Falling housing prices concept. Unprofitability of investments and price fall in the real estate market. Lowering demand, construction rates and tren. Decrease price illustrations House in supermarket trolley and green arrow down. Falling housing prices concept. Unprofitability of investments and price fall
Free with trial House in supermarket trolley and green arrow down. Falling housing prices concept. Unprofitability of investments and price fall in the real estate market. Lowering demand, construction rates and tren. Decrease price illustrations House in supermarket trolley and green arrow down. Falling housing prices concept. Unprofitability of investments and price fall
Free with trial House in supermarket trolley and green arrow down. Falling housing prices concept. Unprofitability of investments and price fall in the real estate market. Lowering demand, construction rates and tren. Decrease price illustrations House in supermarket trolley and green arrow down. Falling housing prices concept. Unprofitability of investments and price fall
Free with trial House in supermarket trolley and green arrow down. Falling housing prices concept. Unprofitability of investments and price fall in the real estate market. Lowering demand, construction rates and tren. Decrease price illustrations House in supermarket trolley and green arrow down. Falling housing prices concept. Unprofitability of investments and price fall
Free with trial A close-up view of a financial candlestick chart displaying an overall upward trend. The chart features numerous blue and white candlesticks, which represent price movements over specific periods. Blue candlesticks typically indicate a price increase, while white ones suggest a decrease. Overlaying the candlesticks are two smooth lines, one green and one light blue, which are likely moving. Decrease price illustrations Uptrending candlestick chart illustrating financial market growth and stock trading analysis isolated on white background. A close-up view of a financial candlestick chart displaying an overall upward trend. The chart features numerous blue and white candlesticks, which represent price movements over specific periods. Blue candlesticks typically indicate a price increase, while white ones suggest a decrease. Overlaying the candlesticks are two smooth lines, one green and one light blue, which are likely moving
Free with trial Dynamic red downward arrow crashing through gray coins, symbolizing price drops, sales, and financial decline. Ideal for Black Friday promotions, market analysis, discount ads, or economic reports, this image is generated using AI. Decrease price vectors Dynamic red downward arrow crashing through gray coins, symbolizing price drops, sales, and financial decline. Ideal for Black
Free with trial A real estate market drop red arrow housing downturn wooden house property price decline concept mortgage crisis symbol investment risk negative, Generative AI. Decrease price illustrations Real estate market drop red arrow housing downturn wooden house property price decline concept mortgage crisis symbol investment. A real estate market drop red. A real estate market drop red arrow housing downturn wooden house property price decline concept mortgage crisis symbol investment risk negative, Generative AI
Free with trial Discount price tag graphic: gray 'before', red 'after', linked by arrow. Perfect for e-commerce sales, Black Friday, Cyber Monday, holiday deals, promotions, and advertising, this image is generated using AI. Decrease price vectors Discount price tag graphic: gray \'before\', red \'after\', linked by arrow. Perfect for e-commerce sales, Black Friday, Cyber Mon. Discount price tag graphic: gray 'before', red 'after', linked by arrow. Perfect for e-commerce sales, Black Friday, Cyber Monday, holiday deals, promotions, and advertising, this image is generated using AI
Free with trial Discount percentage arrow icon representing price reductions, financial market decline, interest rate drops, economic recession, and sales promotions, isolated on white & transparent background, this image is generated using AI. Decrease price vectors Discount percentage arrow icon representing price reductions, financial market decline, interest rate drops, economic recession
Free with trial Red glossy 3D arrow with percentage symbol pointing down, representing price drops, sales, discount offers, interest rate cuts, or economic recession. Ideal for financial news, marketing campaigns, this image is generated using AI. Decrease price vectors Red glossy 3D arrow with percentage symbol pointing down, representing price drops, sales, discount offers, interest rate cuts, or
Free with trial Lower price. Text effect design with modern colors and 3D font look. Decrease price vectors Lower price. Text effect with modern colors and 3D font look
Free with trial Lower price. Text effect design with modern colors and 3D font look. Decrease price vectors Lower price. Text effect with modern colors and 3D font look
Free with trial Lower price. Text effect design with modern colors and 3D font look. Decrease price vectors Lower price. Text effect with modern colors and 3D font look
Free with trial Set Broken piggy bank, Dollar rate decrease, and Global economic crisis icon. Vector. Decrease price illustrations Set Broken piggy bank, Dollar rate decrease, and Global economic crisis icon. Vector
Free with trial Lower price. Text effect design with modern colors and 3D font look. Decrease price illustrations Lower price. Text effect with modern colors and 3D font look
Free with trial Elevate your financial presentations and data visualizations with these captivating vintage-style arrow graphics. Perfect for illustrating price fluctuations, interest rate movements, and market trends, these retro-inspired up and down arrow designs are a visually engaging way to convey complex information. The sepia tone and textured background add a touch of vintage charm, bringing a classic. Decrease price illustrations Vintage-Inspired Arrow Graphics for Illustrating Price & Interest Rate Trends: A Retro Style Design Element. Elevate your financial presentations and data visualizations with these captivating vintage-style arrow graphics. Perfect for illustrating price fluctuations, interest rate movements, and market trends, these retro-inspired up and down arrow designs are a visually engaging way to convey complex information. The sepia tone and textured background add a touch of vintage charm, bringing a classic
Free with trial Set Storm, Pie chart infographic, Debt ball chained coin and Dollar rate decrease. Business infographic template. Vector. Decrease price vectors Set Storm, Pie chart infographic, Debt ball chained coin and Dollar rate decrease. Business infographic template. Vector
Free with trial Price range slider with gradient showing increasing dollar amounts from fifteen to one hundred and fifty dollars. Decrease price vectors Horizontal price range slider is adjusting values from fifteen to one hundred fifty dollars for ecommerce. Price range slider with gradient showing increasing dollar amounts from fifteen to one hundred and fifty dollars
Free with trial Simple percent decline or low cost price icon. concept of debt sign or recession. simple style trend modern business or gdp logotype graphic art design web element isolated on white background. Decrease price vectors Simple percent decline or low cost price icon
Free with trial High and Low Percent Arrow Icon Set. Increase Decrease and Price Vector symbol in a black filled and outlined style. Market Fluctuation Sign. Decrease price vectors High and Low Percent arrow icon
Free with trial Percent down line icon. Interest rate decrease or a percentage down icon. Arrow down. Finance and money. Interest rate. Banking and credit. Investment concept. Vector illustration flat design. Decrease price vectors Percent down line icon. Interest rate decrease or a percentage down icon.
Free with trial Inflation and recession conceptual image, price tag with arrow going up. Decrease price illustrations Price tag with arrow going up, Inflation and recession concept. Inflation and recession conceptual image, price tag with arrow going up
Free with trial This abstract artwork illustrates financial market dynamics with intricate lines and colors, representing stock price movements and trading patterns artistically. Decrease price illustrations Abstract financial market analysis with intricate lines depicting stock price movements and trading patterns in shades of black. This abstract artwork illustrates financial market dynamics with intricate lines and colors, representing stock price movements and trading patterns artistically
Free with trial The concept of low price icons with percentages with up and down arrows. Vector illustration. Decrease price vectors The concept of low price icons with percentages with up and down arrows.
Free with trial Set Isometric Worker, Drop in crude oil price, Pie chart infographic and Global economic crisis news icon. Vector. Decrease price illustrations Set Isometric Worker, Drop in crude oil price, Pie chart infographic and Global economic crisis news icon. Vector
Free with trial Icon reduction arrow decrease render symbol finance. Decrease price illustrations Price low down icon concept. Interest low price 3d percent discount. icon reduction arrow decrease render symbol finance
Free with trial Icon reduction arrow decrease render symbol finance. Decrease price vectors Price low down icon concept. Interest low price 3d percent discount. icon reduction arrow decrease render symbol finance
Free with trial Icon reduction arrow decrease render symbol finance. Decrease price vectors Price low down icon concept. Interest low price 3d percent discount. icon reduction arrow decrease render symbol finance
Free with trial Icon reduction arrow decrease render symbol finance. Decrease price vectors Price low down icon concept. Interest low price 3d percent discount. icon reduction arrow decrease render symbol finance
Free with trial Cutting or lowering price concept. scissors cutting money bill in half. vector illustration in flat style. Decrease price illustrations Cutting or lowering price concept. scissors cutting money bill in half
Free with trial Inflation and recession conceptual image, price tag with arrow going up over shopping basket. Decrease price illustrations Price tag with arrow going up over shopping basket, Inflation and recession concept. Inflation and recession conceptual image, price tag with arrow going up over shopping basket
Free with trial Cost reduction. Cost increase icon. Price reduced, discount icon. Low total cost icon vector image. Vector illustration isolated on background. Decrease price vectors Cost reduction. Cost increase icon. Price reduced, discount icon. Low total cost icon vector image. Vector illustration isolated
Free with trial Cost reduction. Cost increase icon. Price reduced, discount icon. Low total cost icon vector image. Vector illustration isolated on background. Decrease price vectors Cost reduction. Cost increase icon. Price reduced, discount icon. Low total cost icon vector image. Vector illustration isolated
Free with trial Cost reduction. Cost increase icon. Price reduced, discount icon. Low total cost icon vector image. Vector illustration isolated on background. Decrease price vectors Cost reduction. Cost increase icon. Price reduced, discount icon. Low total cost icon vector image. Vector illustration isolated