Free with trial Stock crisis red market price arrow down chart fall / Stock exchange market analysis or forex charts graph - business and finance money forex crisis losing moving down economic inflation deflation. Decrease red trade graph illustrations Stock crisis red market price arrow down chart fall / Stock exchange market analysis or forex charts graph. Business and finance money forex crisis losing. Stock crisis red market price arrow down chart fall / Stock exchange market analysis or forex charts graph - business and finance money forex crisis losing moving down economic inflation deflation
Free with trial Rapid Percent decrease. Red percent sign with downward arrow. Decrease red trade graph illustrations Rapid Percent decrease. Red percent sign with downward arrow
Free with trial Crisis chart. Broken golden bar chart with red arrow dropped into the crack in white surface - crisis illustration. Decrease red trade graph illustrations Crisis chart. Broken golden bar chart with red arrow dropped into the crack in white surface - crisis illustration
Free with trial Money loss. Red down arrow stocks graph with cash pile. Financial crisis, investment expenses, economic depression. Vector bankruptcy business concept. Decrease red trade graph vectors Money loss. Red down arrow stocks graph with cash pile. Financial crisis, investment expenses, economic depression. Vector bankruptcy business concept
Free with trial Percent decrease. Red percent sign with downward arrow. Decrease red trade graph illustrations Percent decrease. Red percent sign with downward arrow
Free with trial India flag trade war tariffs war economic decline red downward graph financial crisis grid background stock market crash. Concept Vector illustration. Decrease red trade graph vectors India flag trade war tariffs war economic decline red downward graph financial crisis grid background stock market crash. Concept Vector illustration
Free with trial Stocks fall. Candle stick graph chart of stock market investment trading. Bullish point, down trend of graph. Futuristic red signal trend drop down arrow chart. Decrease red trade graph vectors Stocks fall. Candle stick graph chart of stock market investment trading. Bullish point, down trend of graph. Futuristic red. Stocks fall. Candle stick graph. Stocks fall. Candle stick graph chart of stock market investment trading. Bullish point, down trend of graph. Futuristic red signal trend drop down arrow chart
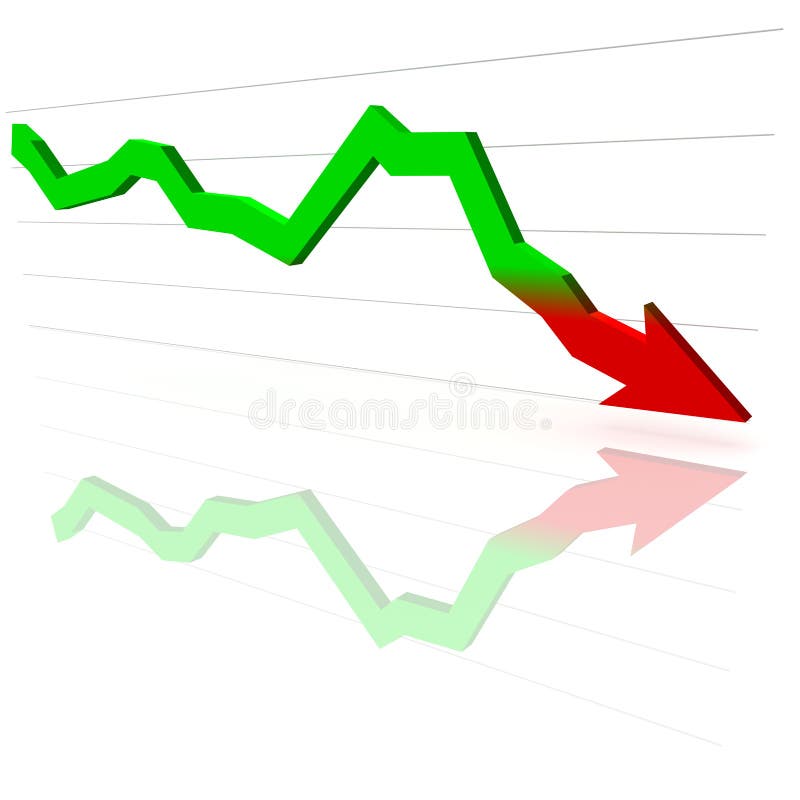
Free with trial Red Graph moving down on chart as recession or financial crisis. 3d render, illustration. Decrease red trade graph illustrations Red Graph moving down on chart as recession or financial crisis. 3d render, illustration
Free with trial Red Graph moving down on chart as recession or financial crisis. 3d render, illustration. Decrease red trade graph illustrations Red Graph moving down on chart as recession or financial crisis. 3d render, illustration
Free with trial Red Stock Market and Economic graph showing a down trend and recession concept, Generative ai. Decrease red trade graph illustrations Red Stock Market and Economic graph showing a down trend and recession concept. Generative ai
Free with trial Candle stick graph chart of stock market investment trading. Conceptual view of the foreign exchange market. Stock trade live. Background stock chart. Decrease red trade graph illustrations Candle stick graph chart of stock market investment trading. Conceptual view of the foreign exchange market. Stock trade live. Background stock chart
Free with trial Vector 3d red arrow going down stock icon. Bankruptcy, financial market crash icon. Graph chart downtrend symbol. chart going down sign. Realistic 3d Vector illustration isolated on white background. Decrease red trade graph vectors Vector 3d red arrow going down stock icon. Bankruptcy, financial market crash icon. Graph chart downtrend symbol. chart. Going down sign. Realistic 3d Vector. Vector 3d red arrow going down stock icon. Bankruptcy, financial market crash icon. Graph chart downtrend symbol. chart going down sign. Realistic 3d Vector illustration isolated on white background
Free with trial Graph going up and down arrow green and red icon. The rise and fall of business, shares, prices vector. Desing. Decrease red trade graph vectors Graph going up and down arrow green and red icon. The rise and fall of business, shares, prices vector. Desing
Free with trial A businessman holds banknotes, runs away from stack of money bar chart with red graph down. Withdraw capital in business recession, economic strategy, financial, market performance, loss management. Decrease red trade graph vectors A businessman holds banknotes, runs away from stack of money bar chart with red graph down. Withdraw capital in business recession. Economic strategy. A businessman holds banknotes, runs away from stack of money bar chart with red graph down. Withdraw capital in business recession, economic strategy, financial, market performance, loss management
Free with trial Red histogram. On white background, decrease concept. Decrease red trade graph vectors Red histogram. On white background, decrease concept
Free with trial Financial 3D graph showing decrease in profits. Decrease red trade graph illustrations Financial 3D graph. Showing decrease in profits
Free with trial Financial 3D graph showing decrease in profits. Decrease red trade graph illustrations Financial 3D graph. Showing decrease in profits
Free with trial Stock crisis red price drop down chart fall / Stock market exchange analysis or forex graph business and finance crash money losing moving economic investment loss. Decrease red trade graph illustrations Stock crisis red price drop down chart fall. / Stock market exchange analysis or forex graph business and finance crash money losing moving economic investment
Free with trial 3D Rendering of Red stock market graph dropping down dramatically Global Stock market chart panic sell concept. Extreme bearish stage. For stock, cryptocurrency, financial news background. Decrease red trade graph illustrations Red stock market graph dropping down dramatically Global Stock market chart panic sell concept. Extreme bearish stage. 3D Rendering of Red stock market graph. 3D Rendering of Red stock market graph dropping down dramatically Global Stock market chart panic sell concept. Extreme bearish stage. For stock, cryptocurrency, financial news background
Free with trial Decreasing oil barrels graph. Computer generated image. Decrease red trade graph illustrations Decreasing oil barrels graph. Computer generated image
Free with trial Profit decrease fall arrow and percent icon. Vector GDP profit loss arrow down. Symbol. Decrease red trade graph vectors Profit decrease fall arrow and percent icon. Vector GDP profit loss arrow down. Symbol
Free with trial Global economy shock. Composite image of global crisis economy - red toned grunge world map on a data graph and a decline curve with COVID-19 text. Decrease red trade graph illustrations Global economy shock. Composite image of global crisis economy - red toned grunge world map on a data graph and a decline curve with COVID-19 text
Free with trial Stock market forecast downfall vision to see future economic crisis or market crash concept panic businessman investor look through telescope to see stock market red downward bearish graph. Decrease red trade graph vectors Stock market forecast downfall vision to see future economic crisis or market crash concept panic businessman investor look. Through telescope to see stock. Stock market forecast downfall vision to see future economic crisis or market crash concept panic businessman investor look through telescope to see stock market red downward bearish graph
Free with trial Stock market quotes graph chart loss crisis. Decrease red trade graph illustrations Stock market quotes graph loss crisis. Stock market quotes graph chart loss crisis. Stock market quotes graph chart loss crisis.
Free with trial 3d red arrow crashing down with falling stock market bar charts, economic recession, financial crisis and market crash illustration. Generative AI. Decrease red trade graph illustrations 3d red arrow crashing down with falling stock market bar charts economic recession financial crisis and market crash. 3d red arrow crashing down with falling. 3d red arrow crashing down with falling stock market bar charts, economic recession, financial crisis and market crash illustration. Generative AI
Free with trial Oil price falling concept. With 3d rendering red graph, blue nozzle and black barrels. Decrease red trade graph illustrations Oil price falling concept. With 3d rendering red graph, blue nozzle and black barrels
Free with trial Flat 3d isometric falling red arrow piercing through oil barrel over businessman. Oil price crisis concept. Decrease red trade graph vectors Isometric falling red arrow piercing through oil barrel over businessman. Flat 3d isometric falling red arrow piercing through oil barrel over businessman. Oil. Flat 3d isometric falling red arrow piercing through oil barrel over businessman. Oil price crisis concept
Free with trial Red and green arrows Stock exchange market analysis / Stock crisis red price chart fall and green arrow up profits growth / Stock or forex business and finance money - economic inflation and deflation. Decrease red trade graph illustrations Red and green arrows Stock exchange market analysis / Stock crisis red price. Chart fall and green arrow up profits growth / Stock or forex business and finance. Red and green arrows Stock exchange market analysis / Stock crisis red price chart fall and green arrow up profits growth / Stock or forex business and finance money - economic inflation and deflation
Free with trial Economics recession, crashed stock market and trading loss vector graphs with indicators turned down, decline charts, red arrows. Blurred trading screen for finance crisis and business bankruptcy. Decrease red trade graph vectors Economics recession, crashed stock market graph. Economics recession, crashed stock market and trading loss vector graphs with indicators turned down, decline. Economics recession, crashed stock market and trading loss vector graphs with indicators turned down, decline charts, red arrows. Blurred trading screen for finance crisis and business bankruptcy
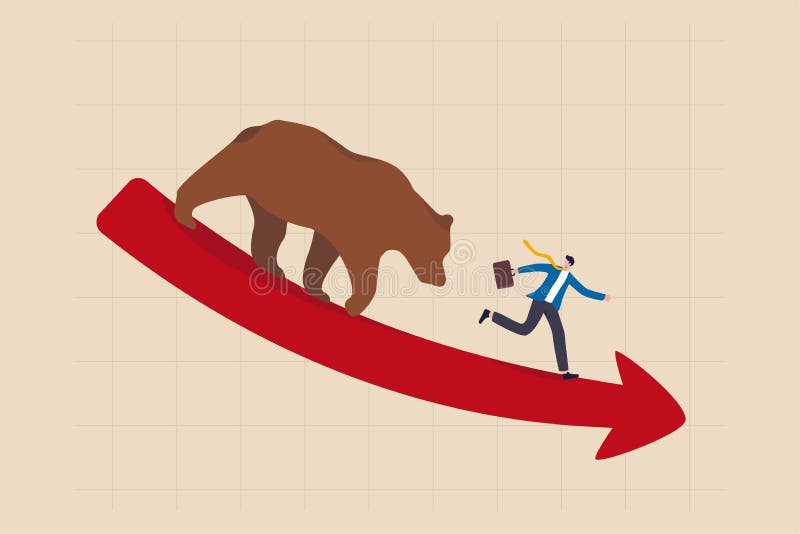
Free with trial Bear market, stock decline by economic crisis, recession or bubble burst, crypto currency price going down concept, businessman investor sell all stocks and run away from bear on red decline graph. Decrease red trade graph vectors Bear market, stock decline by economic crisis, recession or bubble burst, crypto currency price going down concept, businessman. Investor sell all stocks and. Bear market, stock decline by economic crisis, recession or bubble burst, crypto currency price going down concept, businessman investor sell all stocks and run away from bear on red decline graph
Free with trial Germany Stock Exchange market crisis red market price down chart fall / Stock analysis or forex charts graph Business and finance money crisis red negative drop in sales economic fall. Decrease red trade graph illustrations Germany Stock Exchange market crisis red market price down chart fall Business and finance money crisis red negative drop in sales. Germany Stock Exchange market. Germany Stock Exchange market crisis red market price down chart fall / Stock analysis or forex charts graph Business and finance money crisis red negative drop in sales economic fall
Free with trial UK. London Stock Exchange market crisis red market price down chart fall / Stock analysis or forex charts graph Business and finance money crisis background red negative drop in sales economic fall. Decrease red trade graph illustrations UK. London Stock Exchange market crisis red market price down chart fall Business and finance money crisis background red negative. UK. London Stock Exchange. UK. London Stock Exchange market crisis red market price down chart fall / Stock analysis or forex charts graph Business and finance money crisis background red negative drop in sales economic fall
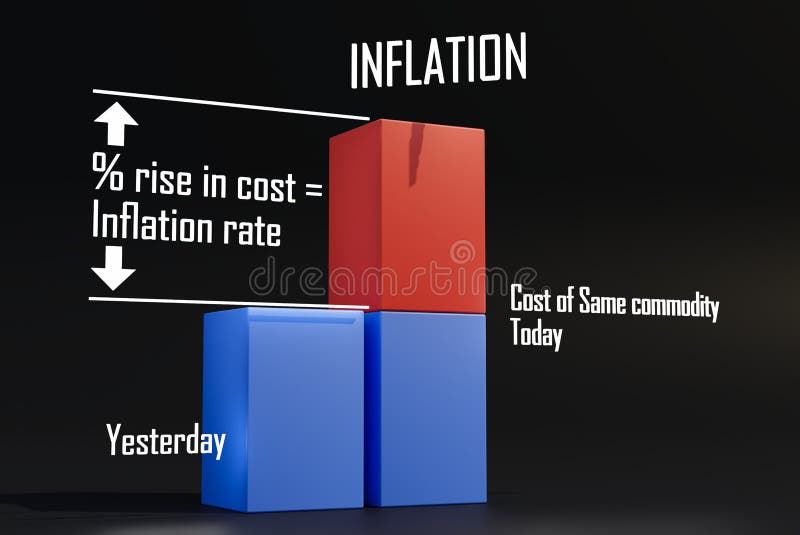
Free with trial 3D graph bar chart explains Inflation rate. 3D rendering illustration. Cost comparison chart. Decrease red trade graph illustrations 3D graph bar chart explains Inflation rate. 3D rendering illustration. Cost comparison chart
Free with trial Bear market and red arrow downward trend line. bearish market concept. Vector. Decrease red trade graph vectors Bear market and red arrow downward trend line. bearish market concept. Vector
Free with trial Business failure, company bankruptcy, stock market crash and loss trading vector graph. The concept of economic recession and crisis. Fall of world trade. Negative investment indicator down turn infographics. Decrease red trade graph vectors Business failure, company bankruptcy, stock market crash and loss trading graph. The concept of economic recession and. Business failure, company bankruptcy. Business failure, company bankruptcy, stock market crash and loss trading vector graph. The concept of economic recession and crisis. Fall of world trade. Negative investment indicator down turn infographics
Free with trial Falling red arrow with symbol of Turkish Lira, crisis concept. 3. D rendering on white background. Decrease red trade graph illustrations Falling red arrow with symbol of Turkish Lira, crisis concept. 3. D rendering on white background
Free with trial Economic critical crisis concept. A low polygon with a wireframe of the lower arrow and shiny on red world map background. Recession financial, cryptocurrency, gold, and the stock market. Losing money and cash. Decrease red trade graph vectors Economic critical crisis concept. A low polygon with a wireframe of the lower arrow and shiny on red world map background. Recession financial, cryptocurrency
Free with trial Business failure, company bankruptcy, stock market crash and loss trading vector graph. The concept of economic recession and crisis. Fall of world trade. Negative investment indicator down turn infographics. Decrease red trade graph vectors Business failure, company bankruptcy, stock market crash and loss trading graph. The concept of economic recession and crisis. Business failure, company. Business failure, company bankruptcy, stock market crash and loss trading vector graph. The concept of economic recession and crisis. Fall of world trade. Negative investment indicator down turn infographics
Free with trial Sweden Stock Exchange market crisis red market price down chart fall / Stock analysis or forex charts graph Business and finance money crisis red negative drop in sales economic fall. Decrease red trade graph illustrations Sweden Stock Exchange market crisis red market price down chart fall Business and finance money crisis red negative drop in sales. Sweden Stock Exchange market. Sweden Stock Exchange market crisis red market price down chart fall / Stock analysis or forex charts graph Business and finance money crisis red negative drop in sales economic fall
Free with trial Spain Stock Exchange market crisis red market price down chart fall / Stock analysis or forex charts graph Business and finance money crisis red negative drop in sales economic fall. Decrease red trade graph illustrations Spain Stock Exchange market crisis red market price down chart fall Business and finance money crisis red negative drop in sales. Spain Stock Exchange market. Spain Stock Exchange market crisis red market price down chart fall / Stock analysis or forex charts graph Business and finance money crisis red negative drop in sales economic fall
Free with trial Canada Stock Exchange market crisis red market price down chart fall / Stock analysis or forex charts graph Business and finance money crisis background red negative drop in sales economic fall. Decrease red trade graph illustrations Canada Stock Exchange market crisis red market price down chart fall Business and finance money crisis background red negative. Canada Stock Exchange market. Canada Stock Exchange market crisis red market price down chart fall / Stock analysis or forex charts graph Business and finance money crisis background red negative drop in sales economic fall
Free with trial Financial crisis. Illustration with bars and red arrow. Decrease red trade graph vectors Financial crisis. Illustration with bars and red arrow
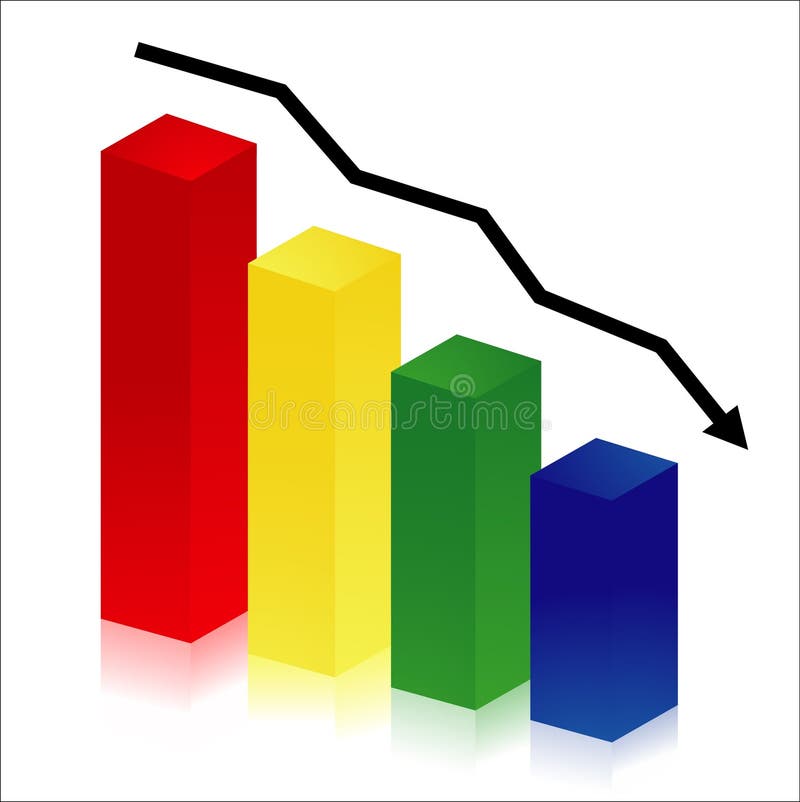
Free with trial Colorful histogram. On white background, decrease concept. Decrease red trade graph vectors Colorful histogram. On white background, decrease concept
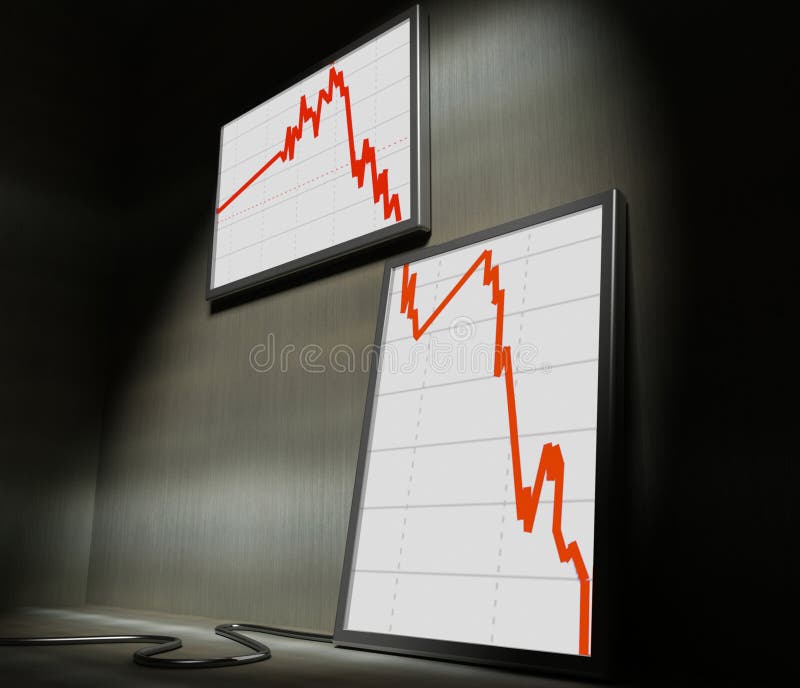
Free with trial Financial stat decrease. 3d image of lcd on wall showing decrease financial stat. Decrease red trade graph illustrations Financial stat decrease. 3d image of lcd on wall showing decrease financial stat
Free with trial Business graph. Showing decreasing profit for dollar. Decrease red trade graph illustrations Business graph. Showing decreasing profit for dollar
Free with trial HODL - word in bitcoin trading market. Data on red background chart. Virtual cryptocurrency concept. Decrease red trade graph illustrations HODL - word in bitcoin trading market. Data on red background chart. Virtual cryptocurrency concept
Free with trial Flat illustration of technical analysis with a magnifying glass on a yellow background. Stock market correction concept. Bankrupt financial information. Descending trading graph. Decrease red trade graph vectors Flat illustration of technical analysis with a magnifying glass on a yellow background. Stock market correction concept. Bankrupt. Financial information. Flat illustration of technical analysis with a magnifying glass on a yellow background. Stock market correction concept. Bankrupt financial information. Descending trading graph
Free with trial Recession concept. Falling market. The trading broker is horrified at the falling market. Financial graph down. Vector illustration flat design. Decrease red trade graph vectors Recession concept. Falling market. Vector illustration flat design. Recession concept. Falling market. The trading broker is horrified at the falling market. Recession concept. Falling market. The trading broker is horrified at the falling market. Financial graph down. Vector illustration flat design.
Free with trial Falling red arrow with symbol of bitcoin, crisis concept. 3D rendering. On white background. Decrease red trade graph illustrations Falling red arrow with symbol of bitcoin, crisis concept. 3D rendering. On white background
Free with trial Novel coronavirus COVID-19with text Wuhan coronavirus outbreak on correction market background. concept of the fall of the Chinese. Trade market and economy. Decrease red trade graph vectors Novel coronavirus COVID-19with text Wuhan coronavirus outbreak on correction market background. concept of the fall of the Chinese. Trade market and economy
Free with trial Flat illustration vector of The global economics Impact of COVID-19 novel coronavirus. The virus affects the global economy. Economy graph chart down and red arrow down. Flat characters work for protect economics. Decrease red trade graph illustrations Flat illustration vector of The global economics Impact of COVID-19 novel coronavirus . The virus affects the global economy. Economy graph chart down and red
Free with trial Concept profit red bar ladder blocks on spring spirals. 3d. Decrease red trade graph illustrations Concept profit red bar ladder blocks on spring spirals. 3d
Free with trial Red chart Graph showing bear market with green Stop Loss line. Cut losses. Isolated on white. 3D render. Clipping path included. Decrease red trade graph illustrations Stop-loss order chart illustration. Red chart Graph showing bear market with green Stop Loss line. Cut losses. Isolated on white. 3D render. Clipping path. Red chart Graph showing bear market with green Stop Loss line. Cut losses. Isolated on white. 3D render. Clipping path included.
Free with trial Crypto Currency market panic sell concept. Double exposure of digital coins price drop and technical chart. Both in red color theme to indicate bearish stage. Decrease red trade graph illustrations Crypto Currency market panic sell concept. Double exposure of digital coins price drop and technical chart. Both in red color theme to indicate bearish stage
Free with trial Glowing red hot bitcoin BTC with explosion particles and warp binary data background. 2d illustration for crypto currency panic sell price drop during bearish downtrend market exchange. Decrease red trade graph illustrations Glowing red hot bitcoin BTC with explosion particles and warp binary data background. 2d illustration for crypto currency panic sell price drop during bearish
Free with trial Glowing red hot ethereum ETH with explosion particles and warp binary data background. 2d illustration for crypto currency panic sell price drop during bearish downtrend market exchange. Decrease red trade graph illustrations Glowing red hot ethereum ETH with explosion particles and warp binary data background. 2d illustration for crypto currency panic sell price drop during bearish
Free with trial Decreasing red arrows showing the deterioration of the economy or the fall of stocks on the stock exchange in Russia. Decrease red trade graph illustrations Decreasing red arrows showing the deterioration of the economy in Russia. Decreasing red arrows showing the deterioration of the economy or the fall of stocks on. Decreasing red arrows showing the deterioration of the economy or the fall of stocks on the stock exchange in Russia.
Free with trial Oil barrels. With decreasing arrow. Decrease red trade graph illustrations Oil barrels. With decreasing arrow
Free with trial Falling financial indicators, business profits, investment fund, investments, reduction of monetary savings, budget planning, income fall concept. Illustration in paper cut art style. Decrease red trade graph vectors Falling financial indicators. Illustration in paper cut art style. Falling financial indicators, business profits, investment fund, investments, reduction of. Falling financial indicators, business profits, investment fund, investments, reduction of monetary savings, budget planning, income fall concept. Illustration in paper cut art style.
Free with trial Illustration of the market depression as a result of covid-19 a businessman is shouting at the coronavirus. Decrease red trade graph illustrations Market depression as a result of covid-19 a businessman is shouting at the coronavirus. Illustration of the market depression as a result of covid-19 a. Illustration of the market depression as a result of covid-19 a businessman is shouting at the coronavirus
Free with trial Illustration of the market depression as a result of covid-19 a businessman is shouting at the coronavirus. isolated. Decrease red trade graph illustrations Market depression as a result of covid-19 a businessman is shouting at the coronavirus. isolated. Illustration of the market depression as a result of covid-19 a. Illustration of the market depression as a result of covid-19 a businessman is shouting at the coronavirus. isolated
Free with trial Dollars failure 3d, problem of currency. Decrease red trade graph illustrations Dollars failure 3d. Problem of currency
Free with trial Financial and stock investment market concept. The bear market which price of securities are falling down. Decrease red trade graph vectors Financial and stock investment market concept. The bear market which price of securities are falling down
Free with trial Rising real estate price house arrows bar chart. business trade 3d render illustration. Decrease red trade graph illustrations Rising real estate price house arrows bar chart. Rising real estate price concept house arrows bar chart. business trade 3d render illustration
Free with trial The graph shows the fall and profits decline. Loss of points Currency. Falling through asset outflows. Red background. dollar symbol. minimal. Outline. Decrease red trade graph vectors Loss of points Currency. The graph shows the fall and profits decline. Loss of points Currency. Falling through asset outflows. Red background. dollar symbol. The graph shows the fall and profits decline. Loss of points Currency. Falling through asset outflows. Red background. dollar symbol. minimal. Outline.
Free with trial Stock market bear. Icon illustration graphic design. Decrease red trade graph illustrations Stock market bear. Icon illustration graphic design
Free with trial Impact of COVID-19 on the economy 3D rendering. Multiple viruses in a shopping cart - impact on the economy. Decrease red trade graph illustrations Impact of COVID-19 on the economy 3D rendering. Multiple viruses in a shopping cart - impact on the economy
Free with trial The concept of a fall in stocks due to the new coronavirus 2019-nCov. World financial crisis and business losses due to virus COVID-2019. Flat vector illustration. Decrease red trade graph vectors The concept of a fall in stocks due to the new coronavirus 2019-nCov. World financial crisis and business losses due to. Virus COVID-2019. Flat vector
Free with trial Stock and economic crisis graph background. Trade exchange, financial decrease, bed business strategy, digital asset, loss investment fund, online broker, stock collapse and crisis concept. Decrease red trade graph vectors Stock and economic crisis graph background. Trade exchange, financial decrease. Bed business strategy, digital asset, loss investment fund, online broker. Stock and economic crisis graph background. Trade exchange, financial decrease, bed business strategy, digital asset, loss investment fund, online broker, stock collapse and crisis concept.
Free with trial Stock and economic crisis graph background. Trade exchange, financial decrease, bed business strategy, digital asset, loss investment fund, online broker, stock collapse and crisis concept. Decrease red trade graph illustrations Stock and economic crisis graph background. Trade exchange, financial decrease. Bed business strategy, digital asset, loss investment fund, online broker. Stock and economic crisis graph background. Trade exchange, financial decrease, bed business strategy, digital asset, loss investment fund, online broker, stock collapse and crisis concept.
Free with trial Stock and economic crisis graph background. Trade exchange, financial decrease, bed business strategy, digital asset, loss investment fund, online broker, stock collapse and crisis concept. Decrease red trade graph illustrations Stock and economic crisis graph background. Trade exchange, financial decrease. Bed business strategy, digital asset, loss investment fund, online broker. Stock and economic crisis graph background. Trade exchange, financial decrease, bed business strategy, digital asset, loss investment fund, online broker, stock collapse and crisis concept.
Free with trial Stock and economic crisis graph background. Trade exchange, financial decrease, bed business strategy, digital asset, loss investment fund, online broker, stock collapse and crisis concept. Decrease red trade graph illustrations Stock and economic crisis graph background. Trade exchange, financial decrease. Bed business strategy, digital asset, loss investment fund, online broker. Stock and economic crisis graph background. Trade exchange, financial decrease, bed business strategy, digital asset, loss investment fund, online broker, stock collapse and crisis concept.
Free with trial European Union trade war tariffs war economic downturn red declining graph chart yellow EU stars blue grid background. Financial crisis Vector illustration. Decrease red trade graph illustrations European Union trade war tariffs war economic downturn red declining graph chart yellow EU stars blue grid background. Financial crisis Vector illustration
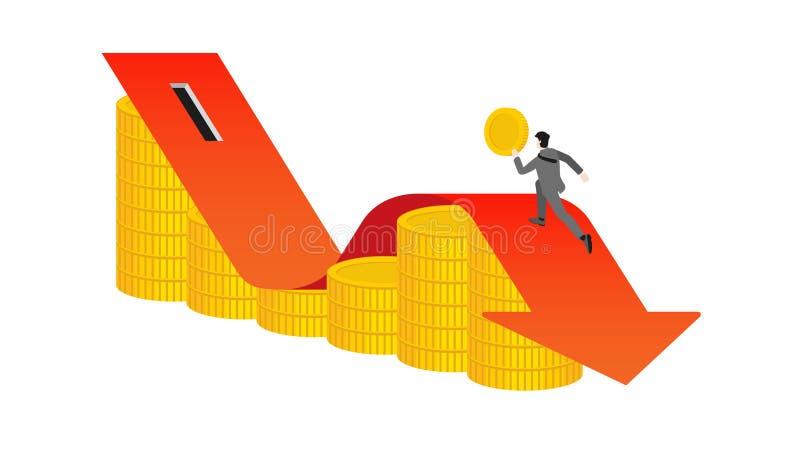
Free with trial Businessman runs and holds coins on a red arrow graph decrease on a stack of coins to coin slot. Business Down, wealth create, financial, investment goal, corporate develop, economic, profit and loss. Decrease red trade graph vectors Businessman runs and holds coins on a red arrow graph decrease on a stack of coins to coin slot. Business Down, wealth create,. Financial, investment goal. Businessman runs and holds coins on a red arrow graph decrease on a stack of coins to coin slot. Business Down, wealth create, financial, investment goal, corporate develop, economic, profit and loss
Free with trial Bear or bearish market trend in crypto currency or stocks. Trade exchange background, down arrow graph for decrease in rates. Cryptocurrency price chart, blockchain technology. Global economy crash. , AI. Decrease red trade graph illustrations Bear or bearish market trend in crypto currency or stocks. Trade exchange background, down arrow graph for decrease in rates. Cryptocurrency price chart
Free with trial Bear or bearish market trend in crypto currency or stocks. Trade exchange background, down arrow graph for decrease in rates. Cryptocurrency price chart, blockchain technology. Global economy crash. , AI. Decrease red trade graph illustrations Bear or bearish market trend in crypto currency or stocks. Trade exchange background, down arrow graph for decrease in rates. Cryptocurrency price chart
Free with trial Bear or bearish market trend in crypto currency or stocks. Trade exchange background, down arrow graph for decrease in rates. Cryptocurrency price chart, blockchain technology. Global economy crash. , AI. Decrease red trade graph illustrations Bear or bearish market trend in crypto currency or stocks. Trade exchange background, down arrow graph for decrease in rates. Cryptocurrency price chart
Free with trial Bear or bearish market trend in crypto currency or stocks. Trade exchange background, down arrow graph for decrease in rates. Cryptocurrency price chart, blockchain technology. Global economy crash. , AI. Decrease red trade graph illustrations Bear or bearish market trend in crypto currency or stocks. Trade exchange background, down arrow graph for decrease in rates. Cryptocurrency price chart
Free with trial Bear or bearish market trend in crypto currency or stocks. Trade exchange background, down arrow graph for decrease in rates. Cryptocurrency price chart, blockchain technology. Global economy crash. , AI. Decrease red trade graph illustrations Bear or bearish market trend in crypto currency or stocks. Trade exchange background, down arrow graph for decrease in rates. Cryptocurrency price chart
Free with trial Bear or bearish market trend in crypto currency or stocks. Trade exchange background, down arrow graph for decrease in rates. Cryptocurrency price chart, blockchain technology. Global economy crash. , AI. Decrease red trade graph illustrations Bear or bearish market trend in crypto currency or stocks. Trade exchange background, down arrow graph for decrease in rates. Cryptocurrency price chart
 Sign in