Free with trial Close-up of neatly stacked coins, arranged in an ascending and descending pattern, symbolizing financial growth, savings, and investment progress. The blurred background features a dynamic financial market chart with glowing lines, representing stock market trends, economic data, or cryptocurrency fluctuations. This image effectively illustrates concepts of wealth management, business success, risk, and the fluctuating nature of the global economy. It's ideal for financial articles, presentations, and advertisements related to banking, investment, budgeting, and economic analysis. Decrease red trade graph illustrations Financial Growth Concept with Stacks of Coins and Stock Market Chart. Close-up of neatly stacked coins, arranged in an ascending and descending pattern. Close-up of neatly stacked coins, arranged in an ascending and descending pattern, symbolizing financial growth, savings, and investment progress. The blurred background features a dynamic financial market chart with glowing lines, representing stock market trends, economic data, or cryptocurrency fluctuations. This image effectively illustrates concepts of wealth management, business success, risk, and the fluctuating nature of the global economy. It's ideal for financial articles, presentations, and advertisements related to banking, investment, budgeting, and economic analysis.
Free with trial Flat style illustration showing a downward trending financial chart with dollar coin and bars. Decrease red trade graph vectors Financial market decline showing loss with downward trend arrow. Flat style illustration showing a downward trending financial chart with dollar coin and bars. Flat style illustration showing a downward trending financial chart with dollar coin and bars.
Free with trial Bad stock market chart and sad bear. Decrease red trade graph illustrations Bad stock market chart and sad bear.
Free with trial Sophisticated financial dollar. Professional growth indicators. Economic statistics Vector. Professional currency exchanges. EPS 10. Decrease red trade graph vectors Sophisticated financial dollar. Professional growth indicators. Economic statistics Vector. Professional currency exchanges. EPS 10
Free with trial The image shows a smartphone displaying a financial chart with upward and downward trends in green and red, alongside a stack of golden coins. The chart likely represents stock market performance or investment growth, while the coins symbolize wealth accumulation and financial success. Decrease red trade graph illustrations Financial growth illustrated by smartphone chart and golden coins stack. The image shows a smartphone displaying a financial chart with upward and downward. The image shows a smartphone displaying a financial chart with upward and downward trends in green and red, alongside a stack of golden coins. The chart likely represents stock market performance or investment growth, while the coins symbolize wealth accumulation and financial success
Free with trial Two bar chart icons with descending trend arrows. The left chart features black and white bars, while the right chart includes red, green, and blue bars. Both charts depict a downward arrow starting from the peak of one bar to the base of the final bar, symbolizing a decrease or decline. The charts are presented on a white background and are used to represent data reduction or economic downturns graphically. Decrease red trade graph vectors Two Silhouette of bar chart featuring vertical bars on a white background. Two bar chart icons with descending trend arrows. The left chart features black and. Two bar chart icons with descending trend arrows. The left chart features black and white bars, while the right chart includes red, green, and blue bars. Both charts depict a downward arrow starting from the peak of one bar to the base of the final bar, symbolizing a decrease or decline. The charts are presented on a white background and are used to represent data reduction or economic downturns graphically.
Free with trial A 3D composition featuring a red triangular warning sign with an exclamation mark, a golden dollar coin, and a purple downward-pointing arrow, symbolizing financial risk or economic downturn. Decrease red trade graph illustrations 3d warning sign, dollar coin, and down arrow isolated on white. A 3D composition featuring a red triangular warning sign with an exclamation mark, a golden. A 3D composition featuring a red triangular warning sign with an exclamation mark, a golden dollar coin, and a purple downward-pointing arrow, symbolizing financial risk or economic downturn
Free with trial Golden dollar sign with circular chart showing financial growth and decline on black background. Vector graphic design. Decrease red trade graph vectors Golden dollar sign with circular chart showing financial growth and decline on black background. Vector graphic design
Free with trial A digital financial chart shows upward market trends. The red line and green bars rise against a grid. A gold data network overlay adds depth to the business graphic. Decrease red trade graph illustrations Growing Financial Chart Shows Market Growth With Data Grid Background. A digital financial chart shows upward market trends. The red line and green bars rise. A digital financial chart shows upward market trends. The red line and green bars rise against a grid. A gold data network overlay adds depth to the business graphic.
Free with trial Abstract stock market chart with red and green candlesticks illustrating financial data and trading trends. Perfect for representing economic analysis, investment strategies, or business reporting. Decrease red trade graph illustrations Dynamic Stock Market Chart Displaying Fluctuating Trends and Analytics. Abstract stock market chart with red and green candlesticks illustrating financial data. Abstract stock market chart with red and green candlesticks illustrating financial data and trading trends. Perfect for representing economic analysis, investment strategies, or business reporting
Free with trial Stylized data illustrates financial increase using dollar signs, bar graphs, and arrows. Some data trends down while other data trends up, showing potential profits and losses. Decrease red trade graph illustrations Stock Market Data Shows Economic Growth and Potential Loss in the Future. Stylized data illustrates financial increase using dollar signs, bar graphs, and arrows. Stylized data illustrates financial increase using dollar signs, bar graphs, and arrows. Some data trends down while other data trends up, showing potential profits and losses.
Free with trial Illustration of a business activities,. Decrease red trade graph vectors Illustration of a business activities,. Illustration of a business activities
Free with trial The image shows a steep decline in the economy with factories and currency symbols. Vector illustration design using ai tool. Decrease red trade graph vectors Canadian economy collapse. The image shows a steep decline in the economy with factories and currency symbols. Vector illustration design using ai tool. The image shows a steep decline in the economy with factories and currency symbols. Vector illustration design using ai tool.
Free with trial An troubled stock market investor holds the downward pointing arrow from a market chart. In this 3-d illustration about investing. Decrease red trade graph illustrations An troubled stock market investor holds the downward pointing arrow from a market chart. In this 3-d illustration about investing
Free with trial Financial Growth Chart on a Suitcase Business Investment Economy Graphic Illustration. AI generated. Decrease red trade graph vectors Financial Growth Chart on a Suitcase Business Investment Economy Graphic Illustration. AI generated
Free with trial Global economy slowdown economic recession crisis inflation finance business market curve decline risk loss. Generative AI. Decrease red trade graph illustrations Global economy slowdown economic recession crisis inflation finance business market curve decline risk loss. Generative AI
Free with trial Global Downturn Visualized: A striking graphic representation of economic decline, featuring a world map as the backdrop for a visual depiction of market fluctuations. Decrease red trade graph illustrations Global Downturn Visualized: A striking graphic representation. Of economic decline, featuring a world map as the backdrop for a visual depiction of market
Free with trial Statistics and analysis concept. With bottom view on graphs and stats indicators on dark squared background. 3D rendering. Decrease red trade graph illustrations Statistics and analysis concept. With bottom view on graphs and stats indicators on dark squared background. 3D rendering
Free with trial A woman analyzes stock market data using a magnifying glass, with a falling coin and downward trending charts indicating a potential loss. Decrease red trade graph vectors Woman analyzing stock market data with magnifying glass tool. A woman analyzes stock market data using a magnifying glass, with a falling coin and downward. a woman analyzes stock market data using a magnifying glass, with a falling coin and downward trending charts indicating a potential loss.
Free with trial Flat contrasting food and fuel price trends. On the left a grocery basket filled with bread, milk, fruit, and dairy products sits over a downward arrow, while on the right a red gasoline pump stands in front of a rising orange arrow. Gray gears and plus-minus icons in the center suggest economy and calculation. Perfect for concepts of inflation, cost of living, budgeting, energy crisis, and consumer finance. Decrease red trade graph vectors Rising fuel prices versus falling grocery costs. Flat contrasting food and fuel price trends. On the left a grocery basket filled with bread, milk, fruit, and. Flat contrasting food and fuel price trends. On the left a grocery basket filled with bread, milk, fruit, and dairy products sits over a downward arrow, while on the right a red gasoline pump stands in front of a rising orange arrow. Gray gears and plus-minus icons in the center suggest economy and calculation. Perfect for concepts of inflation, cost of living, budgeting, energy crisis, and consumer finance.
Free with trial Candlestick Chart vector Professional Financial Trading icon or symbol. Decrease red trade graph vectors Candlestick Chart vector Professional Financial Trading icon or symbol. Candlestick Chart vector Professional Financial Trading concept icon or symbol
Free with trial Stock market is on sale, finance manager pointing at most reduced with deal sticker price on securities exchange diagram. Decrease red trade graph vectors Stock market is on sale, finance manager pointing at most reduced with deal sticker price on securities exchange diagram.
Free with trial Stacks of coins diminish, mirroring a falling stock market chart against a world map backdrop, symbolizing global economic decline and financial loss. Decrease red trade graph illustrations Global Economic Downturn: Coin Stacks Decline with Bearish Stock Chart. Stacks of coins diminish, mirroring a falling stock market chart against a world map. Stacks of coins diminish, mirroring a falling stock market chart against a world map backdrop, symbolizing global economic decline and financial loss
Free with trial Slow economic growth and inflation create global finance crisis impacting business and market trends leading to potential. Recession and economy. Generative AI. Decrease red trade graph illustrations Slow economic growth and inflation create global finance crisis impacting business and market trends leading to potential. Recession and economy. Generative AI
Free with trial Flat depicting cost reduction concept with a large gas pump chained to delivery trucks, a falling red arrow, stacks of coins and dollar bills, and business people pushing a large block labeled percent costs. Surrounding icons include bar charts, gears, and directional arrows symbolizing economic decline, logistics, and financial strategy. Ideal for articles on inflation, fuel prices, budgeting, supply chain management, and corporate savings. Decrease red trade graph vectors Business Illustration Reducing Fuel Costs Downward Trend. Flat depicting cost reduction concept with a large gas pump chained to delivery trucks, a falling red. Flat depicting cost reduction concept with a large gas pump chained to delivery trucks, a falling red arrow, stacks of coins and dollar bills, and business people pushing a large block labeled percent costs. Surrounding icons include bar charts, gears, and directional arrows symbolizing economic decline, logistics, and financial strategy. Ideal for articles on inflation, fuel prices, budgeting, supply chain management, and corporate savings.
Free with trial Vector of a balance scale comparing delivery costs and sales. The heavy left side labeled delivery costs holds shipping containers, fuel pump and rising orange arrows with cost percentage. The light right side labeled sales holds a sad shopping cart and price tags with falling red arrow. Background shows gas station, delivery trucks and city. Concept of inflation, logistics crisis, ecommerce challenges. Ideal for business, economy, supply chain articles and presentations. Decrease red trade graph vectors Rising Delivery Costs Versus Declining Sales Illustration. Vector of a balance scale comparing delivery costs and sales. The heavy left side labeled delivery. Vector of a balance scale comparing delivery costs and sales. The heavy left side labeled delivery costs holds shipping containers, fuel pump and rising orange arrows with cost percentage. The light right side labeled sales holds a sad shopping cart and price tags with falling red arrow. Background shows gas station, delivery trucks and city. Concept of inflation, logistics crisis, ecommerce challenges. Ideal for business, economy, supply chain articles and presentations.
Free with trial Flat of a blue delivery van carrying parcels being crushed between two pressure walls labeled Fuel Costs and Operating Expenses versus Revenue and Market Pressure. Rising fuel prices with upward arrows and oil drops contrast falling revenue with downward arrows and broken coins. Concept of logistics challenges, inflation, supply chain crisis. Ideal for business, transport, economics articles, presentations and reports. Decrease red trade graph vectors Delivery Van Squeezed Between Rising Costs and Falling Revenue. Flat of a blue delivery van carrying parcels being crushed between two pressure walls labeled. Flat of a blue delivery van carrying parcels being crushed between two pressure walls labeled Fuel Costs and Operating Expenses versus Revenue and Market Pressure. Rising fuel prices with upward arrows and oil drops contrast falling revenue with downward arrows and broken coins. Concept of logistics challenges, inflation, supply chain crisis. Ideal for business, transport, economics articles, presentations and reports.
Free with trial Computer with Candlestick Chart vector Crypto Investment concept icon or design element. Decrease red trade graph vectors Computer with Candlestick Chart vector Crypto Investment icon or design element. Computer with Candlestick Chart vector Crypto Investment concept icon or design. Computer with Candlestick Chart vector Crypto Investment concept icon or design element
Free with trial A collection of colorful flat design icons centered around a large price tag with dollar sign, downward arrow and warning triangle, symbolizing price drop and financial risk. Surrounding icons include money, charts, trucks, shopping bags, magnifying glasses, calendars and warning signs in red, yellow and blue. Isolated on white background. Ideal for business, finance, e-commerce, inflation, crisis, discount and economic analysis concepts in presentations and websites. Decrease red trade graph vectors Financial Risk and Price Drop Icon Set. A collection of colorful flat design icons centered around a large price tag with dollar sign, downward arrow and warning. A collection of colorful flat design icons centered around a large price tag with dollar sign, downward arrow and warning triangle, symbolizing price drop and financial risk. Surrounding icons include money, charts, trucks, shopping bags, magnifying glasses, calendars and warning signs in red, yellow and blue. Isolated on white background. Ideal for business, finance, e-commerce, inflation, crisis, discount and economic analysis concepts in presentations and websites.
Free with trial A colorful flat icon set illustrating inflation, rising prices and economic instability, arranged in a grid on white background. Includes symbols like shopping cart, gas pump, housing cost, calculator, piggy bank, thermometer, charts, graphs, cargo ship, trucks, warehouse, robot, satellite and global map. Red and blue arrows show increase, crash and volatility. Ideal for financial articles, business presentations, economic reports, marketing materials about budgeting, cost of living, recession and market trends. Decrease red trade graph vectors Set of inflation and rising cost icons. A colorful flat icon set illustrating inflation, rising prices and economic instability, arranged in a grid on white. A colorful flat icon set illustrating inflation, rising prices and economic instability, arranged in a grid on white background. Includes symbols like shopping cart, gas pump, housing cost, calculator, piggy bank, thermometer, charts, graphs, cargo ship, trucks, warehouse, robot, satellite and global map. Red and blue arrows show increase, crash and volatility. Ideal for financial articles, business presentations, economic reports, marketing materials about budgeting, cost of living, recession and market trends.
Free with trial Market Data Analysis with Candlestick Chart vector concept colored icon or design element. Decrease red trade graph vectors Market Data Analysis with Candlestick Chart vector colored icon or design element. Market Data Analysis with Candlestick Chart vector concept colored icon or. Market Data Analysis with Candlestick Chart vector concept colored icon or design element
Free with trial Collection of colorful financial arrow icons on white background showing economic trends with up and down arrows combined with dollar, euro, percent, tax, subsidy, plus, minus symbols. Red, blue, orange and gray pictograms illustrate growth, decline, inflation, exchange, profit and loss concepts. Ideal for business presentations, finance reports, banking articles, investment infographics, accounting websites and economic analysis illustrating market movement. Decrease red trade graph vectors Financial Arrow Icons Showing Market Trends. Collection of colorful financial arrow icons on white background showing economic trends with up and down arrows. Collection of colorful financial arrow icons on white background showing economic trends with up and down arrows combined with dollar, euro, percent, tax, subsidy, plus, minus symbols. Red, blue, orange and gray pictograms illustrate growth, decline, inflation, exchange, profit and loss concepts. Ideal for business presentations, finance reports, banking articles, investment infographics, accounting websites and economic analysis illustrating market movement.
Free with trial Trend Line and Candlestick Chart vector Crypto Trading concept colored icon or design element. Decrease red trade graph vectors Trend Line and Candlestick Chart vector Crypto Trading colored icon or design element. Trend Line and Candlestick Chart vector Crypto Trading concept colored. Trend Line and Candlestick Chart vector Crypto Trading concept colored icon or design element
Free with trial Colorful flat line icon set titled Subsidy Policy Impact arranged in grid on white background. Includes symbols for taxation, agriculture, farming tractor, housing, shopping discounts, renewable energy, public transport, education, healthcare costs, small business, international shipping, industry, fuel, and financial growth charts. Modern outline style with red, blue, green and orange colors. Ideal for economic presentations, government policy reports, financial articles, educational materials, and infographics about subsidies and economic development. Decrease red trade graph vectors Subsidy Policy Impact Colorful Economy Icons Set. Colorful flat line icon set titled Subsidy Policy Impact arranged in grid on white background. Includes symbols. Colorful flat line icon set titled Subsidy Policy Impact arranged in grid on white background. Includes symbols for taxation, agriculture, farming tractor, housing, shopping discounts, renewable energy, public transport, education, healthcare costs, small business, international shipping, industry, fuel, and financial growth charts. Modern outline style with red, blue, green and orange colors. Ideal for economic presentations, government policy reports, financial articles, educational materials, and infographics about subsidies and economic development.
Free with trial Flat showing inflation reduction concept for small and medium enterprises. A businessman holds a large red balloon labeled INFLATION with downward arrow above an SME shop platform. Surrounding icons include delivery truck on road bridge, container cargo ship, factory with money bags and gears, rising growth arrows, cash stacks, charts and retail cashiers. Ideal for financial news, economic policy, business strategy, and small business support articles and presentations. Decrease red trade graph vectors Reducing Inflation Impact on Small Business Economy. Flat showing inflation reduction concept for small and medium enterprises. A businessman holds a large red. Flat showing inflation reduction concept for small and medium enterprises. A businessman holds a large red balloon labeled INFLATION with downward arrow above an SME shop platform. Surrounding icons include delivery truck on road bridge, container cargo ship, factory with money bags and gears, rising growth arrows, cash stacks, charts and retail cashiers. Ideal for financial news, economic policy, business strategy, and small business support articles and presentations.
Free with trial Oil barrels with declining price chart signify decreasing oil prices, negative market trend. Visual represents economic challenges, financial downturns, volatile energy sector. Focus on. Decrease red trade graph illustrations Oil barrels with declining price chart signify decreasing oil prices, negative market trend. Visual represents economic. Challenges, financial downturns. Oil barrels with declining price chart signify decreasing oil prices, negative market trend. Visual represents economic challenges, financial downturns, volatile energy sector. Focus on.
Free with trial This image was created using Generative AI. Symbol of financial loss with a red downward arrow over blue bars. Visual representation of market decline and economic recession. Suitable for business charts and reports. Decrease red trade graph vectors Financial Loss Icon With Downward Trend Arrow Symbol. This image was created using Generative AI. Symbol of financial loss with a red downward arrow over blue. This image was created using Generative AI. Symbol of financial loss with a red downward arrow over blue bars. Visual representation of market decline and economic recession. Suitable for business charts and reports
Free with trial Viewing Progress Icon Line Design Style Finance and Business Symbol. Vector Illustrations. Decrease red trade graph vectors Viewing Progress Icon Line Design Style Finance and Business Symbol. Vector Illustrations
Free with trial Colorful flat showing a large metal vise labeled costs and expenses squeezing a delivery worker with packages, symbolizing shrinking profit margin. Surrounded by rising red arrows, coins, fuel pumps, bar charts and graphs representing inflation, revenue decline and financial pressure. Concept of economic squeeze, logistics challenges and business struggle. Ideal for articles on inflation, supply chain, accounting, small business finance and economic crisis. Decrease red trade graph vectors Business Profit Squeezed by Rising Costs Illustration. Colorful flat showing a large metal vise labeled costs and expenses squeezing a delivery worker with. Colorful flat showing a large metal vise labeled costs and expenses squeezing a delivery worker with packages, symbolizing shrinking profit margin. Surrounded by rising red arrows, coins, fuel pumps, bar charts and graphs representing inflation, revenue decline and financial pressure. Concept of economic squeeze, logistics challenges and business struggle. Ideal for articles on inflation, supply chain, accounting, small business finance and economic crisis.
Free with trial A futuristic robotic hand reaches towards interactive financial charts, showcasing cutting-edge technology in data analysis and stock market trends with vivid color accents. Scalp. Decrease red trade graph illustrations Advanced robotic hand interacting with dynamic financial charts and graphs, artificial intelligence analysis, stock. A futuristic robotic hand reaches towards. A futuristic robotic hand reaches towards interactive financial charts, showcasing cutting-edge technology in data analysis and stock market trends with vivid color accents. Scalp
Free with trial A set of colorful flat line business and finance icons arranged in rows on white background, including shopping cart, gears, pie charts, bar graphs with upward arrows, dollar coins, money bags, factory buildings, delivery trucks, calendar, hand holding coin, house and businessman. Modern minimal outline style with orange, green, blue and red colors. Perfect for economic reports, banking, investment, e-commerce, marketing presentations, websites and mobile apps. Decrease red trade graph vectors Colorful Business Finance Economy Icon Set Collection. A set of colorful flat line business and finance icons arranged in rows on white background, including. A set of colorful flat line business and finance icons arranged in rows on white background, including shopping cart, gears, pie charts, bar graphs with upward arrows, dollar coins, money bags, factory buildings, delivery trucks, calendar, hand holding coin, house and businessman. Modern minimal outline style with orange, green, blue and red colors. Perfect for economic reports, banking, investment, e-commerce, marketing presentations, websites and mobile apps.
Free with trial Reciprocal tariffs and stock market crashes and economic decline or falling stock market prices Inflation and economic decline. Decrease red trade graph illustrations Reciprocal tariffs and stock market crashes and economic decline or falling stock market prices Inflation and economic decline.
Free with trial Colorful infographic showing how inflation erodes business profits. A red flame monster labeled inflation devours blocks representing operational costs, while factory workers handle fuel and labor expenses. Blue bar charts labeled profits rise then crumble, with a red downward arrow indicating profit erosion and a worried worker. Ideal for articles on economics, manufacturing challenges, rising costs, financial crisis, and business strategy presentations. Decrease red trade graph vectors Inflation Causing Profit Erosion in Industrial Business. Colorful infographic showing how inflation erodes business profits. A red flame monster labeled. Colorful infographic showing how inflation erodes business profits. A red flame monster labeled inflation devours blocks representing operational costs, while factory workers handle fuel and labor expenses. Blue bar charts labeled profits rise then crumble, with a red downward arrow indicating profit erosion and a worried worker. Ideal for articles on economics, manufacturing challenges, rising costs, financial crisis, and business strategy presentations.
Free with trial People drive the stock market. And that is the theme of this illustration of people on an up and down stock market chart. Decrease red trade graph illustrations People drive the stock market. And that is the theme of this illustration of people on an up and down stock market chart
Free with trial Financial Decline Bar Chart Downward Arrow Crisis Concept, illustration. Decrease red trade graph illustrations Financial Decline Bar Chart Downward Arrow Crisis Concept. Illustration
Free with trial Flat showing the economic impact of rising fuel prices on logistics and retail. Features gas pump icons, upward cost arrows, a large red downward arrow, delivery truck, cargo ship, shopping cart, cash register, coins and percentage symbols. Concept visualizes supply chain costs, inflation, and declining retail profit in euros. Isolated on white background, ideal for business, finance, energy crisis, and economic articles, presentations, and reports. Decrease red trade graph vectors Rising Fuel Costs Impacting Retail Profit Illustration. Flat showing the economic impact of rising fuel prices on logistics and retail. Features gas pump icons. Flat showing the economic impact of rising fuel prices on logistics and retail. Features gas pump icons, upward cost arrows, a large red downward arrow, delivery truck, cargo ship, shopping cart, cash register, coins and percentage symbols. Concept visualizes supply chain costs, inflation, and declining retail profit in euros. Isolated on white background, ideal for business, finance, energy crisis, and economic articles, presentations, and reports.
Free with trial Infographic divided into two sections showing Rising Fuel Costs and Economic Impact and Solutions with upward orange and red arrows and downward black arrows surrounded by icons of truck, factory, cargo ship, gas pumps, bar charts, pie chart, gears and wallet on white background representing energy price inflation, transportation expense, industrial production and financial crisis concept ideal for business, finance, logistics and environmental articles. Decrease red trade graph vectors Rising Fuel Costs Economic Impact Infographic Illustration. Infographic divided into two sections showing Rising Fuel Costs and Economic Impact and Solutions. Infographic divided into two sections showing Rising Fuel Costs and Economic Impact and Solutions with upward orange and red arrows and downward black arrows surrounded by icons of truck, factory, cargo ship, gas pumps, bar charts, pie chart, gears and wallet on white background representing energy price inflation, transportation expense, industrial production and financial crisis concept ideal for business, finance, logistics and environmental articles.
Free with trial Illustration of bear and arrow up. Ai illustration. Decrease red trade graph illustrations Illustration of bear and arrow up Ai illustration. Illustration of bear and arrow up. Ai illustration. Illustration of bear and arrow up. Ai illustration.
Free with trial Reciprocal tariffs and stock market crashes and economic decline or falling stock market prices. Decrease red trade graph illustrations Reciprocal tariffs and stock market crashes and economic decline or falling stock market prices.
Free with trial Range Breakout vector Candlestick Chart icon or symbol. Decrease red trade graph vectors Range Breakout vector Candlestick Chart icon or symbol. Range Breakout vector Candlestick Chart concept icon or symbol
Free with trial Flat depicting economic concepts of inflation, rising prices and market volatility. Central rising and falling arrows on a chart background surrounded by icons including shopping cart with groceries, house with price tag, delivery truck, stacks of coins with office building, and confused consumer with empty pockets. Ideal for finance, economy, recession, cost of living, real estate and business articles, presentations and educational materials. Decrease red trade graph vectors Inflation and Economic Growth Concept Illustration with Graphs. Flat depicting economic concepts of inflation, rising prices and market volatility. Central. Flat depicting economic concepts of inflation, rising prices and market volatility. Central rising and falling arrows on a chart background surrounded by icons including shopping cart with groceries, house with price tag, delivery truck, stacks of coins with office building, and confused consumer with empty pockets. Ideal for finance, economy, recession, cost of living, real estate and business articles, presentations and educational materials.
Free with trial Vector showing a large hand pushing down a red declining arrow onto a broken road filled with congested cars, buses, trucks and motorcycles. Bar charts rise in background while gold coins scatter. A heavy chain with dollar symbols surrounds the scene, symbolizing supply chain disruption, logistics crisis, traffic congestion, inflation and economic recession. Ideal for business, finance, transportation and economic articles, presentations and marketing materials. Decrease red trade graph vectors Supply Chain Disruption Causing Economic Downturn Illustration. Vector showing a large hand pushing down a red declining arrow onto a broken road filled with. Vector showing a large hand pushing down a red declining arrow onto a broken road filled with congested cars, buses, trucks and motorcycles. Bar charts rise in background while gold coins scatter. A heavy chain with dollar symbols surrounds the scene, symbolizing supply chain disruption, logistics crisis, traffic congestion, inflation and economic recession. Ideal for business, finance, transportation and economic articles, presentations and marketing materials.
Free with trial This AI-generated image shows a financial professional facing economic loss. Perfect for analysts needing to visualize market downturns, it highlights risk management in a modern corporate setting. Decrease red trade graph illustrations Businessman holding a declining financial bar chart with a red arrow. This AI-generated image shows a financial professional facing economic loss. Perfect for. This AI-generated image shows a financial professional facing economic loss. Perfect for analysts needing to visualize market downturns, it highlights risk management in a modern corporate setting.
Free with trial Icons on a white background depict percentage symbols combined with arrows and bar graphs. The top row includes red, blue, and yellow arrows with percentage symbols. The middle row shows a multicolored bar graph, green percentage symbols, and a black percentage symbol with a black arrow. The bottom row contains a black bar graph, a downward arrow, and a large black percentage symbol. These elements visually represent data trends, growth, and decline. Decrease red trade graph vectors Percentage Growth and Decline Arrow Icon Set Multi Color and Silhouette. Icons on a white background depict percentage symbols combined with arrows and bar. Icons on a white background depict percentage symbols combined with arrows and bar graphs. The top row includes red, blue, and yellow arrows with percentage symbols. The middle row shows a multicolored bar graph, green percentage symbols, and a black percentage symbol with a black arrow. The bottom row contains a black bar graph, a downward arrow, and a large black percentage symbol. These elements visually represent data trends, growth, and decline.
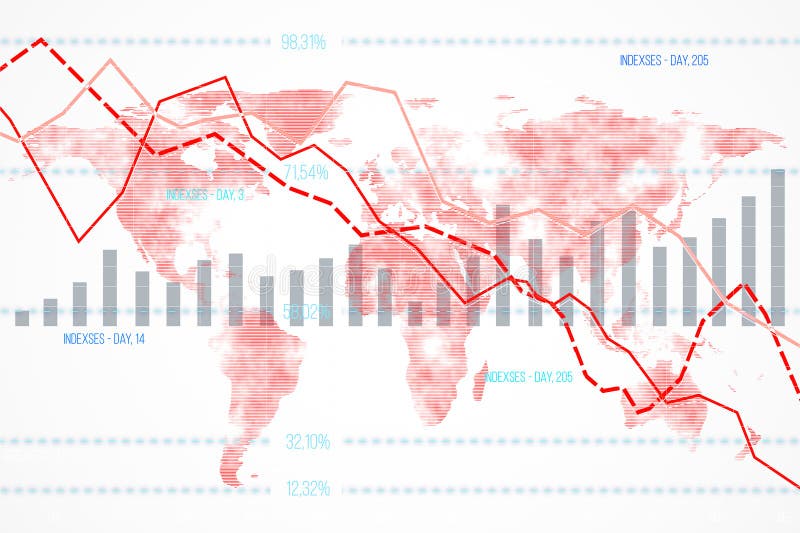
Free with trial Financial data chart featuring declining indexes and bar graphs overlaid on a world map background. Concept of global economic downturn. 3D Rendering. Decrease red trade graph illustrations Financial data chart with declining indexes on a world map background. 3D Rendering. Financial data chart featuring declining indexes and bar graphs overlaid on. Financial data chart featuring declining indexes and bar graphs overlaid on a world map background. Concept of global economic downturn. 3D Rendering
Free with trial Real-Time Market Data Analysis with Candlestick Chart vector icon or symbol. Decrease red trade graph vectors Real-Time Market Data Analysis with Candlestick Chart vector icon or symbol. Real-Time Market Data Analysis with Candlestick Chart vector concept icon or symbol
Free with trial Range or Levels Breakout vector Candlestick Chart concept colored icon or design element. Decrease red trade graph vectors Range or Levels Breakout vector Candlestick Chart colored icon or design element. Range or Levels Breakout vector Candlestick Chart concept colored icon or. Range or Levels Breakout vector Candlestick Chart concept colored icon or design element
Free with trial Real-Time Market Data Analysis with Candlestick Chart vector concept seamless pattern. Decrease red trade graph vectors Real-Time Market Data Analysis with Candlestick Chart vector seamless pattern. Real-Time Market Data Analysis with Candlestick Chart vector concept seamless. Real-Time Market Data Analysis with Candlestick Chart vector concept seamless pattern
Free with trial Trend Line and Candlestick Chart vector Crypto Trading concept colored seamless pattern. Decrease red trade graph vectors Trend Line and Candlestick Chart vector Crypto Trading colored seamless pattern. Trend Line and Candlestick Chart vector Crypto Trading concept colored seamless. Trend Line and Candlestick Chart vector Crypto Trading concept colored seamless pattern
Free with trial Bearish stock market, Global economy crisis and bearish stock market crash, concept illustration image. Decrease red trade graph illustrations Bearish stock market, Global economy crisis and bearish stock market crash, concept illustration image.
Free with trial This AI-generated image features a person presenting a downward economic trend. Ideal for financial analysts and business bloggers, it visualizes market loss and recession in a clean, minimalist style to illustrate economic challenges. Decrease red trade graph illustrations A professional person holding a declining financial bar chart with a red arrow against a white background. This AI-generated image features a person presenting. This AI-generated image features a person presenting a downward economic trend. Ideal for financial analysts and business bloggers, it visualizes market loss and recession in a clean, minimalist style to illustrate economic challenges.
Free with trial Uptrend and downtrend arrow icon with long shadow. Up and down arrows illustration concept. Decrease red trade graph vectors Uptrend and downtrend arrow icon with long shadow. Up and down arrows concept. Uptrend and downtrend arrow icon with long shadow. Up and down arrows illustration. Uptrend and downtrend arrow icon with long shadow. Up and down arrows illustration concept
Free with trial Candlestick Chart and Speech Bubble vector Cryptocurrency Trading concept colored icon or symbol. Decrease red trade graph illustrations Candlestick Chart and Speech Bubble vector Cryptocurrency Trading colored icon or symbol. Candlestick Chart and Speech Bubble vector Cryptocurrency Trading. Candlestick Chart and Speech Bubble vector Cryptocurrency Trading concept colored icon or symbol
Free with trial Candlestick Chart and Speech Bubble vector Cryptocurrency Trading concept colored seamless pattern. Decrease red trade graph illustrations Candlestick Chart and Speech Bubble vector Cryptocurrency Trading colored seamless pattern. Candlestick Chart and Speech Bubble vector Cryptocurrency Trading. Candlestick Chart and Speech Bubble vector Cryptocurrency Trading concept colored seamless pattern
Free with trial Investing and Trading vector colored seamless pattern. Decrease red trade graph vectors Investing and Trading vector colored seamless pattern. Investing and Trading vector concept colored seamless pattern
Free with trial A downward trending arrow chart on a dark background symbolizing financial recession, market collapse, and economic loss in a minimalist 3D business concept. Decrease red trade graph illustrations A downward trending arrow chart on a dark background symbolizing financial recession, market collapse, and economic loss in a. Minimalist 3D business concept
Free with trial Close up of laptop with falling chart on screen at workplace. Recession concept. 3D Rendering. Decrease red trade graph illustrations Close up of laptop with falling chart on screen at workplace. Recession concept. 3D Rendering
Free with trial Global economy faces slowdown with inflation and recession risks impacting finance, business, and market trends during this economic crisis. Generative AI. Decrease red trade graph illustrations Global economy faces slowdown with inflation and recession risks impacting finance business and market trends during this. Global economy faces slowdown with. Global economy faces slowdown with inflation and recession risks impacting finance, business, and market trends during this economic crisis. Generative AI
Free with trial Bearish stock market, Bear Market and Economic Crisis, Recession or Bubble Burst. concept illustration image. Decrease red trade graph illustrations Bearish stock market, Bear Market and Economic Crisis, Recession or Bubble Burst. concept illustration image.
Free with trial Economic crisis and inflation impact global business market causing slowdown and recession in finance sectors with sharp decline. Trends. Generative AI. Decrease red trade graph illustrations Economic crisis and inflation impact global business market causing slowdown and recession in finance sectors with sharp decline. Trends. Generative AI
Free with trial A striking 3D representation of a world globe with a declining arrow and oil barrels, symbolizing economic downturn and market struggles. Decrease red trade graph illustrations Global downturn concept with declining arrow, oil barrels, and world map in 3D representation, illustrating market challenges. A striking 3D representation of a. A striking 3D representation of a world globe with a declining arrow and oil barrels, symbolizing economic downturn and market struggles
Free with trial Uptrend and downtrend arrow icon with long shadow. Arrows zigzag concept. Decrease red trade graph vectors Uptrend and downtrend arrow icon with long shadow. Arrows zigzag concept
Free with trial Uptrend and downtrend arrow icon on circle line. Zigzag arrows up and down illustration concept. Decrease red trade graph vectors Uptrend and downtrend arrow icon on circle line. Zigzag arrows up and down concept. Uptrend and downtrend arrow icon on circle line. Zigzag arrows up and down. Uptrend and downtrend arrow icon on circle line. Zigzag arrows up and down illustration concept
Free with trial Economic critical crisis concept. The drop down arrow and bar chart on black background. Recession financial, cryptocurrency, gold, and the stock market. Losing money and cash. Bearish. Decrease red trade graph vectors Economic critical crisis concept. The drop down arrow and bar chart on black background. Recession financial, cryptocurrency,. Gold, and the stock market. Economic critical crisis concept. The drop down arrow and bar chart on black background. Recession financial, cryptocurrency, gold, and the stock market. Losing money and cash. Bearish
Free with trial Meta tags with sample numbers for stock market. Decrease red trade graph illustrations Meta tags with sample numbers for stock market.
Free with trial Meta tags with sample numbers for stock market. Decrease red trade graph illustrations Meta tags with sample numbers for stock market.
Free with trial Meta tags with sample numbers for stock market. Decrease red trade graph illustrations Meta tags with sample numbers for stock market.
Free with trial Meta tags with sample numbers for stock market. Decrease red trade graph illustrations Meta tags with sample numbers for stock market.
Free with trial Isometric line Global economic crisis icon isolated on grey background. World finance crisis. Yellow and orange square button. Vector. Decrease red trade graph illustrations Isometric line Global economic crisis icon isolated on grey background. World finance crisis. Yellow and orange square. Button. Vector
Free with trial Trend and Candlestick Chart vector Crypto Investment icon or symbol. Decrease red trade graph vectors Trend and Candlestick Chart vector Crypto Investment icon or symbol. Trend and Candlestick Chart vector Crypto Investment concept icon or symbol
 Sign in