Free with trial A conceptual illustration symbolizing the shift towards sustainable transportation. Decrease reduction vectors EcoFriendly Vehicle Carbon Reduction Concept. A conceptual illustration symbolizing the shift towards sustainable transportation
Free with trial Coin with down arrow, money interest rate reduction gradient lineal icon. Finance, payment, invest finance symbol design. Isolated on white background. Decrease reduction vectors Coin with down arrow, money interest rate reduction gradient lineal icon. Finance, payment, invest finance symbol design
Free with trial Cost and quality control, business strategy and project management concept. Businessman use computer laptop with quality control growth graph and cost reduction, control budget cost and improvement. Decrease reduction illustrations Cost and quality control, business strategy and project management concept. Businessman use computer laptop with quality control
Free with trial A simple and bold black curved arrow icon, isolated on a clean white background. This minimalist graphic element points downwards and to the right, symbolizing direction, movement, and flow. It can represent concepts such as decline, decrease, or a downward trend in business charts and infographics. This versatile vector-style illustration is perfect for use as a pointer, a navigation symbol in web design and user interfaces, or to guide attention in presentations and documents. The high contrast and clean design make it easy to integrate into any project. Decrease reduction vectors Curved Black Arrow Pointing Down and Right Icon. A simple and bold black curved arrow icon, isolated on a clean white background. This minimalist graphic element points downwards and to the right, symbolizing direction, movement, and flow. It can represent concepts such as decline, decrease, or a downward trend in business charts and infographics. This versatile vector-style illustration is perfect for use as a pointer, a navigation symbol in web design and user interfaces, or to guide attention in presentations and documents. The high contrast and clean design make it easy to integrate into any project.
Free with trial Black outline icon of a stack of papers with a downward arrow, representing data loss or reduction. Decrease reduction illustrations Arrow pointing down at decreasing stack of documents icon. Black outline icon of a stack of papers with a downward arrow, representing data loss or reduction
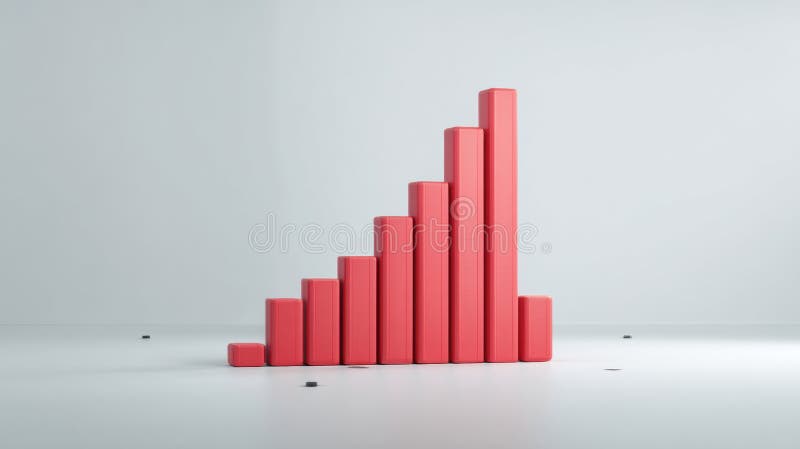
Free with trial This 3D bar graph, generated by AI, visually represents a significant downward trend. The red bars show a decrease in value over time, culminating in a sharp drop indicated by the prominent red arrow. This image is ideal for illustrating economic downturns, market crashes, or any scenario depicting. Decrease reduction illustrations Declining Bar Graph. This 3D bar graph, generated by AI, visually represents a significant downward trend. The red bars show a decrease in value over time, culminating in a sharp drop indicated by the prominent red arrow. This image is ideal for illustrating economic downturns, market crashes, or any scenario depicting
Free with trial Businessman stick figure character pulling arrow graph chart up with a rope. Investment and economic crisis, market recession, cost reduction concept. hand drawn style vector doodle illustration. Decrease reduction vectors Businessman stick figure character pulling arrow graph chart up with a rope. Investment and economic crisis, market recession
Free with trial Metal arrow pointing downwards represents a decline or falling trend, useful for illustrating negative growth or regression in presentations and reports. Decrease reduction illustrations Downward Trending Arrow Shows Decline or Decrease. Metal arrow pointing downwards represents a decline or falling trend, useful for illustrating negative growth or regression in presentations and reports
Free with trial A golden magnifying glass is positioned on a solid green background. The lens of the magnifying glass displays a white graphic of a cloud with the text "CO2" below it, accompanied by three downward-pointing arrows. Decrease reduction illustrations Magnifying glass over C O2 reduction symbol carbon. A golden magnifying glass is positioned on a solid green background. The lens of the magnifying glass displays a white graphic of a cloud with the text "CO2" below it, accompanied by three downward-pointing arrows
Free with trial , Applied for Info Graphics, Design Elements, Websites, Presentations, and Application - Vector. Decrease reduction illustrations Decrease Icon. Down Symbol within Glyph Style - Vector. , Applied for Info Graphics, Design Elements, Websites, Presentations, and Application - Vector.
Free with trial An infographic illustrates a sharp decline during the winter season. Decrease reduction vectors Winter Temperature Decrease Chart with Thermometer. An infographic illustrates a sharp decline during the winter season
Free with trial Stacks of coins with a dollar sign coin, a carbon footprint labeled CO2, and a downward arrow. Ideal for sustainability, finance, eco-friendly economics, climate action, carbon reduction, green. Decrease reduction vectors Reducing Carbon Emissions with Cost Efficiency and Financial Savings. Stacks of coins with a dollar sign coin, a carbon footprint labeled CO2, and a downward arrow. Ideal for sustainability, finance, eco-friendly economics, climate action, carbon reduction, green
Free with trial Beige mailbox on wooden post with a declining bar graph, suggesting a decrease in mail volume or economic downturn. Image is digitally rendered. Decrease reduction illustrations Beige Mailbox and Declining Bar Graph on Wooden Post. Beige mailbox on wooden post with a declining bar graph, suggesting a decrease in mail volume or economic downturn. Image is digitally rendered
Free with trial Black and white icon of a dollar coin with three arrows pointing down, illustrating a decrease in value. Decrease reduction vectors Dollar coin with three down arrows representing decreasing value. Black and white icon of a dollar coin with three arrows pointing down, illustrating a decrease in value
Free with trial A businessman in a suit draws a red downward trend line over a bar graph, illustrating cost reduction and financial decline. Decrease reduction illustrations Businessman Drawing a Downward Trend Line on a Cost Graph. A businessman in a suit draws a red downward trend line over a bar graph, illustrating cost reduction and financial decline
Free with trial Three red, downward-pointing arrows are displayed against a black background. Each arrow prominently features the number "50" and a "%" symbol in white, indicating a 50% discount or reduction. The central arrow is larger than the two flanking arrows, creating a visual emphasis. Decrease reduction illustrations Three Red Arrows With 50 Percent Discount sale percentage. Three red, downward-pointing arrows are displayed against a black background. Each arrow prominently features the number "50" and a "%" symbol in white, indicating a 50% discount or reduction. The central arrow is larger than the two flanking arrows, creating a visual emphasis
Free with trial Minimalist style illustration of a hand presenting a coin with a downward arrow, representing financial loss, investment decrease, or economic downturn. Simple, clean design suitable for various business and financial related applications. Decrease reduction vectors Bold Line Hand Holding Coin with Down Arrow Financial Icon. Minimalist style illustration of a hand presenting a coin with a downward arrow, representing financial loss, investment decrease, or economic downturn. Simple, clean design suitable for various business and financial related applications.
Free with trial This 3D rendered bar graph, generated by AI, visually represents a downward trend. The red bars progressively decrease in height, illustrating a clear decline. Perfect for illustrating concepts related to loss, decrease, or decline in presentations and reports. Decrease reduction illustrations Declining Bar Graph. This 3D rendered bar graph, generated by AI, visually represents a downward trend. The red bars progressively decrease in height, illustrating a clear decline. Perfect for illustrating concepts related to loss, decrease, or decline in presentations and reports.
Free with trial Blue downward arrow, circular user avatar, abstract line, and curve visuals. Ideal for analytics, statistics, loss, user activity disengagement performance digital trends. Clean flat metaphor. Decrease reduction illustrations Downward Arrow and User Avatar Representing Decline or Decrease in User Activity. Blue downward arrow, circular user avatar, abstract line, and curve visuals. Ideal for analytics, statistics, loss, user activity disengagement performance digital trends. Clean flat metaphor
Free with trial A simple graphic depicting a downward pointing arrow, symbolizing a decrease or loss in financial value. The dollar sign is prominently featured. Decrease reduction vectors Decreasing Dollar Value: Financial Loss Icon, Downward Trend. A simple graphic depicting a downward pointing arrow, symbolizing a decrease or loss in financial value. The dollar sign is prominently featured.
Free with trial Thermometer and falling bar chart with a directional arrow symbolizing temperature drop, analysis, and reduction. Ideal for climate change, trends, progress, energy, analytics, business metrics. Decrease reduction illustrations Thermometer and Declining Bar Chart Representing Cooling Trends and Data Insights. Thermometer and falling bar chart with a directional arrow symbolizing temperature drop, analysis, and reduction. Ideal for climate change, trends, progress, energy, analytics, business metrics
Free with trial 3d holographic futuristic simple arrow pointing down isolated on white background. Decrease reduction illustrations Holographic futuristic arrow pointing down representing decrease or download. 3d holographic futuristic simple arrow pointing down isolated on white background
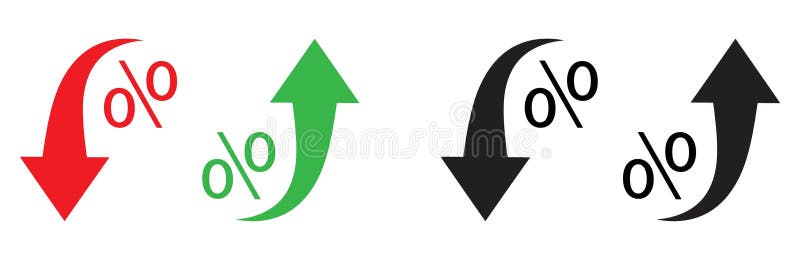
Free with trial Four symbols featuring curved arrows and percentage signs. Two black arrows are paired with black percentage signs, pointing in opposite directions. A green arrow curves upward with a matching green percentage sign, while a red arrow curves downward with a corresponding red percentage sign. Each set emphasizes direction, often associated with financial or statistical changes, like increases or decreases in percentages. The background is white for clarity. Decrease reduction vectors Percent arrow icon. Growth, increase, decrease arrow filled icons. Four symbols featuring curved arrows and percentage signs. Two black arrows are paired with black percentage signs, pointing in opposite directions. A green arrow curves upward with a matching green percentage sign, while a red arrow curves downward with a corresponding red percentage sign. Each set emphasizes direction, often associated with financial or statistical changes, like increases or decreases in percentages. The background is white for clarity.
Free with trial Wooden numbers representing 96% are placed on a dark wooden surface, with a red downward-pointing arrow positioned beside them. Decrease reduction illustrations 96% Decrease Shown with Wooden Numbers and Arrow. Wooden numbers representing 96% are placed on a dark wooden surface, with a red downward-pointing arrow positioned beside them.
Free with trial Quality increase and cost optimization to improve efficiency and profit. Businessman with quality control growth graph and cost reduction, Effective business, Efficient Risk. Decrease reduction vectors Quality increase and cost optimization to improve efficiency and profit. Businessman with quality control growth graph and cost
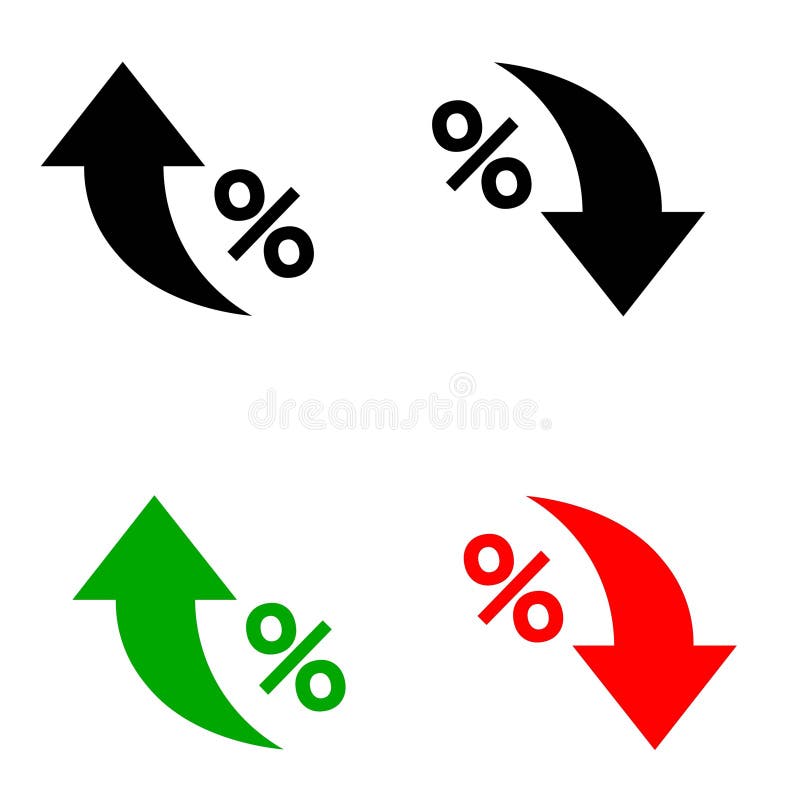
Free with trial Red and black arrows point downward, while green and black arrows point upward. Each arrow is curved, paired with a percentage symbol (%), indicating changes in rate or value. The red and black arrows denote decrease, and the green and black arrows denote increase, suggesting economic or statistical trends. The arrows and symbols are bold and stylized for emphasis. Decrease reduction vectors Percent arrow icon. Growth, increase, decrease arrow filled icons. Up arrows, down arrows. Red and black arrows point downward, while green and black arrows point upward. Each arrow is curved, paired with a percentage symbol (%), indicating changes in rate or value. The red and black arrows denote decrease, and the green and black arrows denote increase, suggesting economic or statistical trends. The arrows and symbols are bold and stylized for emphasis.
Free with trial White clouds illustrate CO2 levels decreasing. Arrows show CO2 exchange, transitioning to leaves symbolizing carbon capture and a cleaner environment. Decrease reduction illustrations Carbon Dioxide Reduction: A Clean Energy Conceptual Illustration. White clouds illustrate CO2 levels decreasing. Arrows show CO2 exchange, transitioning to leaves symbolizing carbon capture and a cleaner environment
Free with trial The image features a clean and minimalistic vector design of a magnifying glass with a minus sign, symbolizing the zoom-out functionality in digital interfaces. It represents tools for inspection and examination in a technological context, showcasing a focus on reduction and clarity. The design is simple and effective, made with AI. Decrease reduction vectors Magnifying Glass with Minus Sign Vector for Zoom Out Functionality. The image features a clean and minimalistic vector design of a magnifying glass with a minus sign, symbolizing the zoom-out functionality in digital interfaces. It represents tools for inspection and examination in a technological context, showcasing a focus on reduction and clarity. The design is simple and effective, made with AI.
Free with trial The "Vector Dollar Down Icon Symbol" is a graphical representation designed to indicate a decrease or downward trend related to financial aspects, specifically involving currency or value. Decrease reduction vectors Vector Dollar Down Icon Symbol
Free with trial Solar panel on a stand, footprint with CO2 text, thermometer with downward arrow, and heart. Ideal for sustainability, eco-energy, carbon reduction, clean power, green living climate change simple. Decrease reduction illustrations Solar Panel for Green Energy with Reduced Carbon Footprint and Sustainability Icons. Solar panel on a stand, footprint with CO2 text, thermometer with downward arrow, and heart. Ideal for sustainability, eco-energy, carbon reduction, clean power, green living climate change simple
Free with trial Increase Decrease Temperature Icon. Thermometer with plus minus symbol high low increasing decreasing up down scale to measure set or adjust climate. Decrease reduction vectors Increase Decrease Temperature Icon. Thermometer with plus minus symbol high low increasing decreasing up down scale to measure
Free with trial Icons depicting concepts such as carbon dioxide emission, reducing co2 footprint and fighting climate change. Decrease reduction vectors Carbon dioxide emission reduction reducing co2 footprint climate change icons. Icons depicting concepts such as carbon dioxide emission, reducing co2 footprint and fighting climate change
Free with trial A simple image of a negative or decline sign isolated on a white background, ideal for concepts of decrease or downturn. Decrease reduction illustrations Negative or Decline Sign Isolated on White Background. A simple image of a negative or decline sign isolated on a white background, ideal for concepts of decrease or downturn
Free with trial CO2 cloud with downward arrows, small graph showing fluctuation and falling coins. Ideal for climate change, sustainability, economy, environment, cost, finance emissions. Simple flat metaphor. Decrease reduction vectors Carbon Emissions Reduction and Economic Impact Illustrated with Graph and Coin Elements. CO2 cloud with downward arrows, small graph showing fluctuation and falling coins. Ideal for climate change, sustainability, economy, environment, cost, finance emissions. Simple flat metaphor
Free with trial Green percentage symbol with a down arrow shows rate decline on clean white background Representing financial and economic concepts. Decrease reduction illustrations Green Percentage Sign with Down Arrow Indicating Decrease on White. Green percentage symbol with a down arrow shows rate decline on clean white background Representing financial and economic concepts
Free with trial Yellow Circle with a Minus Sign Represents Reduction Subtraction Icon. Decrease reduction vectors Yellow Circle with a Minus Sign Represents Reduction Subtraction Icon
Free with trial This image features a striking red neon-style line graph on a black background, symbolizing decline, decrease, or downward trend in data visualization. Ideal for business, finance, and analytics concepts, it visually represents performance drops or negative growth in a modern, eye-catching manner. Decrease reduction illustrations Red Neon Declining Graph Line Icon for Business Data Visualization. This image features a striking red neon-style line graph on a black background, symbolizing decline, decrease, or downward trend in data visualization. Ideal for business, finance, and analytics concepts, it visually represents performance drops or negative growth in a modern, eye-catching manner.
Free with trial Simple Set of Increase and Decrease Related Vector Art on a white background" features a clean and minimalist collection of icons representing growth, decline, progress, and reduction. The set includes arrows, charts, and symbols with sleek, solid designs, making it ideal for business, finance, or analytical presentations. These versatile and visually straightforward icons are perfect for conveying trends and changes with clarity and professionalism. Decrease reduction vectors Simple Set of Increase and Decrease Related Vector art on white background. Simple Set of Increase and Decrease Related Vector Art on a white background" features a clean and minimalist collection of icons representing growth, decline, progress, and reduction. The set includes arrows, charts, and symbols with sleek, solid designs, making it ideal for business, finance, or analytical presentations. These versatile and visually straightforward icons are perfect for conveying trends and changes with clarity and professionalism.
Free with trial A vibrant glossy red arrow curves downwards, symbolizing a negative trend, decline, or reduction. This eye-catching graphic is perfect for presentations and reports illustrating falling data or negative performance. Decrease reduction illustrations Glossy red downward arrow graphic sign indicating trend decline or decrease white background. A vibrant glossy red arrow curves downwards, symbolizing a negative trend, decline, or reduction. This eye-catching graphic is perfect for presentations and reports illustrating falling data or negative performance
Free with trial 3D low price icons with red up and down arrows showing rate drop and market decline. Abstract financial vector about price decrease, percent change, and economic fall in modern business design. Decrease reduction vectors 3D low price icons with red up and down arrows showing rate drop and market decline. Abstract financial vector about
Free with trial A minimalist graphic depicting a bar chart with falling bars and a downward-pointing arrow, symbolizing a negative trend, economic downturn, or performance decline. Clean and clear representation of loss. Decrease reduction illustrations Simple downward trend bar chart icon indicating decline or decrease. A minimalist graphic depicting a bar chart with falling bars and a downward-pointing arrow, symbolizing a negative trend, economic downturn, or performance decline. Clean and clear representation of loss
Free with trial A crisp vector illustration of an orange downward trending line graph, signifying a fall, loss, or negative economic movement. This versatile icon is perfect for financial dashboards, business analysis, or reporting on declining statistics. Its clear visual representation quickly conveys a reduction in values, making it highly effective, vector design Generative AI. Decrease reduction vectors Orange Downward Trending Financial Graph, vector design Generative AI. A crisp vector illustration of an orange downward trending line graph, signifying a fall, loss, or negative economic movement. This versatile icon is perfect for financial dashboards, business analysis, or reporting on declining statistics. Its clear visual representation quickly conveys a reduction in values, making it highly effective, vector design Generative AI
Free with trial Growing plant with bold leaves, a carbon footprint icon, and a calendar. Ideal for sustainability, eco goals, renewable resources, environmental awareness, emission reduction, green initiatives. Decrease reduction vectors Sustainable practices symbolized by growing plant, carbon footprint, and calendar schedule. Growing plant with bold leaves, a carbon footprint icon, and a calendar. Ideal for sustainability, eco goals, renewable resources, environmental awareness, emission reduction, green initiatives
Free with trial Discover a diverse collection of flat illustration concept vectors, perfect for enhancing your design projects. Explore creativity with our unique visuals. Decrease reduction vectors Cost reduction concept costs cut costs optimization business Flat vector concept illustration. Discover a diverse collection of flat illustration concept vectors, perfect for enhancing your design projects. Explore creativity with our unique visuals
Free with trial A visual representation of data showing a decline over a period. The blue bars are arranged in descending order of height, each marked with numerical indicators, suggesting a decrease in value or quantity. Decrease reduction illustrations Blue bar chart showing decreasing trend over time with numerical labels. A visual representation of data showing a decline over a period. The blue bars are arranged in descending order of height, each marked with numerical indicators, suggesting a decrease in value or quantity
Free with trial A stack of black oil barrels is shown with a prominent red arrow pointing downwards, symbolizing a decrease in oil prices. Decrease reduction illustrations Oil price decline illustrated by stacked barrels and red downward arrow. A stack of black oil barrels is shown with a prominent red arrow pointing downwards, symbolizing a decrease in oil prices
Free with trial AI helps manage carbon footprint by analyzing emission data, optimizing renewable energy use, and automating sustainable practices to reduce the overall carbon footprint. Latch. Decrease reduction illustrations AI-assisted carbon footprint reduction process Latch. AI helps manage carbon footprint by analyzing emission data, optimizing renewable energy use, and automating sustainable practices to reduce the overall carbon footprint. Latch
Free with trial A prominent minus sign icon, symbolizing decreasing values, zoom out actions, or removal. Ideal for quantity selectors, audio volume controls, or mapping applications. This bold and clear design provides immediate visual feedback for reduction or negative adjustments, enhancing user control and simplifying interactive elements in digital interfaces, vector design Generative AI. Decrease reduction vectors Large Minus Icon for Decreasing Value & Zoom Out, vector design Generative AI. A prominent minus sign icon, symbolizing decreasing values, zoom out actions, or removal. Ideal for quantity selectors, audio volume controls, or mapping applications. This bold and clear design provides immediate visual feedback for reduction or negative adjustments, enhancing user control and simplifying interactive elements in digital interfaces, vector design Generative AI
Free with trial Data analysis graphs with up and down arrow line icons set. Increase and reduction of economy or trend charts, price boost, stock market research thin black and red outline symbols vector illustration. Decrease reduction vectors Data analysis graphs with up and down arrow, economy or trend charts line icons set. Data analysis graphs with up and down arrow line icons set. Increase and reduction of economy or trend charts, price boost, stock market research thin black and red outline symbols vector illustration
Free with trial CO2 inside cloud shape with blue downward arrows indicating reduction, next to bar chart and small cloud. Ideal for sustainability, environment, data, carbon reduction, climate change, eco-friendly. Decrease reduction vectors Reducing Carbon Emissions with Data Analysis Highlighted by Cloud Imagery and Downward Arrows. CO2 inside cloud shape with blue downward arrows indicating reduction, next to bar chart and small cloud. Ideal for sustainability, environment, data, carbon reduction, climate change, eco-friendly
Free with trial Increase and reduction of economy or trend charts, price boost, stock market research thin black outline symbols vector illustration. Data analysis graphs with up and down arrow line icons set. Decrease reduction vectors Data analysis graphs with up and down arrow, economy or trend charts line icons set. Increase and reduction of economy or trend charts, price boost, stock market research thin black outline symbols vector illustration. Data analysis graphs with up and down arrow line icons set.
Free with trial A bright red arrow with a hand-drawn texture curves downwards. This graphic element effectively visualizes concepts of falling prices, negative trends, or a downward trajectory. Decrease reduction illustrations Red downward curved arrow symbol hand drawn style showing decline or decrease. A bright red arrow with a hand-drawn texture curves downwards. This graphic element effectively visualizes concepts of falling prices, negative trends, or a downward trajectory
Free with trial A 10% portion, often represented as a decimal, fraction, or percentage, is a fundamental concept in various fields. Whether calculating savings, understanding ratios, or simply dividing something into tenths, this fraction holds significant importance. This visual representation explores the practical application of a 10% reduction or increase, showing its impact on various quantities. From. Decrease reduction illustrations Understanding the Impact of a 10 Portion Savings Ratios and Fractions Explained. A 10% portion, often represented as a decimal, fraction, or percentage, is a fundamental concept in various fields. Whether calculating savings, understanding ratios, or simply dividing something into tenths, this fraction holds significant importance. This visual representation explores the practical application of a 10% reduction or increase, showing its impact on various quantities. From
Free with trial A golden magnifying glass is centered on a vibrant green background. Inside the lens, a white cloud symbol displays "CO2" and three white downward-pointing arrows, suggesting a reduction or emission of carbon dioxide. Decrease reduction illustrations Magnifying glass over C O2 cloud with downward arrows. A golden magnifying glass is centered on a vibrant green background. Inside the lens, a white cloud symbol displays "CO2" and three white downward-pointing arrows, suggesting a reduction or emission of carbon dioxide
Free with trial White House with Red Downward Arrow, Suggesting Decline or Reduction For Social Media Post Size. Decrease reduction illustrations White House with Red Downward Arrow, Suggesting Decline or Reduction
Free with trial Three shiny golden dollar coins are depicted with three prominent red arrows pointing downwards, visually representing financial decline, economic loss, or a decrease in value. Decrease reduction illustrations Three golden dollar coins with downward red arrows, isolated on white background. Three shiny golden dollar coins are depicted with three prominent red arrows pointing downwards, visually representing financial decline, economic loss, or a decrease in value
Free with trial A stylized magnifying glass with a zoom out slider and a cursor, suggesting search, adjustment, or reduction of scope in a digital interface. Decrease reduction vectors Magnifying glass with zoom out slider and cursor indicating search or adjustment. A stylized magnifying glass with a zoom out slider and a cursor, suggesting search, adjustment, or reduction of scope in a digital interface
Free with trial A glossy green downward-pointing arrow stands beside a standard cardboard shipping box, visually communicating a reduction in price or a special sale event. Decrease reduction illustrations Green downward arrow next to cardboard shipping box signaling price drop or sale. A glossy green downward-pointing arrow stands beside a standard cardboard shipping box, visually communicating a reduction in price or a special sale event
Free with trial A character runs while holding a significant red downward arrow, representing a decrease or decline concept clearly against a white background. Decrease reduction illustrations Character Holds Large Red Downward Arrow Symbolizing Decline on a White Background. A character runs while holding a significant red downward arrow, representing a decrease or decline concept clearly against a white background
Free with trial Person holding checklist and tablet with a clock icon, next to a dollar sign and downward arrow. Ideal for financial management, time efficiency, budget planning, productivity, cost reduction. Decrease reduction illustrations Businessperson Analyzing Checklist and Tablet as Costs Decrease Indicated by Downward Dollar Arrow. Person holding checklist and tablet with a clock icon, next to a dollar sign and downward arrow. Ideal for financial management, time efficiency, budget planning, productivity, cost reduction
Free with trial Factory emitting smoke with arrow pointing down, representing environmental concerns. Ideal for sustainability, emission control, climate action, eco-awareness, green industry, policy-making, simple. Decrease reduction illustrations Factory Emissions with Downward Arrow Indicating Reduction of Pollution and Eco-Friendly Solutions. Factory emitting smoke with arrow pointing down, representing environmental concerns. Ideal for sustainability, emission control, climate action, eco-awareness, green industry, policy-making, simple
Free with trial A green dollar sign with a downward arrow surrounded by falling gold coins, indicating a decrease in value or a financial downturn. Decrease reduction illustrations Dollar sign with downward arrow and gold coins scattered on a white background with ia. A green dollar sign with a downward arrow surrounded by falling gold coins, indicating a decrease in value or a financial downturn.
Free with trial Visualize decreasing business performance with this striking image. A pink 3D bar chart graphically represents a decline in financial data, highlighting loss and reduction. The falling graph is juxtaposed with a healthy green plant in a pot, emphasizing the contrast between success and setbacks. Ideal for illustrating economic concepts, investment challenges, or business performance issues, Created AI. Decrease reduction illustrations Decreasing business performance represented by pink graphic and potted green plant. Visualize decreasing business performance with this striking image. A pink 3D bar chart graphically represents a decline in financial data, highlighting loss and reduction. The falling graph is juxtaposed with a healthy green plant in a pot, emphasizing the contrast between success and setbacks. Ideal for illustrating economic concepts, investment challenges, or business performance issues, Created AI
Free with trial A bold, solid blue arrow points downwards, indicating a decrease or decline. To the right of the arrow, a vibrant pink circular icon features a white percentage sign. The entire graphic is isolated on a plain white background, commonly used to represent concepts like sales, discounts, or negative trends. Decrease reduction illustrations Blue Downward Arrow with Pink Percentage Sign Icon on White Background image photo. A bold, solid blue arrow points downwards, indicating a decrease or decline. To the right of the arrow, a vibrant pink circular icon features a white percentage sign. The entire graphic is isolated on a plain white background, commonly used to represent concepts like sales, discounts, or negative trends
Free with trial Green arrow pointing down, a direction indicator. Curved shape, symbol sign, 3d rendering. Represents decline, reduction, or a downward trend. 161. Decrease reduction vectors Green arrow pointing down, curved shape, direction indicator, symbol sign, 3d rendering. Green arrow pointing down, a direction indicator. Curved shape, symbol sign, 3d rendering. Represents decline, reduction, or a downward trend. 161
Free with trial A character stands isolated on a white background, holding a large red arrow pointing downward, symbolizing decline or decrease. Decrease reduction illustrations Character Holding a Large Red Downward Arrow Representing Decline on a White Background. A character stands isolated on a white background, holding a large red arrow pointing downward, symbolizing decline or decrease
Free with trial AI helps manage carbon footprint by analyzing emission data, optimizing renewable energy use, and automating sustainable practices to reduce the overall carbon footprint. Vouch. Decrease reduction illustrations AI-assisted carbon footprint reduction process Vouch. AI helps manage carbon footprint by analyzing emission data, optimizing renewable energy use, and automating sustainable practices to reduce the overall carbon footprint. Vouch
Free with trial AI helps manage carbon footprint by analyzing emission data, optimizing renewable energy use, and automating sustainable practices to reduce the overall carbon footprint. Vouch. Decrease reduction illustrations AI-assisted carbon footprint reduction process Vouch. AI helps manage carbon footprint by analyzing emission data, optimizing renewable energy use, and automating sustainable practices to reduce the overall carbon footprint. Vouch
Free with trial AI helps manage carbon footprint by analyzing emission data, optimizing renewable energy use, and automating sustainable practices to reduce the overall carbon footprint. Vouch. Decrease reduction illustrations AI-assisted carbon footprint reduction process Vouch. AI helps manage carbon footprint by analyzing emission data, optimizing renewable energy use, and automating sustainable practices to reduce the overall carbon footprint. Vouch
Free with trial AI helps manage carbon footprint by analyzing emission data, optimizing renewable energy use, and automating sustainable practices to reduce the overall carbon footprint. Vouch. Decrease reduction illustrations AI-assisted carbon footprint reduction process Vouch. AI helps manage carbon footprint by analyzing emission data, optimizing renewable energy use, and automating sustainable practices to reduce the overall carbon footprint. Vouch
Free with trial Financial taxation system graphic showing tax increase and decrease options with percentage coin element for economic policy planning and analysis. Decrease reduction illustrations Tax management concept icon with percentage symbol and directional green arrows on blue background. Financial taxation system graphic showing tax increase and. Financial taxation system graphic showing tax increase and decrease options with percentage coin element for economic policy planning and analysis
Free with trial Expenses management woman. Girl holding smartphone with gold coins on screen. Budgeting and accounting. Financial literacy and cost reduction. Flat vector illustration isolated on white background. Decrease reduction vectors Expenses management woman. Girl holding smartphone with gold coins on screen. Budgeting and accounting. Financial
Free with trial A hand delicately holds a white CO2 symbol with a downward-pointing arrow, symbolizing reduced carbon emissions. The blurred, pastel background creates a hopeful and environmentally conscious atmosphere. Decrease reduction illustrations Hand holding a CO2 symbol with an arrow pointing down, suggesting a decrease in emissions. A hand delicately holds a white CO2 symbol with a downward-pointing arrow, symbolizing reduced carbon emissions. The blurred, pastel background creates a hopeful and environmentally conscious atmosphere
Free with trial Two flat design icons, one red and one blue, showcasing a dollar sign within a circle with an arrow pointing downwards, signifying a decrease in value. Decrease reduction vectors Dollar Down Symbol Round Icons Displaying in Red and Blue with Long Shadow. Decreasing Dollar Value. Two flat design icons, one red and one blue, showcasing a dollar sign within a circle with an arrow pointing downwards, signifying a decrease in value.
Free with trial A minus or hyphen sign composed of lush green grass isolated on a white background, representing reduction, simplicity, and negative space in sustainable practices. 3D render illustration. Decrease reduction illustrations A minus or hyphen sign composed of lush green grass isolated on a white background
Free with trial Composite trend artwork sketch image collage of business arrow down bankruptcy loss money coins young guy walk down recession reduction. Decrease reduction illustrations Composite trend artwork sketch image collage of business arrow down bankruptcy loss money coins young guy walk down
Free with trial Percentage symbol in circle with arrow up and arrow down icons represents financial growth and decrease. Decrease reduction vectors Percentage symbol in circle with arrow up and arrow down icons represents financial growth and decrease
Free with trial A single, glossy green arrow points directly downwards. The arrow has a smooth, rounded appearance and a reflective surface, suggesting a 3D rendered object. It is presented in isolation on a clean white background, making it a clear and prominent visual element. This icon commonly represents a decrease, download, or negative direction. Decrease reduction illustrations Glossy Green Downward Arrow Icon on a White Background image photo. A single, glossy green arrow points directly downwards. The arrow has a smooth, rounded appearance and a reflective surface, suggesting a 3D rendered object. It is presented in isolation on a clean white background, making it a clear and prominent visual element. This icon commonly represents a decrease, download, or negative direction
Free with trial A character is gripping a large red arrow pointing downward, representing a decrease or decline in values, set against a clean white background. Decrease reduction illustrations Character Holding a Large Red Downward Arrow Symbolizes Decline Against a Simple White Background. A character is gripping a large red arrow pointing downward, representing a decrease or decline in values, set against a clean white background
Free with trial A character stands alone, holding a large red arrow pointing downward, symbolizing a decline or decrease, set against a plain white backdrop. Decrease reduction illustrations Character Holding a Large Red Downward Arrow Indicating Decline on a White Background. A character stands alone, holding a large red arrow pointing downward, symbolizing a decline or decrease, set against a plain white backdrop