Free with trial A character stands isolated and holds a large red downward arrow, representing a decrease in values or metrics. Decrease reduction illustrations Character Holding a Large Red Downward Arrow Symbolizing Decline on a White Background. A character stands isolated and holds a large red downward arrow, representing a decrease in values or metrics
Free with trial Red bent arrow. Round return 3d symbol isolated on white background. Decrease reduction vectors Red bent arrow. Round return 3d symbol
Free with trial Isolated orange basketballs are stacked in descending vertical columns. 3D Rendering. Decrease reduction illustrations Isolated orange basketballs are stacked in descending vertical columns. 3D Rendering.
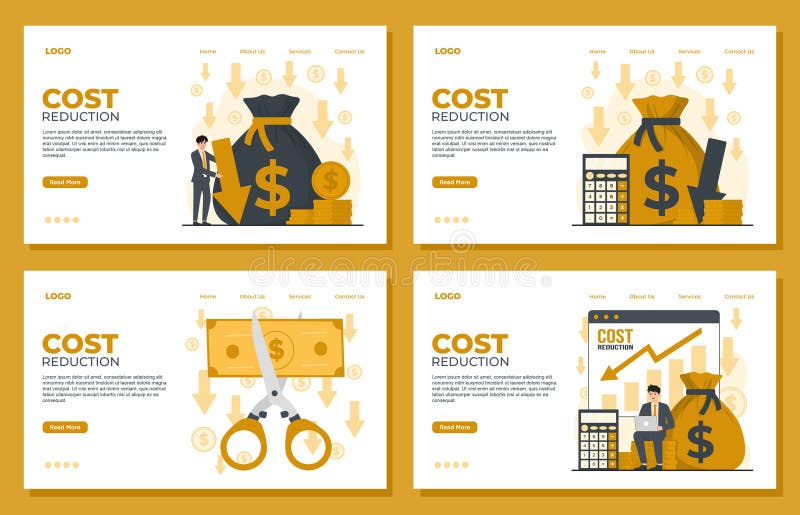
Free with trial Discover a diverse collection of flat illustration concept vectors, perfect for enhancing your design projects. Explore creativity with our unique visuals. Decrease reduction vectors Cost reduction landing page template Flat vector illustration web page design costs cut, costs optimization concept. Discover a diverse collection of flat illustration concept vectors, perfect for enhancing your design projects. Explore creativity with our unique visuals
Free with trial Poster sketch image artwork 3D photo collage of worker hr profession business young lady loss money pile coins arrow down reduction crisis. Decrease reduction illustrations Poster sketch image artwork 3D photo collage of worker hr profession business young lady loss money pile coins arrow
Free with trial 3D Percentage commission icon. Decrease in interest rate, brokerage, low price, reduce cost, sale percent tax. Trendy and modern vector in 3d style. Decrease reduction vectors 3D Percentage commission icon. Decrease in interest rate, brokerage, low price, reduce cost, sale percent tax
Free with trial Dropping carbon emissions represented by a 3D graph, set against corporate buildings of the future. Corporate carbon reduction. Decrease reduction illustrations Dropping carbon emissions represented by a 3D graph, set against corporate buildings of the future. Corporate carbon
Free with trial Trend design 3D photo collage of two huge hand hold piece coin young man fall down inflation investor business budget reduction economy. Decrease reduction illustrations Trend design 3D photo collage of two huge hand hold piece coin young man fall down inflation investor business budget
Free with trial Creative collage young woman trader economy recession crisis bankruptcy golden coin dollar failure investing loss stocks downfall decrease. Decrease reduction illustrations Creative collage young woman trader economy recession crisis bankruptcy golden coin dollar failure investing loss stocks
Free with trial A golden 10 percent off sign on a white background indicates a discount and promotional offer for shoppers. This image represents savings, reduction, and special deals, signaling a price cut or markdown on products or services. It conveys a message of affordability and incentive to buy CREATED AI. Decrease reduction illustrations Golden 10 Percent Off Sign on White Background Indicating Discount and Promotional Offer for Shoppers. A golden 10 percent off sign on a white background indicates a discount and promotional offer for shoppers. This image represents savings, reduction, and special deals, signaling a price cut or markdown on products or services. It conveys a message of affordability and incentive to buy CREATED AI
Free with trial Clock With Arrows Line And Solid Icon Set. Time Management, Efficiency, And Productivity Symbol Collection. Directional Arrows Indicating Increase And Decrease. Isolated Vector Illustration. Decrease reduction vectors Clock With Arrows Line And Solid Icon Set. Time Management, Efficiency, And Productivity Symbol Collection. Directional
Free with trial A dark gray triangle with a horizontal double-headed arrow above it, symbolizing growth, reduction, or opposing forces. Decrease reduction illustrations Geometric diagram illustrating expansion or contraction with a central triangle and bidirectional arrows. A dark gray triangle with a horizontal double-headed arrow above it, symbolizing growth, reduction, or opposing forces
Free with trial Magnifying glass focuses on green moss with O2 formula on wooden surface with seedlings. Eco friendly energy, clean air sustainable development and carbon footprint reduction concept. Decrease reduction illustrations Magnifying glass focuses on green moss with O2 formula on wooden surface with seedlings. Eco friendly energy, clean air
Free with trial This image powerfully illustrates the concept of financial losses. A ceramic piggy bank, a common symbol of savings, is paired with a downward-trending graph, starkly highlighting the reduction in financial well-being. This visual representation speaks volumes about the impact of economic downturns, recessions, and investment risks. The image serves as a potent reminder of the potential for. Decrease reduction illustrations Financial Losses Depicted Piggy Bank with Downward Trend Graph A Visual Representation of Economic Setbacks. This image powerfully illustrates the concept of financial losses. A ceramic piggy bank, a common symbol of savings, is paired with a downward-trending graph, starkly highlighting the reduction in financial well-being. This visual representation speaks volumes about the impact of economic downturns, recessions, and investment risks. The image serves as a potent reminder of the potential for
Free with trial A 3D rendered icon featuring a bright blue, downward-pointing arrow. Attached to the upper right side of the arrow is a vibrant pink circle containing a white percentage symbol. The icon is isolated on a white background, symbolizing a decrease or discount. Decrease reduction illustrations 3D Rendered Blue Downward Arrow with Pink Percentage Symbol Icon on White Background Keywords: down arrow, percentage, percent. A 3D rendered icon featuring a bright blue, downward-pointing arrow. Attached to the upper right side of the arrow is a vibrant pink circle containing a white percentage symbol. The icon is isolated on a white background, symbolizing a decrease or discount
Free with trial A stylized blue cloud graphic features a yellow percentage symbol and a blue downward-pointing arrow, suggesting a decrease in price or a sale. Decrease reduction vectors Cloud icon with a percentage symbol and a downward arrow, isolated on transparent background cyber monday element. A stylized blue cloud graphic features a yellow percentage symbol and a blue downward-pointing arrow, suggesting a decrease in price or a sale
Free with trial A vibrant orange circle graphic depicting a green speech bubble with a downward arrow and a stack of money, symbolizing financial decrease and economic downturn. Decrease reduction vectors Vector art of orange circle graphic featuring a green speech bubble with a downward arrow and a stack of money with a coin. A vibrant orange circle graphic depicting a green speech bubble with a downward arrow and a stack of money, symbolizing financial decrease and economic downturn
Free with trial Discover innovative strategies for climate solutions, focusing on the power of trees for carbon sequestration and exploring bubble technology for atmospheric carbon reduction. This image highlights the intersection of nature and technology for a sustainable planet. Decrease reduction illustrations Exploring Climate Solutions Trees Bubbles and Innovative Carbon Reduction Strategies for a Sustainable Future. Discover innovative strategies for climate solutions, focusing on the power of trees for carbon sequestration and exploring bubble technology for atmospheric carbon reduction. This image highlights the intersection of nature and technology for a sustainable planet
Free with trial This infographic illustrates a crucial aspect of data analysis: recognizing and interpreting downward trends. The chart clearly displays a decreasing arrow, highlighting a negative slope and a reduction in value over time. Understanding these downward trends is critical in various fields, from finance and business to investment and market analysis. The visual representation aids in quickly. Decrease reduction illustrations Analyzing Downward Trends in Data A Comprehensive Guide to Understanding Decreasing Charts and Graphs in Business. This infographic illustrates a crucial aspect of data analysis: recognizing and interpreting downward trends. The chart clearly displays a decreasing arrow, highlighting a negative slope and a reduction in value over time. Understanding these downward trends is critical in various fields, from finance and business to investment and market analysis. The visual representation aids in quickly
Free with trial In a virtual space, a 3D graph displaying decreasing carbon emissions stands against modern corporate buildings. Corporate carbon reduction. Decrease reduction illustrations In a virtual space, a 3D graph displaying decreasing carbon emissions stands against modern corporate buildings
Free with trial Reduce carbon dioxide co2 icon web design logo set collection in flat vector. Decrease reduction vectors Environmental Reduce Carbon Dioxide CO2 Icon for Ecology and Sustainability Graphics Perfect for Representing Carbon Reduction and. Reduce carbon dioxide co2 icon web design logo set collection in flat vector
Free with trial Businessman holding dollar coin. A businesswoman sits on coins while holding a laptop, calculating declining office finances. Cost Reduction concept. trend modern vector flat illustration. Decrease reduction vectors Businessman holding dollar coin. A businesswoman sits on coins while holding a laptop, calculating declining office finances.
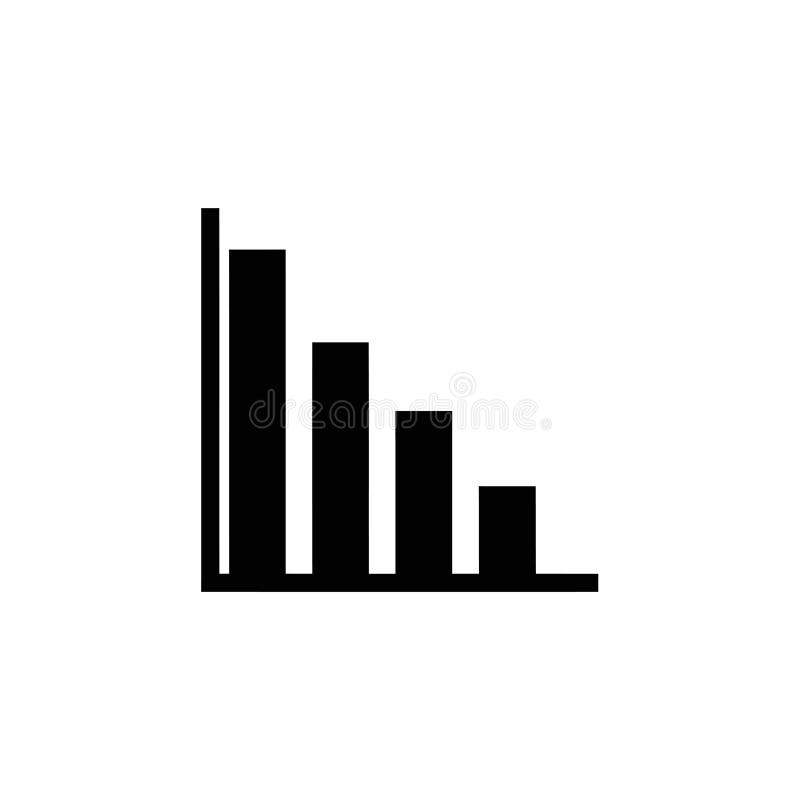
Free with trial This vector illustration depicts a descending bar graph, representing decline and negative trends. It is suitable for financial reports, business analysis, and presentations. Decrease reduction vectors Illustration of a descending bar graph, , representing decline, decrease, and negative trends in business or finance. This vector illustration depicts a descending bar graph, representing decline and negative trends. It is suitable for financial reports, business analysis, and presentations
Free with trial 3D graph in virtual space portrays dwindling carbon emissions over time against futuristic corporate buildings. Corporate carbon reduction. Decrease reduction illustrations 3D graph in virtual space portrays dwindling carbon emissions over time against futuristic corporate buildings
Free with trial Businessman analyzes office management. The performance concept improves quality, speed, and efficiency and reduces costs. Cost Reduction concept. trend modern vector flat illustration. Decrease reduction vectors Businessman analyzes office management. The performance concept improves quality, speed, and efficiency and reduces costs.
Free with trial Unleash your inner bargain hunter! This vibrant image showcases a product on a store shelf, adorned with a striking yellow sale tag. Bold black numbers prominently display a significant price reduction, highlighting the incredible savings available. The festive decorations surrounding the item further emphasize the promotional offer, creating a captivating visual that signals exceptional value. Decrease reduction illustrations Score a Steal Bright Yellow Sale Tag Marks Down Prices on Store Shelf Unbelievable Discounts Await BudgetConscious. Unleash your inner bargain hunter! This vibrant image showcases a product on a store shelf, adorned with a striking yellow sale tag. Bold black numbers prominently display a significant price reduction, highlighting the incredible savings available. The festive decorations surrounding the item further emphasize the promotional offer, creating a captivating visual that signals exceptional value
Free with trial Image is generated with the use of an AI. Decrease reduction illustrations Reduction net reusing green ai hold change concept recycle development sustainability climate sustainability social environmental. image is generated with the use of an AI
Free with trial Loss icon logo sign vector outline in black and white color. Decrease reduction vectors A bar chart icon with a downward trend, representing financial loss or decrease, often used in business or stock market contexts. loss icon logo sign vector outline in black and white color
Free with trial Small green plants grow in little boxes of brown wood on dark soil. Magnifying glass shows details of one plant. Eco-friendly energy production, carbon footprint reduction. Sustainable. Decrease reduction illustrations Small green plants grow in little boxes of brown wood on dark soil. Magnifying glass shows details of one plant. Eco-friendly
Free with trial Climate goal cube, CO2 emissions, sustainable future, strategy. created ai. Decrease reduction illustrations Climate Goal Cube: CO2 Emission Reduction Strategy - Target for Sustainable Future with Decreasing Graph on Wooden Blocks for. Climate goal cube, CO2 emissions, sustainable future, strategy. created ai
Free with trial CO2 emissions icon vector logo set collection for web app ui. Decrease reduction vectors CO2 emissions reduction to save environment from global warming icon. pollution of carbon dioxide emission or greenhouse gas in. CO2 emissions icon vector logo set collection for web app ui
Free with trial Red arrow graph indicates stock market decline, real estate downturn, financial loss. 3d illustration visualizes business concept of negative progress, sale reduction, profit decrease. Decrease reduction illustrations Red arrow graph indicates stock market decline, real estate downturn, financial loss. 3d illustration visualizes business concept
Free with trial Three red arrows pointing down with white percentage symbols signifying a drop in prices or economic decline isolated on transparent background. Decrease reduction vectors Three red downward pointing arrows with percentage symbols indicating a decrease in value or sales isolated on transparent. Three red arrows pointing down with white percentage symbols signifying a drop in prices or economic decline isolated on transparent background
Free with trial This bar graph visually represents a declining trend, effectively conveying data reduction and downward progression for analytical purposes and interpretation. Decrease reduction vectors Vector art of declining bar graph showing a downward trend in data representation and visualization for statistical analysis. This bar graph visually represents a declining trend, effectively conveying data reduction and downward progression for analytical purposes and interpretation
Free with trial This image features red and green arrows pointing downwards, symbolizing a decline or negative trend in markets, finance, or business. It represents loss and reduction. Decrease reduction vectors Vector art of a visual representation of downward trends with red and green arrows indicating decline isolated on white background. This image features red and green arrows pointing downwards, symbolizing a decline or negative trend in markets, finance, or business. It represents loss and reduction
Free with trial Cartoon Gesture Icon Mockup. Flat 3d isometric businessman hand turn cost dial to low position. Cost reduction management concept. 3D rendering on white background. Decrease reduction vectors Cartoon Gesture Icon Mockup.Flat 3d isometric businessman hand turn cost dial to low position.
Free with trial The image features a recycling symbol with various natural scenes such as forests, rivers, and mountains inside its segments. Accompanying the recycling symbol are two bar graphs. The first graph illustrates the reduction in carbon emissions over several years, showing a significant decrease from 70% in 1990 to 30% in 2020. The second graph depicts the increase in recycled materials over the same. Decrease reduction illustrations Environmental impact of recycling. The image features a recycling symbol with various natural scenes such as forests, rivers, and mountains inside its segments. Accompanying the recycling symbol are two bar graphs. The first graph illustrates the reduction in carbon emissions over several years, showing a significant decrease from 70% in 1990 to 30% in 2020. The second graph depicts the increase in recycled materials over the same
Free with trial Transparent Backgrounds Mock-up. Flat 3d isometric businessman hand turn cost dial to low position. Cost reduction management concept. Supports PNG files with transparent backgrounds. Decrease reduction vectors Transparent Backgrounds Mock-up.Flat 3d isometric businessman hand turn cost dial to low position.
Free with trial Transparent Backgrounds Mock-up. Flat 3d isometric businessman hand turn cost dial to low position. Cost reduction management concept. Supports PNG files with transparent backgrounds. Decrease reduction vectors Transparent Backgrounds Mock-up.Flat 3d isometric businessman hand turn cost dial to low position.
Free with trial Transparent Backgrounds Mock-up. Flat 3d isometric businessman hand turn cost dial to low position. Cost reduction management concept. Supports PNG files with transparent backgrounds. Decrease reduction vectors Transparent Backgrounds Mock-up.Flat 3d isometric businessman hand turn cost dial to low position.
Free with trial Transparent Backgrounds Mock-up. Flat 3d isometric businessman hand turn cost dial to low position. Cost reduction management concept. Supports PNG files with transparent backgrounds. Decrease reduction vectors Transparent Backgrounds Mock-up.Flat 3d isometric businessman hand turn cost dial to low position.
Free with trial Roadmap To Carbon Neutral With Sustainable Energy Ecosystem. Carbon Neutral Concept. Decrease reduction vectors Roadmap To Carbon Neutral With Sustainable Ecosystem. Roadmap To Carbon Neutral With Sustainable Energy Ecosystem. Carbon Neutral Concept
Free with trial Sustainable Industrial with Renewable Energy and Carbon Neutral Transition. Carbon Neutral and Sustainability Strategy Concept. Decrease reduction vectors Sustainable Industrial with Carbon Neutral Transition. Sustainable Industrial with Renewable Energy and Carbon Neutral Transition. Carbon Neutral and Sustainability Strategy Concept
Free with trial Isometric Carbon Neutral Industry with Sustainable Factory and Renewable Energy. Carbon Neutral and Sustainability Strategy Concept. Decrease reduction vectors Isometric Carbon Neutral Industry with Sustainable Factory
Free with trial Isometric Sustainable City Plan And Carbon Neutral Strategy. Carbon Neutral And Sustainability Strategy Concept. Decrease reduction vectors Isometric Sustainable City Plan And Carbon Neutral Strategy
Free with trial Gold bar on white background. Isolated 3D illustration. Decrease reduction illustrations Gold bar on white background. Isolated 3D illustration
Free with trial Isometric Sustainable Industrial with Renewable Energy and Carbon Neutral Transition. Carbon Neutral and Sustainability Strategy Concept. Decrease reduction vectors Isometric Sustainable Industrial and Carbon Neutral Transition. Isometric Sustainable Industrial with Renewable Energy and Carbon Neutral Transition. Carbon Neutral and Sustainability Strategy Concept
Free with trial Isometric Roadmap To Carbon Neutral With Sustainable Energy Ecosystem. Carbon Neutral Concept. Decrease reduction vectors Isometric Roadmap To Carbon Neutral With Sustainable Ecosystem. Isometric Roadmap To Carbon Neutral With Sustainable Energy Ecosystem. Carbon Neutral Concept
Free with trial Discount program. Consumer benefit, offers and sales, individual customer discounts, interest rate changes and money management, coins percent sign, vector cartoon flat style isolated finance concept. Decrease reduction vectors Discount program. Consumer benefit, offers and sales, individual customer discounts, interest rate changes and money management
Free with trial Carbon Neutral Industry with Sustainable Factory and Renewable Energy. Carbon Neutral and Sustainability Strategy Concept. Decrease reduction vectors Carbon Neutral Industry with Sustainable Factory and Renewable Energy
Free with trial Financial market crash and economic decline downward arrows on digital blue dashboard with global statistics investment loss stock price reduction in global trade. Decrease reduction vectors Financial market crash and economic decline downward arrows on digital blue dashboard with global statistics investment loss stock
Free with trial Black steel oil drum on white background. Isolated 3D illustration. Decrease reduction illustrations Black steel oil drum on white background. Isolated 3D illustration
Free with trial Decline symbol. Red 3d arrow down icon isolated on white background. Decrease reduction vectors Decline symbol. Red 3d arrow down icon
Free with trial Black steel oil drum and gold coins on white background. Isolated 3D illustration. Decrease reduction illustrations Black steel oil drum and gold coins on white background. Isolated 3D illustration
Free with trial Burning cartoon candle. Wax candles with fire flame, step by step burn and melts. Medieval lighting, atmosphere home decorations. Extinguished candle sapid vector set original artwork. Decrease reduction vectors Burning cartoon candle. Wax candles with fire flame, step by step burn and melts. Medieval lighting, atmosphere home decorations
Free with trial Icons in two colors about co2 emissions. Contains such icons as tree planting, net zero, and reduced carbon dioxide. Editable stroke. Decrease reduction vectors Icons in two colors about co2 emissions
Free with trial Leave debd behind you traffic sign on blue sky background. Decrease reduction illustrations Leave debd behind you traffic sign on blue sky
Free with trial Red arrow falls on dark striped background to symbolize a global economic recession and financial market crash a period of high inflation and corporate failure. Decrease reduction vectors Red downward arrow on striped background representing financial crisis and economic recession. red arrow falls on dark striped background to symbolize a global economic recession and financial market crash a period of high inflation and corporate failure
Free with trial 3d economic crisis bar graph chart with red arrow going down bankruptcy financial stock market crash downtrend symbol chart going down sign on green blue mint pastel color background 3D rendering. Decrease reduction illustrations 3d economic crisis bar graph chart with red arrow going down bankruptcy financial stock market crash downtrend symbol chart going
Free with trial Two drop and growth technology icon with gear. outline simple trend stats logotype graphic stroke art web design isolated on white. concept of key performance indicator or operation strategy symbol. Decrease reduction vectors Two drop and growth technology icon with gear
Free with trial Outline down chart icon isolated. Flat style design vector illustration on white background. Decrease reduction vectors Outline down chart icon isolated. Flat style design vector illustration on white background
Free with trial Consumer punching a percent symbol with arrow going up: rising prices and inflation concept. Decrease reduction vectors Angry woman fighting rising prices. Consumer punching a percent symbol with arrow going up: rising prices and inflation concept
Free with trial Law of diminishing returns. E. g. if you continually increase the amount of work on a constant arable land, the soil yield increases quickly, slows down, shortly remains the same, and decreases again. Decrease reduction vectors Law of diminishing returns, curve of output against input. Law of diminishing returns. E.g. if you continually increase the amount of work on a constant arable land, the soil yield increases quickly, slows down, shortly remains the same, and decreases again.
Free with trial Decline graph line outline icon isolated on white. Vector illustration. Decrease reduction vectors Decline graph line outline icon
Free with trial Greenhouse effect line outline icon isolated on white. Vector illustration. Decrease reduction vectors Greenhouse effect line outline icon
Free with trial Business graph showing falling trend with arrow for recession and financial loss. Decrease reduction vectors Business crisis chart with falling arrow. Business graph showing falling trend with arrow for recession and financial loss
Free with trial 3D Isometric Flat Vector Illustration of Increase Interest Rates, Percent Up. Decrease reduction vectors 3D Isometric Flat Vector Illustration of Increase Interest Rates
Free with trial Co2 neutral emission net zero icon design vector. Decrease reduction vectors Co2 neutral emission net zero icon design
Free with trial Financial bar chart with downward arrow indicating crisis and market collapse. Decrease reduction vectors Financial bar chart with downward arrow indicating crisis
Free with trial Co2 carbon neutral concept background design vector. Decrease reduction vectors Co2 carbon neutral concept background design
Free with trial Bankruptcy and financial loss concept with red declining arrow on white. Decrease reduction vectors Bankruptcy and financial loss concept with red declining arrow
Free with trial A sad and dejected character slides down a large percentage symbol, representing financial loss, declining interest rates, or a negative business discount. Decrease reduction illustrations Financial Decline and Interest Rate Drop Business Concept. A sad and dejected character slides down a large percentage symbol, representing financial loss, declining interest rates, or a negative business discount
Free with trial Carbon credit icon set. It included pollution, emission, smoke, air quality, net zero and more icons. Decrease reduction vectors Carbon credit icon set. It included pollution, emission, smoke, air quality, net zero and more icons.
Free with trial Man and woman marketing analysts stand near graph analyzing number of clicks from contextual advertising. Two analysts are working on launching promotion to attract visitors to website. Decrease reduction vectors Man and woman marketing analysts stand near graph analyzing number of clicks from contextual ads. Man and woman marketing analysts stand near graph analyzing number of clicks from contextual advertising. Two analysts are working on launching promotion to attract visitors to website.
Free with trial Net zero carbon neutral ecology concept label design vector. Decrease reduction vectors Net zero carbon neutral ecology concept label design
Free with trial Relieve word block on white background. Decrease reduction illustrations Relieve word block on white
Free with trial Logo Design For Reduce Plastic Waste for your brand. Decrease reduction vectors Logo Design For Reduce Plastic Waste
Free with trial Minimal symbols representing minus, stop, and block concepts in a red and white geometric paper cut style with negative space for a modern visual communication design. Decrease reduction illustrations Minus control symbols paper cut style design. Minimal symbols representing minus, stop, and block concepts in a red and white geometric paper cut style with negative space for a modern visual communication design
Free with trial Business recession diagram with falling bars and downward arrow indicating economic decline and bankruptcy. Decrease reduction vectors Economic crisis concept illustration with negative trend graph and bankruptcy symbol. Business recession diagram with falling bars and downward arrow indicating economic decline and bankruptcy
Free with trial Price Drop Icon. A flat illustration featuring a gold dollar coin with three red arrows pointing down. Decrease reduction vectors Price Drop Icon