Free with trial The image features declining business graphs illustrated with pie charts and falling arrow indicators, representing financial analysis and reports on downward trends, decreases in performance metrics, and economic risks. It effectively visualizes key data related to investment and marketing losses. This representation has been created using AI. Decrease statistics vectors Declining Business Graphs Falling Arrow Chart and Pie Chart for Financial Analysis and Reports. The image features declining business graphs illustrated with pie charts and falling arrow indicators, representing financial analysis and reports on downward trends, decreases in performance metrics, and economic risks. It effectively visualizes key data related to investment and marketing losses. This representation has been created using AI.
Free with trial Wooden blocks arranged in descending steps with red arrow indicating a decline on red backdrop. Decrease statistics illustrations Wooden blocks arranged in descending steps with red arrow indicating a decline on red backdrop
Free with trial Abstract illustration showing a downward trend arrow, suitable for depicting loss, decline, or reduction. Decrease statistics vectors Downward Trend Arrow Illustration: Financial Loss, Market Decline, or Data Reduction. Abstract illustration showing a downward trend arrow, suitable for depicting loss, decline, or reduction.
Free with trial A collection of minimalist vector icons representing gradient bar charts with upward and downward trends. The icons use red and blue colors to indicate increasing and decreasing trends. These icons are suitable for financial reports, business presentations, analytics dashboards, and data visualization projects. The clean design features smooth gradients and modern styles, perfect for professional. Decrease statistics illustrations Gradient bar chart icon set with increasing and decreasing trends in red and blue colors. A collection of minimalist vector icons representing gradient bar. A collection of minimalist vector icons representing gradient bar charts with upward and downward trends. The icons use red and blue colors to indicate increasing and decreasing trends. These icons are suitable for financial reports, business presentations, analytics dashboards, and data visualization projects. The clean design features smooth gradients and modern styles, perfect for professional
Free with trial Interest rate changes on timber cubes. Green arrow up and red arrow down symbols. Finance concept for investment growth and decline. Business metaphor icons. Decrease statistics illustrations Wooden blocks with percentage sign and arrows represent financial market fluctuation. Interest rate changes on timber cubes. Green arrow up and red arrow down symbols. Finance concept for investment growth and decline. Business metaphor icons
Free with trial A white rectangular featuring a bar chart with blue and gray bars and a line graph with blue and gray lines. Upward and downward arrows with horizontal bars are positioned to the right of the. Decrease statistics illustrations Blue and gray bar chart with upward and downward arrows on a white background line graph. A white rectangular featuring a bar chart with blue and gray bars and a line graph with blue and gray lines. Upward and downward arrows with horizontal bars are positioned to the right of the
Free with trial Minimalist bar chart created with natural wooden blocks, symbolizing data, financial trends, market fluctuations, and business analysis on a white surface. Decrease statistics illustrations Wooden blocks bar chart illustrating business data progression on a white background. Minimalist bar chart created with natural wooden blocks, symbolizing data, financial trends, market fluctuations, and business analysis on a white surface.
Free with trial The a hand with a ring on the ring finger interacting with a digital dashboard displayed on a smartphone, tablet, and laptop screen. The dashboard various analytics charts including bar graphs, line graphs, and pie charts. The data metrics include percentages, numbers, and performance indicators. The screens are set against a dark, blurred background with a glowing, futuristic interface. The color. Decrease statistics illustrations Hand interacting with digital dashboard displaying analytics charts and data metrics. The a hand with a ring on the ring finger interacting with a digital dashboard displayed on a smartphone, tablet, and laptop screen. The dashboard various analytics charts including bar graphs, line graphs, and pie charts. The data metrics include percentages, numbers, and performance indicators. The screens are set against a dark, blurred background with a glowing, futuristic interface. The color
Free with trial Man in a beige shirt and jeans holding a paper with charts, isolated yellow background. AI-generated. Decrease statistics illustrations Hands holding a paper with financial business charts, yellow background. Man in a beige shirt and jeans holding a paper with charts, isolated yellow background. AI-generated
Free with trial This image is a line graph with a shaded area underneath the line. The x-axis is labeled 'Time' and the y-axis is labeled 'Value'. The data points show an overall upward trend with some fluctuations. The shaded area under the line is filled with a light purple color, and the line itself is a darker purple. Decrease statistics illustrations A graph displaying the upward trend of data points over a period of time with a shaded area. This image is a line graph with a shaded area underneath the line. The x-axis is labeled 'Time' and the y-axis is labeled 'Value'. The data points show an overall upward trend with some fluctuations. The shaded area under the line is filled with a light purple color, and the line itself is a darker purple
Free with trial Global Economic Downturn with Falling Graph and Red Arrow, Financial Recession Concept, illustration. Decrease statistics vectors Global Economic Downturn with Falling Graph and Red Arrow, Financial Recession Concept
Free with trial Downward Trend Bar Chart Illustration Indicating Decline Or Loss In Business Performance. Decrease statistics illustrations Downward Trend Bar Chart Illustration Indicating Decline Or Loss In Business Performance
Free with trial A simple line drawing illustration depicting a graph that features a prominent arrow pointing directly downward, indicating a downward trend or movement. Decrease statistics vectors A line drawing illustrating a graph with an arrow downward. A simple line drawing illustration depicting a graph that features a prominent arrow pointing directly downward, indicating a downward trend or movement
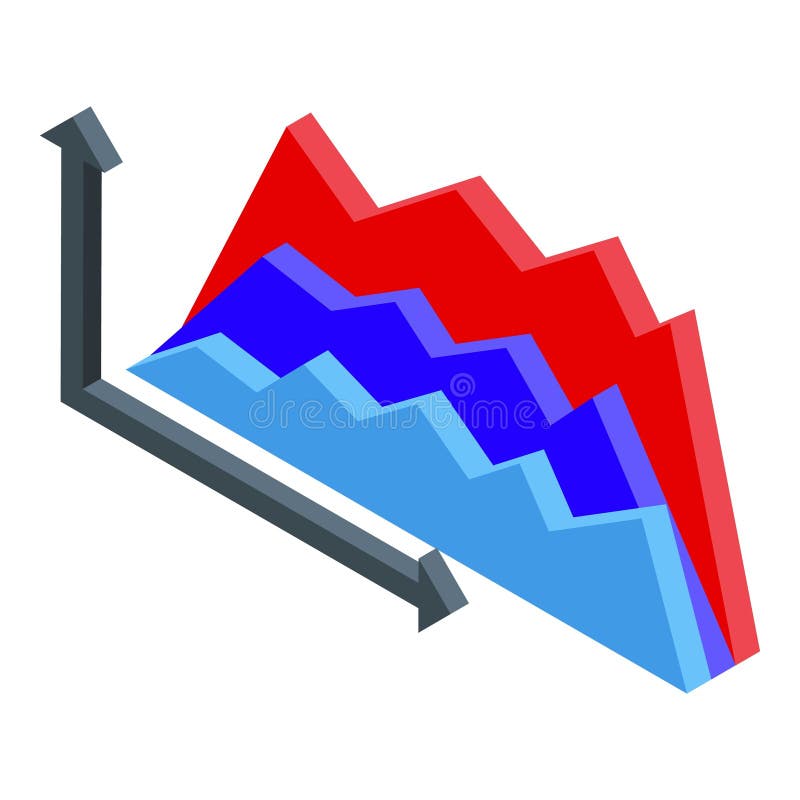
Free with trial Isometric graph showing different trends with ups and downs, concept of trading and business analysis. Decrease statistics illustrations Isometric graph showing different trends with ups and downs
Free with trial Businessman Struggling with Falling Profits and Financial Crisis, Business Loss Concept, illustration. Decrease statistics illustrations Businessman Struggling with Falling Profits and Financial Crisis, Business Loss Concept
Free with trial Line art icon representing financial audit and data analysis of a declining business report. Decrease statistics vectors Line art icon representing financial audit and data analysis of a declining business report
Free with trial Simple black bar chart with two bars of different heights on a white background graph. Decrease statistics illustrations Simple black bar chart with two bars of different heights on a white background graph
Free with trial A black bar graph icon illustrating a downward trend with a down arrow on a white background. Decrease statistics illustrations Black bar graph icon showing a downward trend with an arrow on white background chart. A black bar graph icon illustrating a downward trend with a down arrow on a white background
Free with trial Black icon showing a declining graph with a falling arrow and ice cube. Clear details and vibrant colors enhan. Decrease statistics illustrations Black icon of a downward trending graph with a falling arrow and ice cube chart decline. Black icon showing a declining graph with a falling arrow and ice cube. Clear details and vibrant colors enhan
Free with trial Black silhouette graph depicting a downward trend with the text "Early Accumulation Zone" below. Decrease statistics illustrations Black Silhouette Graph Showing Downward Trend with Text Early Accumulation Zone chart. Black silhouette graph depicting a downward trend with the text "Early Accumulation Zone" below
Free with trial A white bar graph icon with a metallic silver rim is presented within a black circle on a dark gray background. Decrease statistics illustrations White bar graph icon with metallic rim inside a black circle on a dark background chart. A white bar graph icon with a metallic silver rim is presented within a black circle on a dark gray background
Free with trial A line graph with a blue arrow pointing downwards, indicating a decline in value over time. the graph has a white background and features a series of colored sections, gradating from blue to green to yellow. Decrease statistics illustrations A graph showing a downward trend over time with a blue arrow isolated on white background. a line graph with a blue arrow pointing downwards, indicating a decline in value over time. the graph has a white background and features a series of colored sections, gradating from blue to green to yellow
Free with trial A 3D rendered illustration showing a bar graph with bars decreasing in height, symbolizing a decline. Above the graph, a prominent red triangle with a white exclamation mark signifies a warning or alert. The background is a soft peach color, and the overall composition conveys a sense of financial or economic concern. Decrease statistics illustrations 3D Illustration of a Falling Bar Graph with a Red Exclamation Mark Warning Symbol chart. A 3D rendered illustration showing a bar graph with bars decreasing in height, symbolizing a decline. Above the graph, a prominent red triangle with a white exclamation mark signifies a warning or alert. The background is a soft peach color, and the overall composition conveys a sense of financial or economic concern
Free with trial Black and white business and finance icons on white background. Decrease statistics vectors Collection of various business and finance related icons and symbols on white background. Black and white business and finance icons on white background
Free with trial Red 3D bar graph a downward trend with a red arrow indicating decline. graph, chart, bar. red bar graph with downward trending. Decrease statistics vectors Red bar graph with downward trending arrow isolated on a transparent background chart. Red 3D bar graph a downward trend with a red arrow indicating decline. graph, chart, bar. red bar graph with downward trending
Free with trial Wooden blocks spelling TAX with green downward arrows, placed against a light green minimalist background. Concept of tax reduction. 3D Rendering. Decrease statistics illustrations Wooden cubes spelling TAX with green arrows pointing down, illustrating tax reduction, on a minimal light green background. 3D. Wooden blocks spelling TAX with green downward arrows, placed against a light green minimalist background. Concept of tax reduction. 3D Rendering
Free with trial Line chart decreae icon linear vector graphics sign or symbol set for web app ui. Decrease statistics vectors Line chart decreae icon Flat line illustration. Line chart decreae icon linear vector graphics sign or symbol set for web app ui
Free with trial Line Graph Chart Line And Solid Icon Set. Data Analysis, Trend Visualization, And Business Growth Symbol Collection. Statistical Representation And Performance Tracking. Isolated Vector Illustration. Decrease statistics vectors Line Graph Chart Line And Solid Icon Set. Data Analysis, Trend Visualization, And Business Growth Symbol Collection
Free with trial The image depicts a bar chart with a descending red arrow overlay, illustrating a significant decline in values. The bars transition from tall blue to shorter purple, symbolizing a downward trend in metrics such as sales, performance, or growth over time. Decrease statistics illustrations Graphic representation of declining performance or downward trend in bar chart format. The image depicts a bar chart with a descending red arrow overlay, illustrating a significant decline in values. The bars transition from tall blue to shorter purple, symbolizing a downward trend in metrics such as sales, performance, or growth over time
Free with trial Concept illustrating economic downturn. The image shows wooden blocks that spell out economy, partially collapsed and a red arrow pointing downwards, against a neutral backdrop. It conveys crisis, recession, financial challenges, and market decline. Useful for illustrating financial news, economic a. Decrease statistics illustrations Economy Downturn Concept, Wooden Blocks with Letters and Red Arrow. Business Crisis Illustration. Concept illustrating economic downturn. The image shows wooden blocks that spell out economy, partially collapsed and a red arrow pointing downwards, against a neutral backdrop. It conveys crisis, recession, financial challenges, and market decline. Useful for illustrating financial news, economic a
Free with trial Bar chart with decreasing arrow icon symbolizing recession downturn and business failure. Decrease statistics vectors Bar chart with decreasing arrow icon symbolizing recession downturn and business failure
Free with trial A black line graph with an arrow indicating a downward trend on a white background. Decrease statistics illustrations Black line graph showing a downward trend with arrow on white background chart decline. A black line graph with an arrow indicating a downward trend on a white background
Free with trial A black line graph depicts a sharp downward trend with the text Drawdown Phase below. Decrease statistics illustrations Black line graph showing a sharp downward trend with text Drawdown Phase chart decline. A black line graph depicts a sharp downward trend with the text Drawdown Phase below
Free with trial A black graph illustrating a steep downward trend with multiple curved lines and an arrow. Decrease statistics illustrations Black graph showing a steep downward trend with multiple lines and arrow chart decline. A black graph illustrating a steep downward trend with multiple curved lines and an arrow
Free with trial A downward trending graph with a red arrow pointing to the decline, set against a blue background with grid lines and various colored bars at the bottom. Decrease statistics illustrations Downward trend analysis showing significant decline over time with various data points. A downward trending graph with a red arrow pointing to the decline, set against a blue background with grid lines and various colored bars at the bottom
Free with trial A graph showing a downward trend with a red line that peaks at the beginning and gradually decreases with fluctuations, ending with a downward arrow. Decrease statistics illustrations Graph illustrating a downward trend with fluctuations and a decreasing pattern over time. A graph showing a downward trend with a red line that peaks at the beginning and gradually decreases with fluctuations, ending with a downward arrow
Free with trial Simple graphic illustration of a bar chart depicting a downward trend for business and finance. Decrease statistics vectors Simple graphic illustration of a bar chart depicting a downward trend for business and finance
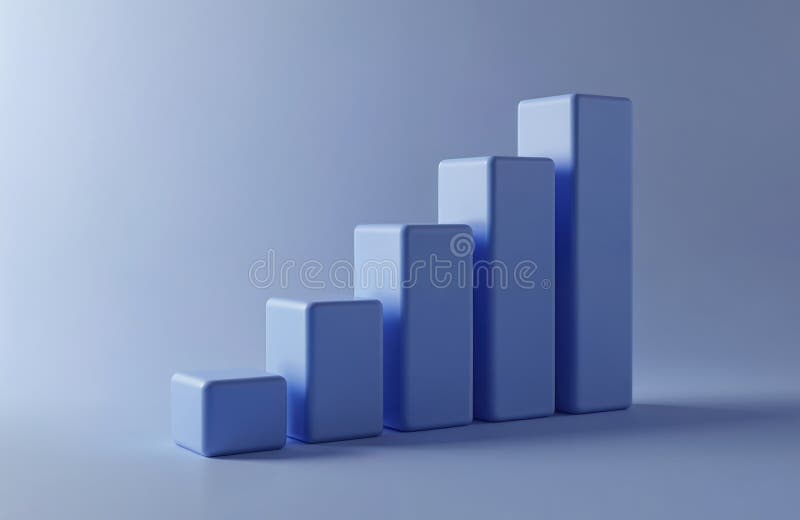
Free with trial Vector illustration of a statistical bar graph, with a green arrow with an upward trend. Decrease statistics vectors Statistical bar graph
Free with trial Three-dimensional line graph with a metallic silver appearance, showing a decreasing trend in a zigzag pattern. The graph is set against a plain white background, with prominent vertical and horizontal axes, representing a financial or statistical decline. The lines are sleek and reflective, resembling metal tubing, enhancing the visual impact of a significant downturn. Decrease statistics vectors 3D line chart with decreasing trend and silver metallic effect representing financial losses. Three-dimensional line graph with a metallic silver appearance, showing a decreasing trend in a zigzag pattern. The graph is set against a plain white background, with prominent vertical and horizontal axes, representing a financial or statistical decline. The lines are sleek and reflective, resembling metal tubing, enhancing the visual impact of a significant downturn.
Free with trial A black and white illustration depicts a distressed man in a suit, sitting on the ground with his head in his hands. Above him, a rain cloud symbolizes gloom. Surrounding him are falling bar graphs and broken arrows, indicating financial decline or business failure. A crumpled paper with an "X" and a dollar sign emphasize financial loss. The imagery conveys themes of economic hardship and stress. Decrease statistics vectors Stressed Businessman Sitting Despair with Falling Bar Chart and Declining Arrow Concept. A black and white illustration depicts a distressed man in a suit, sitting on the ground with his head in his hands. Above him, a rain cloud symbolizes gloom. Surrounding him are falling bar graphs and broken arrows, indicating financial decline or business failure. A crumpled paper with an "X" and a dollar sign emphasize financial loss. The imagery conveys themes of economic hardship and stress.
Free with trial Person analyzes growth chart, market trends, financial data, stock exchange, investment portfolio,Generative AI. Decrease statistics illustrations Business person analyzes growth charts, market trends, and financial data on an interactive screen. Person analyzes growth chart, market trends, financial data, stock exchange, investment portfolio,Generative AI
Free with trial Wooden blocks arranged as a declining graph on a red background, representing financial loss. Decrease statistics illustrations Wooden blocks arranged as a declining graph on a red background, representing financial loss
Free with trial This abstract 3D composition features purple graphs symbolizing growth and decline, set against a soft purple backdrop, ideal for business concepts. Decrease statistics illustrations Abstract 3D Purple Graphs Representing Growth and Decline on a Soft Purple Background. This abstract 3D composition features purple graphs symbolizing growth and decline, set against a soft purple backdrop, ideal for business concepts
Free with trial Shopping cart with downward trending bar graph and arrow icon representing sales decline. Decrease statistics vectors Shopping cart with downward trending bar graph and arrow icon representing sales decline
Free with trial A 3D render of a gold coin with a textured edge. The coin's face features a black circular inlay displaying a golden bar graph with bars decreasing in height from left to right, symbolizing a financial decline or loss. The coin is presented against a clean white background. Decrease statistics illustrations Gold Coin with Falling Bar Graph Symbol on Black Circle Against White Background chart. A 3D render of a gold coin with a textured edge. The coin's face features a black circular inlay displaying a golden bar graph with bars decreasing in height from left to right, symbolizing a financial decline or loss. The coin is presented against a clean white background
Free with trial Various black and white icons related to finance business money security and growth isolated on transparent background. Decrease statistics vectors Collection of flat design finance and business icons isolated on transparent background. Various black and white icons related to finance business money security and growth isolated on transparent background
Free with trial The image shows a bar chart with three bars of decreasing height in blue, representing a downward trend. A red diagonal arrow overlays the bars, emphasizing a sharp decline, often used to symbolize financial downturns, reduced performance, or negative market trends. Decrease statistics illustrations Graphic illustrating a decline in performance or market trend with bar and arrow chart. The image shows a bar chart with three bars of decreasing height in blue, representing a downward trend. A red diagonal arrow overlays the bars, emphasizing a sharp decline, often used to symbolize financial downturns, reduced performance, or negative market trends
Free with trial An image showing stacks of gold coins decreasing in size from left to right, each stack labeled with a percentage symbol, accompanied by a red arrow trending downward. Decrease statistics illustrations Stacks of gold coins decreasing in size with percentage symbol and downward trend arrow. An image showing stacks of gold coins decreasing in size from left to right, each stack labeled with a percentage symbol, accompanied by a red arrow trending downward
Free with trial This image depicts a black and white bar graph illustrating financial growth over a period. The graph shows a steady upward trend with some fluctuations, indicating periods of growth and decline. The bars are arranged in a chronological order, with the height of each bar representing the financial value at a specific time. Decrease statistics illustrations A detailed black and white bar graph showing financial growth over time. This image depicts a black and white bar graph illustrating financial growth over a period. The graph shows a steady upward trend with some fluctuations, indicating periods of growth and decline. The bars are arranged in a chronological order, with the height of each bar representing the financial value at a specific time
Free with trial The image showcases a collection of visual representations of various business performance metrics, such as growth percentages, market shares, and financial gains. Each cube features different types of charts and graphs, including bar graphs, line graphs, pie charts, and target indicators, illustrating growth rates like 5%, 8%, 15%, and market share percentages. The visuals emphasize positive and. Decrease statistics illustrations Diverse business performance metrics and growth indicators isolated on white background. The image showcases a collection of visual representations of various business performance metrics, such as growth percentages, market shares, and financial gains. Each cube features different types of charts and graphs, including bar graphs, line graphs, pie charts, and target indicators, illustrating growth rates like 5%, 8%, 15%, and market share percentages. The visuals emphasize positive and
Free with trial The image shows a person holding a tablet displaying a bar chart with two distinct data sets, one in red and one in blue, indicating a comparison of metrics or trends. The person appears to be in an office environment, possibly analyzing financial or business data, suggesting a focus on performance metrics or market analysis. Decrease statistics illustrations Professional analyzing financial growth trends on a digital tablet in an office setting. The image shows a person holding a tablet displaying a bar chart with two distinct data sets, one in red and one in blue, indicating a comparison of metrics or trends. The person appears to be in an office environment, possibly analyzing financial or business data, suggesting a focus on performance metrics or market analysis
Free with trial The image depicts a series of red downward arrows of varying sizes, symbolizing percentage changes. The central arrow is the largest and features a percent sign, indicating a significant decline, while the surrounding arrows show smaller decreases. Decrease statistics illustrations Graphic illustration of fluctuating percentage changes with prominent central decline. The image depicts a series of red downward arrows of varying sizes, symbolizing percentage changes. The central arrow is the largest and features a percent sign, indicating a significant decline, while the surrounding arrows show smaller decreases
Free with trial This is an detailed collection of financial icons depicting various stock market trends, growth curves, and data analysis patterns. Decrease statistics vectors Financial data and stock market trend line icons set showing growth and volatility curves. This is an detailed collection of financial icons depicting various stock market trends, growth curves, and data analysis patterns
Free with trial Decreasing Bar Chart with Arrow: Business Decline, Negative Trend, Financial Loss and Downturn. Decrease statistics vectors Decreasing Bar Chart with Arrow: Business Decline, Negative Trend, Financial Loss and Downturn
Free with trial Man pointing at declining chart in office symbolizing loss and economic downturn in business strategy a man pointing at a declining chart ,Generative ai. Decrease statistics illustrations Businessman Pointing at Declining Chart Showing Negative Growth in Financial Analysis Presentation Businessman. Man pointing at declining chart in office symbolizing loss and economic downturn in business strategy a man pointing at a declining chart ,Generative ai
Free with trial Orange bars show a decreasing trend with a bold red arrow pointing downwards. Isolated on a transparent background. Decrease statistics vectors Orange bar chart with red downward arrow isolated on a transparent background graph. Orange bars show a decreasing trend with a bold red arrow pointing downwards. Isolated on a transparent background
Free with trial Red glowing downward arrow with trail effect and sparks on black indicating market crash. Decrease statistics vectors Red glowing downward arrow with trail effect and sparks on black indicating market crash
Free with trial A businessman in a suit is intently working on a laptop, analyzing financial data displayed with charts and graphs, including a prominent red percentage symbol and a downward-pointing arrow, indicating a decline in performance or value. Decrease statistics illustrations Businessman Analyzing Financial Data with Decreasing Percentage and Bar Graphs on Laptop. A businessman in a suit is intently working on a laptop, analyzing financial data displayed with charts and graphs, including a prominent red percentage symbol and a downward-pointing arrow, indicating a decline in performance or value
Free with trial Colorful bar chart graph with long shadow in circular background represents data analytics. Decrease statistics vectors Colorful bar chart graph with long shadow in circular background represents data analytics
Free with trial Negative growth graph with white 3d pillars on grid floor against blue background for market trend analysis. Decrease statistics illustrations Business bar chart with declining red arrow showing financial loss and economic recession. Negative growth graph with white 3d pillars on grid floor against blue background for market trend analysis
Free with trial Financial chart with bull and bear in stock market on white color background. Decrease statistics illustrations Financial chart with bull and bear in stock market
Free with trial Red arrows and metallic percentage signs are falling down against white background. Good discounts, sales. Price go down. Header, 3D render. Decrease statistics illustrations Red arrows and metallic percentage signs are falling down against white background. Good discounts, sales. Price go down. Header
Free with trial This image features four different types of graphs and charts that illustrate various trends and data analysis. These visual representations include bar graphs, line graphs, and 3D block charts. Decrease statistics illustrations Graphs and charts showing trends and data analysis isolated on transparent background. This image features four different types of graphs and charts that illustrate various trends and data analysis. These visual representations include bar graphs, line graphs, and 3D block charts
Free with trial 3D bar chart with red arrow pointing down and colorful gears on easel Clear details and vibrant c. Decrease statistics illustrations 3D Bar Chart Showing Downward Trend with Gears graph decline. 3D bar chart with red arrow pointing down and colorful gears on easel Clear details and vibrant c
Free with trial Laptop Displaying Decreasing Graph, Business Downturn Visualization, Economic Recession Concept. Decrease statistics vectors Laptop Displaying Decreasing Graph, Business Downturn Visualization, Economic Recession Concept
Free with trial The image shows a transparent screen displaying a graph with a red downward trend, placed on a desk in a dimly lit office environment with a laptop in the background. Decrease statistics illustrations A downward trending graph is displayed on a transparent screen in a dimly lit office setting. The image shows a transparent screen displaying a graph with a red downward trend, placed on a desk in a dimly lit office environment with a laptop in the background
Free with trial This is an detailed assembly of essential outline icons for business strategy, data visualization, and planning. Decrease statistics vectors Essential business strategy and data visualization tools in professional outline style. This is an detailed assembly of essential outline icons for business strategy, data visualization, and planning
Free with trial A simplistic graph illustration showing a downward trend with a water drop, conveying scarcity. Flat style with muted blue and red tones. Decrease statistics vectors Declining Graph with Water Drop: Illustrating Scarcity and Resource Depletion Trends. A simplistic graph illustration showing a downward trend with a water drop, conveying scarcity. Flat style with muted blue and red tones.
Free with trial Car accident leading to financial loss The image depicts a car crash and a tow truck against a backdrop of a rising financial chart. Decrease statistics illustrations Car accident leading to financial loss shown with a rising chart and tow truck AI generated. Car accident leading to financial loss The image depicts a car crash and a tow truck against a backdrop of a rising financial chart
Free with trial Silhouette of a spyglass or telescope icon on a white background. Features five connected rectangular segments that decrease in size from right to left, creating a diagonal arrangement. The design is minimalist with solid black shapes, highlighting a telescopic form. Decrease statistics vectors Minimalist bar chart icon with five connected rectangles decreasing size diagonal on white. Silhouette of a spyglass or telescope icon on a white background. Features five connected rectangular segments that decrease in size from right to left, creating a diagonal arrangement. The design is minimalist with solid black shapes, highlighting a telescopic form.
Free with trial A person's hands hover over a laptop displaying a vibrant green home energy efficiency graphic with a bar chart showing energy consumption levels A, B, and G. The overall tone is dark and moody. Decrease statistics illustrations Dark toned image of hands interacting with a glowing green home energy efficiency graphic. A person's hands hover over a laptop displaying a vibrant green home energy efficiency graphic with a bar chart showing energy consumption levels A, B, and G. The overall tone is dark and moody
Free with trial This vector illustration shows icons representing financial growth and decline concepts such as profits, losses, success, and failure using coins, arrows, and people with clear black shapes. The style is simple and effective, conveying economic mood. Generative AI. Decrease statistics vectors Financial growth decline icons economic success failure money coins profits losses vector illustration. This vector illustration shows icons representing financial growth and decline concepts such as profits, losses, success, and failure using coins, arrows, and people with clear black shapes. The style is simple and effective, conveying economic mood. Generative AI
Free with trial A 3D render of a golden arrow curving upwards and to the right, positioned over a bar chart composed of alternating silver and gold vertical bars. The bars decrease in height from left to right, while the arrow signifies a strong upward trend. The background is white, emphasizing the financial concept. Decrease statistics illustrations Golden arrow rising above silver and gold bar chart symbolizing financial growth and success. A 3D render of a golden arrow curving upwards and to the right, positioned over a bar chart composed of alternating silver and gold vertical bars. The bars decrease in height from left to right, while the arrow signifies a strong upward trend. The background is white, emphasizing the financial concept
Free with trial Descending bar graph on blue background. 3D render data visualization. Financial market chart, business analysis concept. Economic loss, falling sales, statistics. Ideal for. Decrease statistics illustrations Descending bar graph on blue background. 3D render data visualization. Financial market chart, business analysis concept.
Free with trial Teal bars show a decreasing trend with a red arrow pointing downwards. Isolated on a transparent background. Decrease statistics vectors Teal bar graph with red downward trending arrow isolated on a transparent background. Teal bars show a decreasing trend with a red arrow pointing downwards. Isolated on a transparent background
Free with trial Pink bar chart report on wooden table displaying progress data analysis ,Generative ai. Decrease statistics illustrations Pink bar chart report displaying progress data analysis on wooden table for business insights. Pink bar chart report on wooden table displaying progress data analysis ,Generative ai
Free with trial This image is a flat design showing a decreasing red bar graph on a black background. It symbolizes a decline or negative trend. Decrease statistics vectors Decreasing Red Bar Graph on Black Background Representing Decline or Negative Trends. This image is a flat design showing a decreasing red bar graph on a black background. It symbolizes a decline or negative trend.
Free with trial A close-up shot reveals a vibrant red line graph sharply declining on a dark blue screen depicting a negative trend in the stock market The image represents financial loss investment risk and market downturn Ideal for illustrating economic instability. Decrease statistics illustrations Close up Red Stock Market Graph Showing Decline Financial Loss Investment Risk AI generated. A close-up shot reveals a vibrant red line graph sharply declining on a dark blue screen depicting a negative trend in the stock market The image represents financial loss investment risk and market downturn Ideal for illustrating economic instability