Free with trial Decline Curve A Visual Representation of Increasing Trends Curving Downward and Overcoming Previous Bars Against a Dark Blue Background by SD. Decrease statistics illustrations Decline Curve A Visual Representation of Increasing Trends Curving Downward and Overcoming Previous Bars Against a Dark Blue Backg
Free with trial Light bulb illustration regarding electricity bill increase decreaseImage of electricity bill. Decrease statistics vectors Light bulb illustration regarding electricity bill increase decrease
Free with trial Percentage sign with downward red and white arrows, financial decline, economic downturn, minimalist design, dark background, 3D render, market crash. Decrease statistics illustrations Percentage sign with downward red and white arrows, financial decline
Free with trial This illustration features two colorful bar graphs on a white background, showcasing data comparison with distinct color palettes for engaging visual analysis and presentations. Decrease statistics illustrations Colorful Bar Graphs on White Background Representing Data Comparison and Growth with Different Color Schemes for Visual Analysis. This illustration features two colorful bar graphs on a white background, showcasing data comparison with distinct color palettes for engaging visual analysis and presentations
Free with trial Striking AI-generated visualization of a sharp financial crisis. This 3D render, featuring a bar chart and a glowing downward arrow, clearly communicates economic distress and market volatility, providing essential data imagery for investors and businesses tracking performance decline. Decrease statistics illustrations Conceptual 3D bar chart illustrating drastic market collapse and financial loss with a glowing downward arrow on a neutral backgro. Striking AI-generated visualization of a sharp financial crisis. This 3D render, featuring a bar chart and a glowing downward arrow, clearly communicates economic distress and market volatility, providing essential data imagery for investors and businesses tracking performance decline.
Free with trial Red Downward Arrow Showing Global Stock Market Crash and Economic Recession with Falling Percentages Representing Tariff Effects and Financial Crisis 3d rendering. Decrease statistics illustrations Red Downward Arrow Showing Global Stock Market Crash and Economic Recession with Falling Percentages Representing Tariff Effects
Free with trial Modern abstract zigzag-shaped chart depicting fluctuations in data analysis representing concept. Decrease statistics illustrations Modern abstract zigzag-shaped line chart representing fluctuations in data analysis concept. Modern abstract zigzag-shaped chart depicting fluctuations in data analysis representing concept
Free with trial This vibrant bar graph displays data trends through colorful segments, ideal for marketing and business presentations. Utilize this minimalistic design for impactful insights. Decrease statistics illustrations Colorful Bar Graph Showing Data Trends with Various Heights and Colors in a Minimalistic Style for Business and Marketing. This vibrant bar graph displays data trends through colorful segments, ideal for marketing and business presentations. Utilize this minimalistic design for impactful insights
Free with trial Diagram chart line icon. Neumorphic, Green gradient, 3d pin buttons. Column 3d graph sign. Market analytics symbol. Line icons. Neumorphic buttons with outline signs. Vector. Decrease statistics vectors Diagram chart line icon. Column 3d graph sign. Line icons. Vector. Diagram chart line icon. Neumorphic, Green gradient, 3d pin buttons. Column 3d graph sign. Market analytics symbol. Line icons. Neumorphic buttons with outline signs. Vector
Free with trial The visual depicts a financial bar chart in a minimalist style, showcasing a decline with bars in gradient hues, creating a striking contrast against a dark background. Decrease statistics illustrations A minimalist representation of a collapsing financial bar chart with vibrant colors. The visual depicts a financial bar chart in a minimalist style, showcasing a decline with bars in gradient hues, creating a striking contrast against a dark background.
Free with trial Growth chart icon. Decline line symbol. Vector business graphic. Profit and loss shape. EPS 10. Decrease statistics vectors Growth chart icon. Decline line symbol. Vector business graphic. Profit and loss shape.
Free with trial A modern data visualization featuring a line graph and bar chart, ideal for illustrating business trends and performance metrics in reports and presentations. Decrease statistics illustrations Data visualization with a line graph and bar chart representing trends and comparisons in a clear and modern style for business. A modern data visualization featuring a line graph and bar chart, ideal for illustrating business trends and performance metrics in reports and presentations
Free with trial This vibrant line chart illustrates growth and decline trends with colored circles, making it suitable for business presentations, reports, and educational material. Decrease statistics illustrations Colorful Line Chart Showing Growth and Decline Trends with Green, Yellow, and Red Circles Representing Data Points over Time. This vibrant line chart illustrates growth and decline trends with colored circles, making it suitable for business presentations, reports, and educational material
Free with trial Isolated red and green arrows for infographics representing economic trends and indicators. Decrease statistics illustrations Isolated red and green arrows for infographics representing economic trends and indicators
Free with trial Financial success and investment strategy depicted through Gross Domestic Product GDP, stock market analysis, currency fluctuations, banking, and accounting. Decrease statistics illustrations Gross Domestic Product GDP concept displaying economic analysis, stock market trends, and financial growth for intelligent invest. Financial success and investment strategy depicted through Gross Domestic Product GDP, stock market analysis, currency fluctuations, banking, and accounting
Free with trial This monochromatic bar graph illustrates data trends over time, showcasing variations in performance and metrics, ideal for presentations and business reports. Decrease statistics illustrations Black and White Bar Graph with Trend Line Showing Data Variations Over Time for Analysis and Reporting Purposes in Business. This monochromatic bar graph illustrates data trends over time, showcasing variations in performance and metrics, ideal for presentations and business reports
Free with trial Colorful bar chart with a line graph presenting trends and data growth over time, ideal for business analysis, marketing presentations, and financial reports. Decrease statistics illustrations Colorful Bar Chart with Line Graph Illustrating Trends and Data Growth over Time For Business, Marketing, Finance and Analysis Use. Colorful bar chart with a line graph presenting trends and data growth over time, ideal for business analysis, marketing presentations, and financial reports
Free with trial Colorful bar charts illustrating positive and negative business trends from january to may provide a clear visual representation of performance. Decrease statistics vectors Colorful bar charts illustrating positive and negative business trends from january to may provide a clear visual
Free with trial Colorful bar charts are presenting statistical trends and business performance data across different time periods. Possibly days of the week. Using a vibrant color scheme of blue. Purple. And orange. Decrease statistics illustrations Colorful bar charts are presenting statistical trends and business performance data across different time periods
Free with trial Report timer line icon. Neumorphic, Orange gradient, 3d pin buttons. Column graph sign. Growth diagram chart symbol. Line icons. Neumorphic buttons with outline signs. Vector. Decrease statistics vectors Report timer line icon. Column graph sign. Line icons. Vector. Report timer line icon. Neumorphic, Orange gradient, 3d pin buttons. Column graph sign. Growth diagram chart symbol. Line icons. Neumorphic buttons with outline signs. Vector
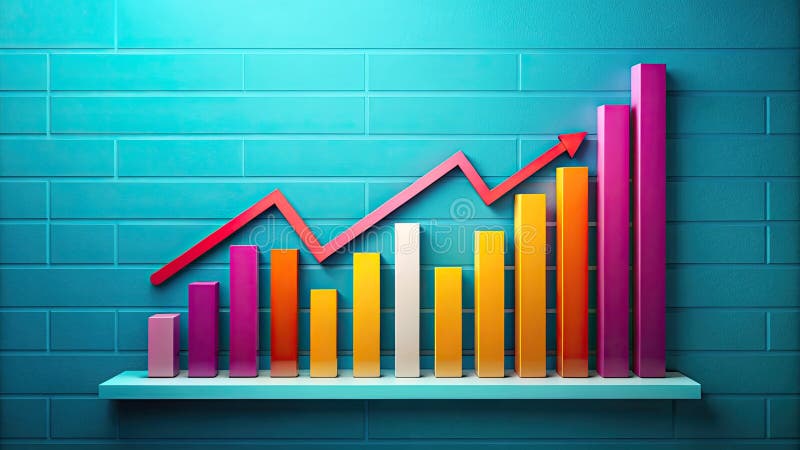
Free with trial A clean, minimalist bar chart displays a gradual decline in financial performance, with rising bars depicted in soft blue against a serene teal background. Decrease statistics illustrations Minimalist financial bar chart illustrating gradual decline in economic performance. A clean, minimalist bar chart displays a gradual decline in financial performance, with rising bars depicted in soft blue against a serene teal background.
Free with trial This illustration features two colorful bar graphs on a white background, showcasing data comparison with distinct color palettes for engaging visual analysis and presentations. Decrease statistics illustrations Colorful Bar Graphs on White Background Representing Data Comparison and Growth with Different Color Schemes for Visual Analysis. This illustration features two colorful bar graphs on a white background, showcasing data comparison with distinct color palettes for engaging visual analysis and presentations
Free with trial This image features a conceptual bar graph, illustrating contrasting trends of growth and decline in business performance, ideal for data analysis presentations. Decrease statistics illustrations Growth and Decline: Conceptual Bar Graph Illustrating Positive and Negative Trends in Business Performance Data Visualization. This image features a conceptual bar graph, illustrating contrasting trends of growth and decline in business performance, ideal for data analysis presentations
Free with trial This image features colorful 3D bar graphs representing both growth and decline trends, ideal for business analytics and financial performance visualizations. Decrease statistics illustrations Colorful 3D Bar Graphs Displaying Growth and Decline Trends in Business Analytics and Financial Performance on a Clean White. This image features colorful 3D bar graphs representing both growth and decline trends, ideal for business analytics and financial performance visualizations
Free with trial Golden bear statue on wall street in financial district - bear market recession concept. Generative AI. Decrease statistics illustrations Golden bear statue on wall street in financial district - bear market recession concept
Free with trial This abstract data visualization features smooth blue waves representing trends and fluctuations, ideal for business reports, finance presentations, and analytical insights. Decrease statistics illustrations Abstract Blue Data Visualization Depicting Trends and Fluctuations in Graphical Format for Business and Finance Presentations. This abstract data visualization. This abstract data visualization features smooth blue waves representing trends and fluctuations, ideal for business reports, finance presentations, and analytical insights
Free with trial Arrow trend-down icon vector set on white background. EPS 10. Decrease statistics vectors Arrow trend-down icon isolated on white background. Arrow trend-down icon vector set on white background. EPS 10
Free with trial Arrow trend-down icon vector set on white background. EPS 10. Decrease statistics vectors Arrow trend-down icon isolated on white background. Arrow trend-down icon vector set on white background. EPS 10
Free with trial Arrow trend-down icon vector set on white background. EPS 10. Decrease statistics vectors Arrow trend-down icon isolated on white background. Arrow trend-down icon vector set on white background. EPS 10
Free with trial Dynamic red and blue stock market graph with data points and financial charts on a dark background. Generative AI. Decrease statistics illustrations Dynamic red and blue stock market graph with data points and financial charts on a dark background
Free with trial Intersecting colorful lines trending up and down across a graph illustrate weekly progress from monday to sunday, capturing fluctuations in performance over time. Decrease statistics illustrations Intersecting colorful lines trending up and down across a graph illustrate weekly progress from monday to sunday
Free with trial A layered arrangement of dark wooden blocks displaying decreasing red and tan bars, with a downward arrow illustrating a downturn in financial or market performance. Decrease statistics illustrations Stacked black wooden cubes with red and tan descending bar charts and downward arrow symbolizing financial or business decline. A layered arrangement of dark wooden blocks displaying decreasing red and tan bars, with a downward arrow illustrating a downturn in financial or market performance
Free with trial Vector illustration of a graph with a downward arrow, representing decline or negative growth. Decrease statistics vectors Professional Graph with Arrow Down Outline Icon Vector Illustration. Vector illustration of a graph with a downward arrow, representing decline or negative growth.
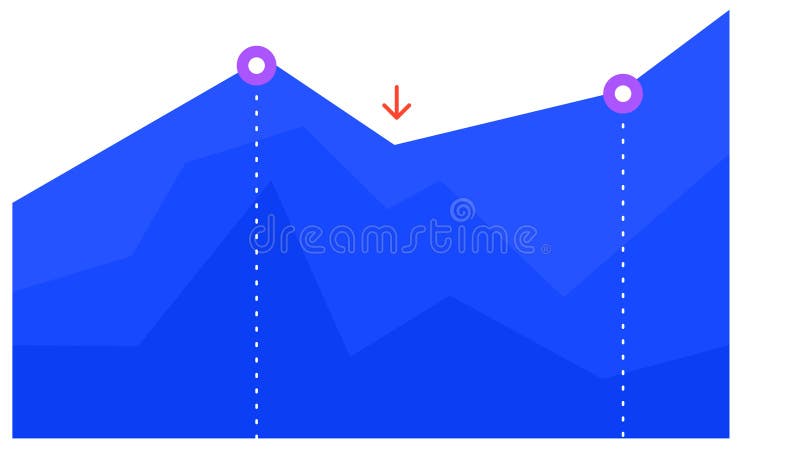
Free with trial Blue graph chart is visually representing growth, decline, and subsequent recovery, with two key points highlighted by purple circles and a red arrow indicating a temporary dip. Decrease statistics vectors Blue graph chart is visually representing growth, decline, and subsequent recovery, with two key points highlighted by
Free with trial Blue graph chart is visually representing growth, decline, and subsequent recovery, with two key points highlighted by purple circles and a red arrow indicating a temporary dip. Decrease statistics illustrations Blue graph chart is visually representing growth, decline, and subsequent recovery, with two key points highlighted by
Free with trial Vibrant and colorful bar chart illustrating various data metrics, perfect for business or marketing use, highlighting trends and insights visually engaging for audiences. Decrease statistics illustrations Colorful Bar Chart Showing Data Variations in a Bright and Engaging Style Suitable for Business Presentations or Marketing. Vibrant and colorful bar chart illustrating various data metrics, perfect for business or marketing use, highlighting trends and insights visually engaging for audiences
Free with trial This vibrant illustration features colorful bar graphs that visualize business growth and performance metrics, ideal for presentations, reports, and analysis. Decrease statistics illustrations Colorful Bar Graphs Representing Business Growth and Performance Metrics in Vibrant Tones of Red, Orange, Yellow, White, and Green. This vibrant illustration features colorful bar graphs that visualize business growth and performance metrics, ideal for presentations, reports, and analysis
Free with trial An analytical hand holding a magnifying glass over a stock market chart, symbolizing investment analysis and financial insight, Generative AI. Decrease statistics illustrations An analytical hand holding a magnifying glass over a stock market chart, symbolizing investment analysis and financial insight
Free with trial This vibrant bar graph showcases varying heights for data visualization, perfect for representing trends in finance or business analysis against a clean white background. Decrease statistics illustrations Colorful Bar Graph with Varying Heights Representing Data Trends and Insights in a Minimalist Art Style on White Background. This vibrant bar graph showcases varying heights for data visualization, perfect for representing trends in finance or business analysis against a clean white background
Free with trial A vibrant 3D bar graph illustration shows financial growth trends with colorful bars. Perfect for business presentations, analytics, and creative projects. Decrease statistics illustrations Colorful 3D bar graph illustration depicting financial growth and performance trends with vibrant hues and clean modern design for. A vibrant 3D bar graph illustration shows financial growth trends with colorful bars. Perfect for business presentations, analytics, and creative projects
Free with trial A visually appealing line graph illustrates data fluctuations and trends over time. The minimalist design makes it suitable for presentations and reports in various fields. Decrease statistics illustrations Line graph depicting data trends with fluctuations and peaks over time in a minimalist style, showcasing analytical insights and. A visually appealing line graph illustrates data fluctuations and trends over time. The minimalist design makes it suitable for presentations and reports in various fields
Free with trial Colorful bar charts illustrating positive and negative business trends from january to may provide a clear visual representation of performance. Decrease statistics illustrations Colorful bar charts illustrating positive and negative business trends from january to may provide a clear visual
Free with trial Abstract 3D bar graph representation showcasing various data trends with vibrant colors and shadows. Ideal for presentations, reports, and analytics purposes. Decrease statistics illustrations 3D Visualization of Colorful Bar Graph Illustrating Data Trends with Shadows and Depth in a Minimalistic Style for Data Analysis. Abstract 3D bar graph representation showcasing various data trends with vibrant colors and shadows. Ideal for presentations, reports, and analytics purposes
Free with trial Vector illustration stacked coins and arrow trending down, decreasing statistical graphic concept. Decrease statistics vectors Vector illustration stack coin arrow downup trend. vector illustration stacked coins and arrow trending down, decreasing statistical graphic concept
Free with trial Light bulb illustration regarding electricity bill increase decreaseImage of electricity bill. Decrease statistics vectors Light bulb illustration regarding electricity bill increase decrease
Free with trial Light bulb illustration regarding electricity bill increase decreaseImage of electricity bill. Decrease statistics vectors Light bulb illustration regarding electricity bill increase decrease
Free with trial Light bulb illustration regarding electricity bill increase decreaseImage of electricity bill. Decrease statistics vectors Light bulb illustration regarding electricity bill increase decrease
Free with trial Light bulb illustration regarding electricity bill increase decreaseImage of electricity bill. Decrease statistics vectors Light bulb illustration regarding electricity bill increase decrease
Free with trial Light bulb illustration regarding electricity bill increase decreaseImage of electricity bill. Decrease statistics vectors Light bulb illustration regarding electricity bill increase decrease
Free with trial Light bulb illustration regarding electricity bill increase decreaseImage of electricity bill. Decrease statistics vectors Light bulb illustration regarding electricity bill increase decrease
Free with trial Light bulb illustration regarding electricity bill increase decreaseImage of electricity bill. Decrease statistics vectors Light bulb illustration regarding electricity bill increase decrease
Free with trial Light bulb illustration regarding electricity bill increase decreaseImage of electricity bill. Decrease statistics vectors Light bulb illustration regarding electricity bill increase decrease
Free with trial Light bulb illustration regarding electricity bill increase decreaseImage of electricity bill. Decrease statistics vectors Light bulb illustration regarding electricity bill increase decrease
Free with trial Light bulb illustration regarding electricity bill increase decreaseImage of electricity bill. Decrease statistics vectors Light bulb illustration regarding electricity bill increase decrease
Free with trial Light bulb illustration regarding electricity bill increase decreaseImage of electricity bill. Decrease statistics vectors Light bulb illustration regarding electricity bill increase decrease
Free with trial Light bulb illustration regarding electricity bill increase decreaseImage of electricity bill. Decrease statistics vectors Light bulb illustration regarding electricity bill increase decrease
Free with trial Light bulb illustration regarding electricity bill increase decreaseImage of electricity bill. Decrease statistics vectors Light bulb illustration regarding electricity bill increase decrease
Free with trial Light bulb illustration regarding electricity bill increase decreaseImage of electricity bill. Decrease statistics vectors Light bulb illustration regarding electricity bill increase decrease
Free with trial Light bulb illustration regarding electricity bill increase decreaseImage of electricity bill. Decrease statistics vectors Light bulb illustration regarding electricity bill increase decrease
Free with trial Percentage sign with downward red and white arrows, financial decline, economic downturn, minimalist design, dark background, 3D render, market crash. Decrease statistics illustrations Percentage sign with downward red and white arrows, financial decline
Free with trial Percentage sign with downward red and white arrows, financial decline, economic downturn, minimalist design, dark background, 3D render, market crash. Decrease statistics illustrations Percentage sign with downward red and white arrows, financial decline
Free with trial Percentage sign with downward red and white arrows, financial decline, economic downturn, minimalist design, dark background, 3D render, market crash. Decrease statistics illustrations Percentage sign with downward red and white arrows, financial decline
Free with trial Description: This abstract image depicts a financial stock market trading chart with a gold arrow pointing downwards on a blue background. The downtrend of the arrow symbolizes a decrease in stock prices or market performance. The contrasting colors and geometric shapes convey a sense of complexity and volatility in the financial market. This image can be used to represent concepts such as market analysis, investment strategies, and economic trends. Decrease statistics illustrations Abstract Financial Stock Market Trading Chart with Gold Arrow Downtrend on Blue Background. Description: This abstract image depicts a financial stock market trading chart with a gold arrow pointing downwards on a blue background. The downtrend of the arrow symbolizes a decrease in stock prices or market performance. The contrasting colors and geometric shapes convey a sense of complexity and volatility in the financial market. This image can be used to represent concepts such as market analysis, investment strategies, and economic trends.
Free with trial This vibrant line graph showcases multiple data series, illustrating trends and fluctuations over time with a clear light grid background, perfect for reports. Decrease statistics illustrations Colorful Line Graph Representing Data Trends Over Time with Multiple Data Series and Fluctuating Values on a Light Grid Background. This vibrant line graph showcases multiple data series, illustrating trends and fluctuations over time with a clear light grid background, perfect for reports
Free with trial Two colorful lines are representing data points over time, creating a visual representation of trends and fluctuations, with a highlighted period marked in red. Decrease statistics vectors Two colorful lines are representing data points over time, creating a visual representation of trends and fluctuations
Free with trial Graph depicting 3D line and bar data visualization in red, white background, financial trends concept. Decrease statistics illustrations Graph showing 3D line and bar data visualization in red, white background, financial trends concept
Free with trial Bright and colorful bar graph created with blocks illustrates data visualization in a contemporary business context. Ideal for finance and marketing materials. Decrease statistics illustrations Colorful bar graph made of building blocks representing data visualization and analysis in modern business graphics on a clean. Bright and colorful bar graph created with blocks illustrates data visualization in a contemporary business context. Ideal for finance and marketing materials
Free with trial This vibrant 3D bar graph showcases data trends with a colorful aesthetic, perfect for presentations in business, finance, or technology sectors emphasizing analytics. Decrease statistics illustrations Colorful Bar Graph Visualization of Data Trends in Modern Business Environment with 3D Perspective and Vibrant Gradient Colors. This vibrant 3D bar graph showcases data trends with a colorful aesthetic, perfect for presentations in business, finance, or technology sectors emphasizing analytics
Free with trial This abstract artwork illustrates financial market dynamics with intricate lines and colors, representing stock price movements and trading patterns artistically. Decrease statistics illustrations Abstract financial market analysis with intricate lines depicting stock price movements and trading patterns in shades of black. This abstract artwork illustrates financial market dynamics with intricate lines and colors, representing stock price movements and trading patterns artistically
Free with trial The visualization displays a collapsing financial bar chart, illustrating a significant decrease in financial metrics with a clean, minimalist aesthetic. Decrease statistics illustrations Visual representation of financial decline using a collapsing bar chart in a modern design. The visualization displays a collapsing financial bar chart, illustrating a significant decrease in financial metrics with a clean, minimalist aesthetic.
Free with trial Decline chart icon. Falling arrow symbol. Economic downturn illustration. Vector trend design. EPS 10. Decrease statistics vectors Decline chart icon. Falling arrow symbol. Economic downturn illustration. Vector trend design.
Free with trial Two colorful lines are representing data points over time, creating a visual representation of trends and fluctuations, with a highlighted period marked in red. Decrease statistics illustrations Two colorful lines are representing data points over time, creating a visual representation of trends and fluctuations
Free with trial Glowing Candlestick Chart Depicting Downward Trend in Market Generative AI Illustration. Decrease statistics illustrations Glowing Candlestick Chart Depicting Downward Trend in Market
Free with trial Arrow trend-down icon vector set on white background. EPS 10. Decrease statistics vectors Arrow trend-down icon isolated on white background. Arrow trend-down icon vector set on white background. EPS 10
Free with trial Silhouette of a head with stock market decline graph overlay, red and black tones, digital concept of financial crisis. 3D. Decrease statistics illustrations Silhouette of a head with stock market decline graph overlay, red and black tones, digital concept of financial crisis. 3D
Free with trial This sleek, minimalist linear bar graph is perfect for showcasing downward trends in your business data. Ideal for presentations, reports, and dashboards, this editable graphic allows you to easily customize stroke width and colors to match your brand. The clean design and simple layout make complex data easily digestible, highlighting key performance indicators and areas needing attention. Decrease statistics illustrations Editable Linear Bar Graph Visualize Downward Trends for Powerful Business Analytics Reports and Presentations. This sleek, minimalist linear bar graph is perfect for showcasing downward trends in your business data. Ideal for presentations, reports, and dashboards, this editable graphic allows you to easily customize stroke width and colors to match your brand. The clean design and simple layout make complex data easily digestible, highlighting key performance indicators and areas needing attention.
Free with trial Candlestick chart line icon. Neumorphic, Orange gradient, 3d pin buttons. Analytics graph sign. Market analytics symbol. Line icons. Neumorphic buttons with outline signs. Vector. Decrease statistics vectors Candlestick chart line icon. Analytics graph sign. Line icons. Vector. Candlestick chart line icon. Neumorphic, Orange gradient, 3d pin buttons. Analytics graph sign. Market analytics symbol. Line icons. Neumorphic buttons with outline signs. Vector
Free with trial Stock market trading technical analysis bar chart fall banner. Business candlestick graph exchange down trend. Economic crisis and investment loss graph. Trader financial index crash. Money losing eps. Decrease statistics vectors Stock market trading technical analysis bar chart fall banner. Business candlestick graph exchange down trend. Economic
Free with trial Red 3D Percentage Symbol With Arrow Pointing Down. Price reduction percentage sign in red. Vector Illustrator. Decrease statistics vectors Red 3D Percentage Symbol With Arrow Pointing Down. Vector Illustrator. Red 3D Percentage Symbol With Arrow Pointing Down. Price reduction percentage sign in red. Vector Illustrator.
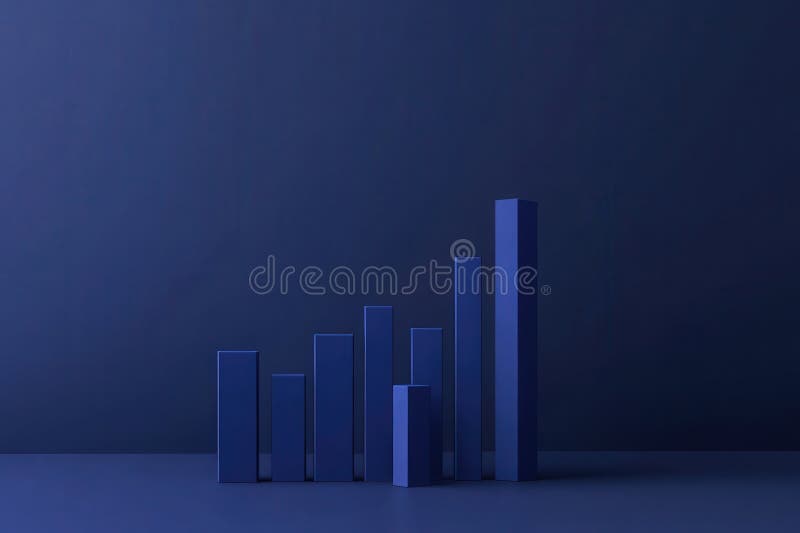
Free with trial The visual displays a clean and minimalist bar chart, illustrating a notable decrease in financial performance over a recent quarter, with a focus on dark blue tones to enhance impact. Decrease statistics illustrations Minimalist financial bar chart showing significant decline in earnings over the past quarter. The visual displays a clean and minimalist bar chart, illustrating a notable decrease in financial performance over a recent quarter, with a focus on dark blue tones to enhance impact.