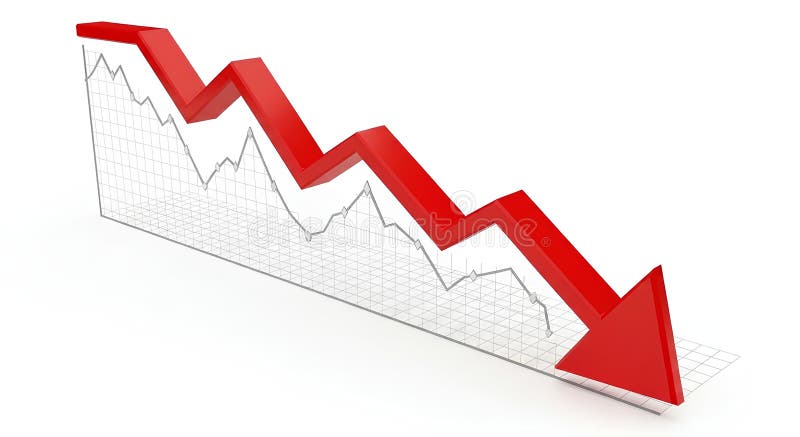
Free with trial A 3D render of a vibrant red arrow pointing downwards, visually representing decline, loss, or a stock market crash. Decrease stock illustrations Red Arrow Down Stock Market Crash. A 3D render of a vibrant red arrow pointing downwards, visually representing decline, loss, or a stock market crash. A 3D render of a vibrant red arrow pointing downwards, visually representing decline, loss, or a stock market crash.
Free with trial Economic and financial global crisis rising inflation and debt on stock market. Economic and financial crisis rising inflation and debt 3D render background. Decrease stock illustrations Economic and financial global crisis rising inflation and debt on stock market. Economic and financial crisis rising inflation and debt 3D render background
Free with trial Financial downturn warning sign with dollar symbol, bar chart, and red arrow pointing down. Decrease stock illustrations Price decrease with dollar sign and arrow pointing down on blue triangle. Financial downturn warning sign with dollar symbol, bar chart, and red arrow pointing. Financial downturn warning sign with dollar symbol, bar chart, and red arrow pointing down
Free with trial Abstract financial chart with downtrend line graph and arrow in stock market on red color background. Decrease stock illustrations Financial chart with downtrend line arrow in stock market on red color background. Abstract financial chart with downtrend line graph and arrow in stock market. Abstract financial chart with downtrend line graph and arrow in stock market on red color background
Free with trial Red falling arrow for global crisis concept. Graphic red arrow representing fast decrease and crisis on global level. Decrease stock illustrations Red falling arrow for global crisis concept. Graphic red arrow representing fast decrease and crisis on global level
Free with trial Bull and bear market concept with up and down arrows. Stock market trends, concept. 3d rendering. Isolated on white background. Decrease stock illustrations Bull and bear market concept with up and down arrows. Stock market trends, concept. 3d rendering. Isolated on white background
Free with trial Digital isometric warning icon and red alert stripes on a dark financial background with blurred stock market charts and falling graphs. Concept of global economic crisis, market crash, system failure, and high investment risk. Decrease stock illustrations Warning icon on red financial stock market crash background. Digital isometric warning icon and red alert stripes on a dark financial background with blurred. Digital isometric warning icon and red alert stripes on a dark financial background with blurred stock market charts and falling graphs. Concept of global economic crisis, market crash, system failure, and high investment risk.
Free with trial Business and financial crisis and depression vector concept with businessman pushed into hole by downward arrow. Symbol of stock crash, recession and losses. Eps10 illustration. Decrease stock vectors Business and financial crisis and depression vector concept with businessman pushed into hole by downward arrow. Symbol of stock crash, recession and losses
Free with trial Black line icon showing financial stock market fluctuation with upward and downward trend arrows on a white background. Decrease stock vectors Minimalist Outline Financial Market Volatility Fluctuation Trend Arrow Icon. Black line icon showing financial stock market fluctuation with upward and downward. Black line icon showing financial stock market fluctuation with upward and downward trend arrows on a white background.
Free with trial Concept of global financial crisis. Blurry planet hologram with double exposure of falling digital graphs. 3d rendering toned image. Decrease stock illustrations Global financial crisis concept, stock market. Concept of global financial crisis. Blurry planet hologram with double exposure of falling digital graphs. 3d. Concept of global financial crisis. Blurry planet hologram with double exposure of falling digital graphs. 3d rendering toned image
Free with trial Wine shipment delivery, receive wine stock, download wine inventory. Pixel perfect, editable stroke vector icon. Decrease stock vectors Wine shipment delivery, receive wine stock, download wine inventory. Pixel perfect, editable vector icon. Wine shipment delivery, receive wine stock, download. Wine shipment delivery, receive wine stock, download wine inventory. Pixel perfect, editable stroke vector icon
Free with trial A futuristic digital illustration depicts a world map with a dark background composed of small blue and green dots arranged in a dotted pattern to create depth and dimension, featuring a prominent downward-trending line graph at its center surrounded by a darker green line that represents declining financial data or stock market performance, creating a technological visualization of the global. Decrease stock illustrations Digital world map with dotted pattern showing global economic downturn on dark background. A futuristic digital illustration depicts a world map with a dark. A futuristic digital illustration depicts a world map with a dark background composed of small blue and green dots arranged in a dotted pattern to create depth and dimension, featuring a prominent downward-trending line graph at its center surrounded by a darker green line that represents declining financial data or stock market performance, creating a technological visualization of the global
Free with trial Trading trends and economic statistics. Decrease stock illustrations Stock market Euro trading graph in red color as economy 3D illustration background. Trading trends and economic statistics. Trading trends and economic statistics.
Free with trial Trading trends and economic statistics. Decrease stock illustrations Stock market Yuan trading graph in red color as economy 3D illustration background. Trading trends and economic statistics. Trading trends and economic statistics.
Free with trial Trading trends and economic statistics. Decrease stock illustrations Stock market Pound trading graph in red color as economy 3D illustration background. Trading trends and economic statistics. Trading trends and economic statistics.
Free with trial Depicts a 3D rendered arrow pointing downwards, symbolizing economic decline, stock market crash, or a negative trend. Decrease stock illustrations Downward Trend Arrow Stock Market Crash. Depicts a 3D rendered arrow pointing downwards, symbolizing economic decline, stock market crash, or a negative trend. Depicts a 3D rendered arrow pointing downwards, symbolizing economic decline, stock market crash, or a negative trend.
Free with trial Up and down arrows with bar chart icons. Bright green and red up and down arrows paired with bar chart icons illustrating increase and decrease trends. Decrease stock illustrations Up and down arrows with bar chart icons. Bright green and red up and down arrows paired with bar chart icons illustrating increase and decrease trends
Free with trial Diagram Graph And Financial Charts icons set with white background. Thin Line Style stock vector. Decrease stock vectors Diagram Graph And Financial Charts icons set with white background. Thin Line Style stock vector
Free with trial A sad red bear sitting with arms crossed, stock market graph in background, symbolizing financial loss, bearish trend, and emotional impact. Decrease stock illustrations Sad red bear sitting with arms crossed, stock market graph in background, symbolizing financial loss, bearish trend, and emotional. A sad red bear sitting with. A sad red bear sitting with arms crossed, stock market graph in background, symbolizing financial loss, bearish trend, and emotional impact
Free with trial 3d render closeup of computer keyboard with EURO STOXX 50 index button. Stock market indexes concept. Decrease stock illustrations 3d render of computer keyboard with EURO STOXX 50 index button. 3d render closeup of computer keyboard with EURO STOXX 50 index button. Stock market indexes. 3d render closeup of computer keyboard with EURO STOXX 50 index button. Stock market indexes concept.
Free with trial 3d render closeup of computer keyboard with bear and S&P 500 index button. Stock market indexes concept. Decrease stock illustrations 3d render of computer keyboard with bear and S&P 500 index. 3d render closeup of computer keyboard with bear and S&P 500 index button. Stock market indexes. 3d render closeup of computer keyboard with bear and S&P 500 index button. Stock market indexes concept.
Free with trial Stock Market Falling, Business Crisis Concept,Financial crisis concept, Economic Crisis. Business fall, 3d rendering. Decrease stock illustrations Financial crisis concept, Economic Crisis. Business fall, 3d rendering. Stock Market Falling, Business Crisis Concept,Financial crisis concept, Economic Crisis. Stock Market Falling, Business Crisis Concept,Financial crisis concept, Economic Crisis. Business fall, 3d rendering
Free with trial Technological geometric vector illustration showing blue polygonal arrow aimed downwards. Modern digital art piece depicting financial decrease or direction using crystal triangulation technique. Decrease stock vectors Abstract low poly blue arrow pointing down on dark background representing decline. Technological geometric vector illustration showing blue polygonal arrow. Technological geometric vector illustration showing blue polygonal arrow aimed downwards. Modern digital art piece depicting financial decrease or direction using crystal triangulation technique
Free with trial The image shows a computer screen displaying a stock market chart with a downward trend. The chart features a red line with arrows indicating a decline, and various percentage values are marked along the graph. Decrease stock illustrations Stock market downtrend displayed on screen. The image shows a computer screen displaying a stock market chart with a downward trend. The chart features a red. The image shows a computer screen displaying a stock market chart with a downward trend. The chart features a red line with arrows indicating a decline, and various percentage values are marked along the graph
Free with trial Stock market chart displaying data and financial analysis. Green and red candles show trading on background. Investment indicators and performance trends. Decrease stock illustrations Stock market chart data and financial analysis. Stock market chart displaying data and financial analysis. Green and red candles show trading on background. Stock market chart displaying data and financial analysis. Green and red candles show trading on background. Investment indicators and performance trends
Free with trial Businessman pointing at a negative sign and stock market basket vector illustration. Finance, investment, economy, recession, crisis, loss. Professional gesturing to a market decrease symbol. Decrease stock vectors Financial Analyst Presenting Market Decline Data and Negative Trend Vector Illustration. Businessman pointing at a negative sign and stock market basket vector. Businessman pointing at a negative sign and stock market basket vector illustration. Finance, investment, economy, recession, crisis, loss. Professional gesturing to a market decrease symbol
Free with trial Bull and bear economy concept. With 3d rendering bull and bear on stock market chart background. Decrease stock illustrations Bull and bear economy concept. With 3d rendering bull and bear on stock market chart background
Free with trial Close-up of a hand sketching a stock market trend line chart with chalk on a blackboard, showing price fluctuations over time. Decrease stock illustrations Hand drawing stock market graph on chalkboard. Close-up of a hand sketching a stock market trend line chart with chalk on a blackboard, showing price. Close-up of a hand sketching a stock market trend line chart with chalk on a blackboard, showing price fluctuations over time
Free with trial A computer screen displaying a stock market graph with red and green bars. the graph shows the stock's performance over time, with the x-axis representing time and the y-axis representing price. the red and green bars indicate the stock's price movements, with red indicating a decrease in price and green indicating an increase. the graph also includes several lines that represent different moving. This image was generated using artificial intelligence. Decrease stock illustrations A computer screen displaying a stock market graph with red and green bars. The graph shows the stock's performance over time, with the x-axis representing time
Free with trial 3d render closeup of computer keyboard with NIKKEI 225 index button. Stock market indexes concept. Decrease stock illustrations 3d render of computer keyboard with NIKKEI 225 index button. 3d render closeup of computer keyboard with NIKKEI 225 index button. Stock market indexes concept. 3d render closeup of computer keyboard with NIKKEI 225 index button. Stock market indexes concept.
Free with trial Dynamic red and blue stock market graph with data points and financial charts on a dark background. Generative AI. Decrease stock illustrations Dynamic red and blue stock market graph with data points and financial charts on a dark background. Generative AI
Free with trial Stock market forecast downfall, investor looks through a telescope to see a red bearish stock market chart. Decrease stock vectors Stock market forecast downfall, investor looks through a telescope to see a red bearish stock market chart.
Free with trial Bull and bear economy concept. With 3d rendering bull and bear on stock market chart background. Decrease stock illustrations Bull and bear economy concept. With 3d rendering bull and bear on stock market chart background
Free with trial A close-up view of a red stock market chart displaying a strong downward trend. Candlestick bars and a fluctuating line graph indicate a significant decline in stock prices. Red arrows point downwards, emphasizing the negative movement. The background is dark with a subtle grid pattern and a bright light source on the left. Decrease stock illustrations Red Stock Market Chart Showing Downward Trend graph. A close-up view of a red stock market chart displaying a strong downward trend. Candlestick bars and a. A close-up view of a red stock market chart displaying a strong downward trend. Candlestick bars and a fluctuating line graph indicate a significant decline in stock prices. Red arrows point downwards, emphasizing the negative movement. The background is dark with a subtle grid pattern and a bright light source on the left
Free with trial A blue-toned image depicting a stock market chart showing a significant downward trend. The chart features white candlestick patterns and moving averages, indicating a bearish market. Red and green bars at the bottom suggest trading volume. The image conveys concepts of financial loss, economic downturn, and investment risk. Decrease stock illustrations Falling Stock Market Chart. A blue-toned image depicting a stock market chart showing a significant downward trend. The chart features white candlestick patterns. A blue-toned image depicting a stock market chart showing a significant downward trend. The chart features white candlestick patterns and moving averages, indicating a bearish market. Red and green bars at the bottom suggest trading volume. The image conveys concepts of financial loss, economic downturn, and investment risk.
Free with trial A detailed red financial graph illustrates a sharp downward trend in stock prices. Candlestick bars and a wavy line graph show a significant decline, with red arrows reinforcing the negative movement. The dark background features a grid, and a bright light emanates from the left side of the image. Decrease stock illustrations Red Financial Graph with Falling Stock Prices stock market. A detailed red financial graph illustrates a sharp downward trend in stock prices. Candlestick bars. A detailed red financial graph illustrates a sharp downward trend in stock prices. Candlestick bars and a wavy line graph show a significant decline, with red arrows reinforcing the negative movement. The dark background features a grid, and a bright light emanates from the left side of the image
Free with trial Dropping graphic arrow. Profit reduction schedule, financial debt graph and income loss 3D arrow vector illustration. Business downturn, company income decline. Decreasing stock market trend forecast. Decrease stock vectors Dropping graphic arrow. Profit reduction schedule, financial debt graph and income loss 3D arrow vector illustration. Business downturn, company income decline
Free with trial This image depicts a jagged, downward-sloping line against a bright yellow background. The line appears to be a stock market graph showing a significant decline over time. Decrease stock illustrations Stock market decline illustrated by downward graph. This image depicts a jagged, downward-sloping line against a bright yellow background. The line appears to be. This image depicts a jagged, downward-sloping line against a bright yellow background. The line appears to be a stock market graph showing a significant decline over time
Free with trial Financial newspaper showing stock market crash. With charts and numbers, concept of financial crisis. Decrease stock illustrations Financial newspaper showing stock market crash. With charts and numbers, concept of financial crisis
Free with trial This dynamic digital artwork displays a vibrant abstract representation of a financial stock market trading chart. Featuring prominent candlestick bars in shades of orange and green, alongside a delicate line graph, it conveys concepts of market volatility, data analytics, and economic trends. Decrease stock illustrations Abstract financial stock market graph with trading candlesticks and line chart, digital data visualization. This dynamic digital artwork displays a vibrant. This dynamic digital artwork displays a vibrant abstract representation of a financial stock market trading chart. Featuring prominent candlestick bars in shades of orange and green, alongside a delicate line graph, it conveys concepts of market volatility, data analytics, and economic trends.
Free with trial Financial analysis, performance monitoring, economic crisis, stock market trends, investment risk, data alerts. Sad face and bell symbol near a declining graph. Financial analysis and performance. Decrease stock illustrations Financial Decline and Alert Notification with a Chart and Sad Face Icon. Financial analysis, performance monitoring, economic crisis, stock market trends. Financial analysis, performance monitoring, economic crisis, stock market trends, investment risk, data alerts. Sad face and bell symbol near a declining graph. Financial analysis and performance
Free with trial Red 3d arrow going down stock icon on white background. Bankruptcy, financial market crash icon for your web site design, logo, app, UI. graph chart downtrend symbol. chart going down sign. Decrease stock vectors Red 3d arrow going down stock icon on white background. Bankruptcy, financial market crash icon for your web site design. Logo, app, UI. graph chart downtrend. Red 3d arrow going down stock icon on white background. Bankruptcy, financial market crash icon for your web site design, logo, app, UI. graph chart downtrend symbol.chart going down sign.
Free with trial Red 3d arrow going down stock icon on white background. Bankruptcy, financial market crash icon for your web site design, logo, app, UI. graph chart downtrend symbol. chart going down sign. Decrease stock vectors Red 3d arrow going down stock icon on white background. Bankruptcy, financial market crash icon for your web site design. Logo, app, UI. graph chart downtrend. Red 3d arrow going down stock icon on white background. Bankruptcy, financial market crash icon for your web site design, logo, app, UI. graph chart downtrend symbol.chart going down sign.
Free with trial Stocks and Shares. Comical bird businessman with buy and sell with the stock market falling. Decrease stock vectors Stocks and Shares. Comical bird businessman with buy and sell with the stock market falling
Free with trial Global Economic Crisis, Trading Risks, Defaulted Economy Landing Page Template. Investor Character Bankrupt, Lost Money, Investment Business Finance Decrease at Covid19. Linear Vector Illustration. Decrease stock vectors Global Economic Crisis, Trading Risks, Defaulted Economy Landing Page Template. Investor Character Bankrupt. Lost Money, Investment Business Finance Decrease. Global Economic Crisis, Trading Risks, Defaulted Economy Landing Page Template. Investor Character Bankrupt, Lost Money, Investment Business Finance Decrease at Covid19. Linear Vector Illustration
Free with trial Illustration of a descending bar graph with an arrow signifying decline. Percentage symbol indicates decrease. Minimalist flat style, on black background. Decrease stock vectors Declining bar graph with percentage drop indicator icon. Illustration of a descending bar graph with an arrow signifying decline. Percentage symbol indicates. Illustration of a descending bar graph with an arrow signifying decline. Percentage symbol indicates decrease. Minimalist flat style, on black background.
Free with trial Currency Devaluation Concept with Stock Market Chart and Green Note. Decrease stock illustrations Currency Devaluation Concept with Stock Market Chart and Green Note.
Free with trial 3d renderer illustration. White Business people with red arrow falling. Decrease concept. white background. Decrease stock illustrations 3d White people with red arrow falling. Decrease concept. 3d renderer illustration. White Business people with red arrow falling. Decrease concept. white. 3d renderer illustration. White Business people with red arrow falling. Decrease concept. white background
Free with trial 3d renderer illustration. White Business people with red arrow falling. Decrease concept. white background. Decrease stock illustrations 3d White people with red arrow falling. Decrease concept. 3d renderer illustration. White Business people with red arrow falling. Decrease concept. white. 3d renderer illustration. White Business people with red arrow falling. Decrease concept. white background
Free with trial Line icons about finance. Financial concept. Contains such icons as piggy bank, bank, stock market, investment and accounts. Editable stroke. Vector - 64 pixel perfect grid. Decrease stock vectors Line icons about finance. Financial concept. Pixel perfect 64x64 and editable stroke. Line icons about finance. Financial concept. Contains such icons as piggy. Line icons about finance. Financial concept. Contains such icons as piggy bank, bank, stock market, investment and accounts. Editable stroke. Vector - 64 pixel perfect grid
Free with trial A 3D illustration of a red arrow pointing downward on a graph, indicating a decline or negative trend in business, finance, or economy. The image represents a decrease or loss in value, and can be used to symbolize a crisis, recession, or failure. Decrease stock illustrations A red arrow pointing downward on a graph indicating a decline. A 3D illustration of a red arrow pointing downward on a graph, indicating a decline or negative. A 3D illustration of a red arrow pointing downward on a graph, indicating a decline or negative trend in business, finance, or economy. The image represents a decrease or loss in value, and can be used to symbolize a crisis, recession, or failure.
Free with trial 3d render closeup of computer keyboard with FTSE 100 index button. Stock market indexes concept. Decrease stock illustrations 3d render of computer keyboard with FTSE 100 index button. 3d render closeup of computer keyboard with FTSE 100 index button. Stock market indexes concept. 3d render closeup of computer keyboard with FTSE 100 index button. Stock market indexes concept.
Free with trial A red bear roaring with stock graph, surreal vibrant scene, financial market downturn, dramatic atmosphere, intense emotion. Decrease stock illustrations Red bear roaring with stock graph, surreal vibrant scene, financial market downturn, dramatic atmosphere, intense emotion. A red bear roaring with stock graph. A red bear roaring with stock graph, surreal vibrant scene, financial market downturn, dramatic atmosphere, intense emotion
Free with trial A 3D cartoon-style illustration of a hand wearing a blue suit sleeve holding a smartphone. The screen displays a financial trading application showing a bearish stock market chart with red candlesticks, a downward-pointing red arrow, and a red "SELL" button. This minimalist graphic represents financial loss, economic recession, stock market crash, cryptocurrency decline, and mobile trading. Ideal for business, finance, investment, and technology-related concepts, articles, and presentations. Decrease stock vectors 3D Hand Holding Smartphone with Falling Stock Market Chart. A 3D cartoon-style illustration of a hand wearing a blue suit sleeve holding a smartphone. The screen. A 3D cartoon-style illustration of a hand wearing a blue suit sleeve holding a smartphone. The screen displays a financial trading application showing a bearish stock market chart with red candlesticks, a downward-pointing red arrow, and a red "SELL" button. This minimalist graphic represents financial loss, economic recession, stock market crash, cryptocurrency decline, and mobile trading. Ideal for business, finance, investment, and technology-related concepts, articles, and presentations.
Free with trial A digital illustration of stock market data visualization, featuring green and red arrows on a dark background. The image includes various charts and graphs, with numbers and symbols indicating market trends. The green arrows point upwards, suggesting growth and increase, while the red arrows point downwards, indicating decline and decrease. This image can be used to represent financial analysis, market fluctuations, and economic trends. Decrease stock illustrations Stock market data visualization with green and red arrows. A digital illustration of stock market data visualization, featuring green and red arrows on a dark. A digital illustration of stock market data visualization, featuring green and red arrows on a dark background. The image includes various charts and graphs, with numbers and symbols indicating market trends. The green arrows point upwards, suggesting growth and increase, while the red arrows point downwards, indicating decline and decrease. This image can be used to represent financial analysis, market fluctuations, and economic trends.
Free with trial Money loss and economic crisis, money market crash and global financial downturn, vector line icons. Economic crisis icons of bankruptcy, price decrease with money inflation and unemployment growth. Decrease stock vectors Money loss and economic crisis, money market crash. And global financial downturn, vector line icons. Economic crisis icons of bankruptcy, price decrease with. Money loss and economic crisis, money market crash and global financial downturn, vector line icons. Economic crisis icons of bankruptcy, price decrease with money inflation and unemployment growth
Free with trial Money loss and economic crisis, money market crash and global financial downturn, vector line icons. Economic crisis icons of bankruptcy, price decrease with money inflation and unemployment growth. Decrease stock vectors Money loss and economic crisis, money market crash. And global financial downturn, vector line icons. Economic crisis icons of bankruptcy, price decrease with. Money loss and economic crisis, money market crash and global financial downturn, vector line icons. Economic crisis icons of bankruptcy, price decrease with money inflation and unemployment growth
Free with trial A clean, minimalist icon representing the stock market. The image features a bull and a bear, symbolizing market trends, with a rising green arrow indicating an upward trend. The design is enclosed in a circular frame, suitable for financial reports, investment presentations, or business infographics. The simple line art style makes it versatile for various applications. Decrease stock illustrations Stock Market Bull and Bear Trend Icon. A clean, minimalist icon representing the stock market. The image features a bull and a bear, symbolizing market trends. A clean, minimalist icon representing the stock market. The image features a bull and a bear, symbolizing market trends, with a rising green arrow indicating an upward trend. The design is enclosed in a circular frame, suitable for financial reports, investment presentations, or business infographics. The simple line art style makes it versatile for various applications.
Free with trial Close-up of neatly stacked coins, arranged in an ascending and descending pattern, symbolizing financial growth, savings, and investment progress. The blurred background features a dynamic financial market chart with glowing lines, representing stock market trends, economic data, or cryptocurrency fluctuations. This image effectively illustrates concepts of wealth management, business success, risk, and the fluctuating nature of the global economy. It's ideal for financial articles, presentations, and advertisements related to banking, investment, budgeting, and economic analysis. Decrease stock illustrations Financial Growth Concept with Stacks of Coins and Stock Market Chart. Close-up of neatly stacked coins, arranged in an ascending and descending pattern. Close-up of neatly stacked coins, arranged in an ascending and descending pattern, symbolizing financial growth, savings, and investment progress. The blurred background features a dynamic financial market chart with glowing lines, representing stock market trends, economic data, or cryptocurrency fluctuations. This image effectively illustrates concepts of wealth management, business success, risk, and the fluctuating nature of the global economy. It's ideal for financial articles, presentations, and advertisements related to banking, investment, budgeting, and economic analysis.
Free with trial An investor holds his head as a stock market chart arrow crashes down into the dirt. In a 3-d illustration. Decrease stock illustrations An investor holds his head as a stock market chart arrow crashes down into the dirt. In a 3-d illustration
Free with trial A bold, three-dimensional red arrow illustrates a sharp downward trend, resembling a stock market graph or financial chart. The arrow's segmented, zigzagging path signifies decline, loss, or negative performance. Isolated on a transparent background, this graphic is versatile for representing economic downturns, business failures, or any concept of decrease and regression. Decrease stock illustrations Red Arrow Graph Showing Downward Trend. A bold, three-dimensional red arrow illustrates a sharp downward trend, resembling a stock market graph or financial. A bold, three-dimensional red arrow illustrates a sharp downward trend, resembling a stock market graph or financial chart. The arrow's segmented, zigzagging path signifies decline, loss, or negative performance. Isolated on a transparent background, this graphic is versatile for representing economic downturns, business failures, or any concept of decrease and regression.
Free with trial 3D Vector Conceptual Illustration of Cost Reduction, Falling Rate of Profit, Price Minimising, Dollar Rate Decrease. Decrease stock illustrations 3D Vector Conceptual Illustration of Cost Reduction, Falling Rate of Profit. 3D Vector Conceptual Illustration of Cost Reduction, Falling Rate of Profit, Price. 3D Vector Conceptual Illustration of Cost Reduction, Falling Rate of Profit, Price Minimising, Dollar Rate Decrease.
Free with trial Market red arrow down illustration decline decrease, drop fall, turn recession market red arrow down. Decrease stock illustrations Market red arrow down. Illustration decline decrease, drop fall, turn recession AI generated. market red arrow down illustration decline decrease, drop fall, turn recession market red arrow down
Free with trial Isometric Financial Crisis. People in panic watching chart representing stock market crash during covid19 financial crisis isometric vector illustration. Decrease stock vectors Isometric Financial Crisis. People in panic watching chart representing stock market crash during covid19 financial crisis isometric vector illustration
Free with trial Conceptual financial illustration of a falling stock market index. Red line graph showing sharp decline, volatility, and economic crisis point with a target circle on a dark grid background. Decrease stock illustrations Red stock market graph showing economic crash and financial crisis on dark background. Conceptual financial illustration of a falling stock market index. Red. Conceptual financial illustration of a falling stock market index. Red line graph showing sharp decline, volatility, and economic crisis point with a target circle on a dark grid background.
Free with trial Business graph trending downwards indicating financial loss and economic recession. Red arrow pointing down on white backdrop. Decrease stock illustrations Red downward trending graph indicating financial decrease and economic recession on white background. Business graph trending downwards indicating financial loss. Business graph trending downwards indicating financial loss and economic recession. Red arrow pointing down on white backdrop
Free with trial Dollar Drop. National Currency Market Crash. Gold Coins Value Decrease. Forex Crisis. Investment Loss. Negative Financial Schedule. Cartoon Frustrated Traders on Money Stacks. Vector Flat Illustration. Decrease stock vectors Forex Crisis Currency Market Crash Flat Poster. Dollar Drop. National Currency Market Crash. Gold Coins Value Decrease. Forex Crisis. Investment Loss. Negative. Dollar Drop. National Currency Market Crash. Gold Coins Value Decrease. Forex Crisis. Investment Loss. Negative Financial Schedule. Cartoon Frustrated Traders on Money Stacks. Vector Flat Illustration
Free with trial US dollar tumbling down as symbol for inflation and devaluation. Digital financial visualization of red stock market graph line trending downward on a dark background. Economic falling and recession. Generative Ai. Decrease stock illustrations US dollar tumbling down as symbol for inflation and devaluation. Digital financial visualization of red stock market graph line. Trending downward on a dark. US dollar tumbling down as symbol for inflation and devaluation. Digital financial visualization of red stock market graph line trending downward on a dark background. Economic falling and recession. Generative Ai
Free with trial A thick, red, zigzagging line, potentially a stock chart, is superimposed over a dark background with glowing green and red data points and lines. Image. Decrease stock illustrations Red Zigzag Line Overlaying Financial Data. A thick, red, zigzagging line, potentially a stock chart, is superimposed over a dark background with glowing green. A thick, red, zigzagging line, potentially a stock chart, is superimposed over a dark background with glowing green and red data points and lines. Image
Free with trial Set line Mobile stock trading, Contract money and pen and Global economic crisis on seamless pattern. Vector. Decrease stock illustrations Set line Mobile stock trading, Contract money and pen and Global economic crisis on seamless pattern. Vector.
Free with trial 3d render closeup of computer keyboard with bear and NIKKEI 225 index button. Stock market indexes concept. Decrease stock illustrations 3d render of computer keyboard with bear and NIKKEI 225 index b. 3d render closeup of computer keyboard with bear and NIKKEI 225 index button. Stock market. 3d render closeup of computer keyboard with bear and NIKKEI 225 index button. Stock market indexes concept.
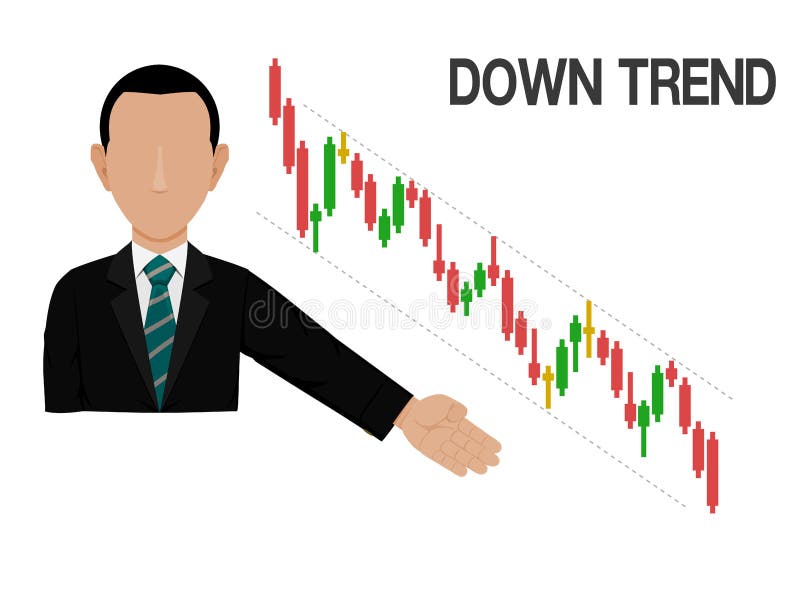
Free with trial Down trend. An investor is presenting down trend of stock chartn. Decrease stock vectors Down trend. An investor is presenting down trend of stock chartn
Free with trial A close-up view of a computer monitor displaying a stark red downward trend graph, symbolizing a stock market crash, financial crisis, or economic recession. The jagged red line dramatically plunges, culminating in a prominent red arrow pointing sharply downwards. The screen also shows various financial data, numbers, and symbols, all illuminated in red against a dark background. The monitor rests on a dark, reflective surface, with blurred background screens further displaying similar red financial data, emphasizing a widespread downturn. The overall atmosphere is urgent and indicative of significant financial loss and market instability. Decrease stock illustrations Stock Market Crash Red Downward Trend Graph Displayed on Screen. A close-up view of a computer monitor displaying a stark red downward trend graph, symbolizing a. A close-up view of a computer monitor displaying a stark red downward trend graph, symbolizing a stock market crash, financial crisis, or economic recession. The jagged red line dramatically plunges, culminating in a prominent red arrow pointing sharply downwards. The screen also shows various financial data, numbers, and symbols, all illuminated in red against a dark background. The monitor rests on a dark, reflective surface, with blurred background screens further displaying similar red financial data, emphasizing a widespread downturn. The overall atmosphere is urgent and indicative of significant financial loss and market instability.
Free with trial A dramatic visual representation of a stock market crash, featuring a downward trending red candlestick chart against a dark, grid-like background. Numbers and financial data are subtly visible, emphasizing the financial context. This image evokes feelings of loss, recession, and economic downturn, making it ideal for illustrating financial crises, market volatility, and investment risks. Decrease stock illustrations Red Stock Market Crash Chart. A dramatic visual representation of a stock market crash, featuring a downward trending red candlestick chart against a dark, grid. A dramatic visual representation of a stock market crash, featuring a downward trending red candlestick chart against a dark, grid-like background. Numbers and financial data are subtly visible, emphasizing the financial context. This image evokes feelings of loss, recession, and economic downturn, making it ideal for illustrating financial crises, market volatility, and investment risks.
Free with trial Bad stock market chart and sad bear. Decrease stock illustrations Bad stock market chart and sad bear.
Free with trial This striking stock photo features the bold black number '500' prominently displayed against a clean, white background. A soft spotlight effect illuminates the number, creating a sense of focus and importance. The minimalist design makes it versatile for various commercial applications, ideal for representing milestones, quantities, achievements, financial figures, or countdowns. Its clean aesthetic ensures it will stand out in presentations, websites, advertising, and marketing materials. Decrease stock illustrations Black Number 500 Isolated on White Background with Spotlight Effect - Commercial Stock Photo. This striking stock photo features the bold black number '500'. This striking stock photo features the bold black number '500' prominently displayed against a clean, white background. A soft spotlight effect illuminates the number, creating a sense of focus and importance. The minimalist design makes it versatile for various commercial applications, ideal for representing milestones, quantities, achievements, financial figures, or countdowns. Its clean aesthetic ensures it will stand out in presentations, websites, advertising, and marketing materials.
Free with trial Bitcoin cryptocurrency value price fall drop. Stock market trading graph business with red arrow concept background 3d illustration. Decrease stock illustrations Bitcoin cryptocurrency value price fall drop. Stock market trading graph business with red arrow concept banner background 3d. Bitcoin cryptocurrency value price. Bitcoin cryptocurrency value price fall drop. Stock market trading graph business with red arrow concept background 3d illustration
Free with trial Stacked money gold coins with green up arrow and red down arrow, stock market trend icon, finance symbol, investment, profit, and loss, perfect for design and communication illustration. Decrease stock vectors Stacked money gold coins with green up arrow and red down arrow, stock market trend icon, finance symbol, investment, profit, and. Loss, perfect for design and. stacked money gold coins with green up arrow and red down arrow, stock market trend icon, finance symbol, investment, profit, and loss, perfect for design and communication illustration.
Free with trial Diagram and graph icons with long shadow, stock vector. Decrease stock vectors Diagram and graph icons with long shadow. Stock vector
Free with trial Sales decrease Lower than the target , vector illustration business cartoon concept. Decrease stock vectors Sales decrease Lower than the target. Vector illustration business cartoon concept
 Sign in