Free with trial Covid-19 horseshoe magnet pulling graph to decrease. Coronavirus pandemic, economic crisis, recession and investment concept. Flat design. EPS 8 vector illustration, no transparency, no gradients. Decrease stock vectors Covid-19 magnet, recession. Covid-19 horseshoe magnet pulling graph to decrease. Coronavirus pandemic, economic crisis, recession and investment concept. Flat. Covid-19 horseshoe magnet pulling graph to decrease. Coronavirus pandemic, economic crisis, recession and investment concept. Flat design. EPS 8 vector illustration, no transparency, no gradients
Free with trial Red glowing line graph with scattered particles illustrating financial decline, economic crisis, recession, or stock market crash. Decrease stock illustrations Falling red data line showing market crash. Red glowing line graph with scattered particles illustrating financial decline, economic crisis, recession, or stock. Red glowing line graph with scattered particles illustrating financial decline, economic crisis, recession, or stock market crash
Free with trial A 3D rendered candlestick stock market chart displays a downward trend. Green bars, indicating upward movement, are followed by red bars, signifying a decline. The chart is angled diagonally across a white background, with a subtle shadow cast beneath it, emphasizing the concept of financial loss or market downturn. Decrease stock illustrations Downward Trending Stock Market Candlestick Chart with Red and Green Bars on a White Background. A 3D rendered candlestick stock market chart displays a downward. A 3D rendered candlestick stock market chart displays a downward trend. Green bars, indicating upward movement, are followed by red bars, signifying a decline. The chart is angled diagonally across a white background, with a subtle shadow cast beneath it, emphasizing the concept of financial loss or market downturn
Free with trial Indian Rupee crisis concept, Red Indian Rupee Symbol Down to Ground. 3D rendering isolated on stock market background. Decrease stock illustrations Indian Rupee crisis concept, Red Indian Rupee Symbol Down to Ground. 3D rendering isolated on stock market background
Free with trial Indian Rupee crisis concept, Red Indian Rupee Symbol Down to Ground. 3D rendering on stock market background. Decrease stock illustrations Indian Rupee crisis concept, Red Indian Rupee Symbol Down to Ground. 3D rendering on stock market background
Free with trial Indian Rupee crisis concept, Red Indian Rupee Symbol Down to Ground. 3D rendering isolated on stock market background. Decrease stock illustrations Indian Rupee crisis concept, Red Indian Rupee Symbol Down to Ground. 3D rendering isolated on stock market background
Free with trial Indian Rupee crisis concept, Red Indian Rupee Symbol Down to Ground. 3D rendering on stock market background. Decrease stock illustrations Indian Rupee crisis concept, Red Indian Rupee Symbol Down to Ground. 3D rendering on stock market background
Free with trial A close-up shot of a smartphone displaying a stock market chart, showing fluctuating prices. The dark theme enhances the visual impact of the pink graph line, generated by AI for a modern and sleek aesthetic. This image is perfect for illustrating financial technology, mobile trading, and investmen. Decrease stock illustrations Mobile Stock Market Chart. A close-up shot of a smartphone displaying a stock market chart, showing fluctuating prices. The dark theme enhances the visual impact. A close-up shot of a smartphone displaying a stock market chart, showing fluctuating prices. The dark theme enhances the visual impact of the pink graph line, generated by AI for a modern and sleek aesthetic. This image is perfect for illustrating financial technology, mobile trading, and investmen
Free with trial A stark red line graph illustrates a sharp decline in the stock market, symbolizing financial loss, market downturn, and economic recession. Ideal for illustrating concepts of risk, volatility, and investment crisis. Represents negative growth and market fluctuation. Perfect for financial news, reports, and presentations. Generated by AI. Decrease stock illustrations Red stock market graph showing decline trend. A stark red line graph illustrates a sharp decline in the stock market, symbolizing financial loss, market downturn. A stark red line graph illustrates a sharp decline in the stock market, symbolizing financial loss, market downturn, and economic recession. Ideal for illustrating concepts of risk, volatility, and investment crisis. Represents negative growth and market fluctuation. Perfect for financial news, reports, and presentations. Generated by AI.
Free with trial Financial market downturn and global economic crisis. businessman holding falling red stock charts, symbolizing crisis, investment loss, inflation impact, and bearish trend across world economy. Decrease stock illustrations Financial market downturn and global economic crisis. businessman holding falling red stock charts, symbolizing crisis, investment. Loss, inflation impact, and. financial market downturn and global economic crisis. businessman holding falling red stock charts, symbolizing crisis, investment loss, inflation impact, and bearish trend across world economy
Free with trial Tired woman put head on table near laptop seeing falling chart, which means beginning of crisis and financial recession. Business lady filed for bankruptcy due to economic crisis in stock market. Decrease stock vectors Tired woman put head on table near laptop seeing falling chart, which means beginning of crisis. And financial recession. Business lady filed for bankruptcy due. Tired woman put head on table near laptop seeing falling chart, which means beginning of crisis and financial recession. Business lady filed for bankruptcy due to economic crisis in stock market
Free with trial Double exposure economic downturn with gold coin stacks on cubes spelling CRASH. Concept a sharp downward arrow and volatile red financial graphs and stock market collapse. Decrease stock illustrations Double exposure economic downturn with gold coin stacks on cubes spelling CRASH. Concept a sharp downward arrow and volatile red. Financial graphs and stock
Free with trial Analyze the crash in the stock market crash. Learn from investment failure mistakes. Assess the damage from the business sector. Experts find the cause of the stock chart fall. Decrease stock vectors Analyze the crash in the stock market crash. Learn from investment failure mistakes. Assess the damage from the business. Sector. Experts find the cause of the
Free with trial 3d render of keyboard with natural gas button. Stock market concept. Decrease stock illustrations 3d render of keyboard with natural gas button. Stock market concept
Free with trial Economic crisis line icon of real estate value down or property depreciation, vector outline symbol. Real estate value decrease with arrow down icon for global economic crisis and financial downturn. Decrease stock vectors Economic crisis line icon, real estate value down. Economic crisis line icon of real estate value down or property depreciation, vector outline symbol. Real. Economic crisis line icon of real estate value down or property depreciation, vector outline symbol. Real estate value decrease with arrow down icon for global economic crisis and financial downturn
Free with trial Smartphone screen displays declining stock market graph with red arrow. Declining stock market graph on smartphone screen indicates financial loss or crisis. Decrease stock illustrations Smartphone screen displays declining stock market graph with red arrow. Declining stock market graph on smartphone screen indicates financial loss or crisis
Free with trial 3d render closeup of computer keyboard with FTSE 100 index button. Stock market indexes concept. Decrease stock illustrations 3d render of computer keyboard with FTSE 100 index button. 3d render closeup of computer keyboard with FTSE 100 index button. Stock market indexes concept. 3d render closeup of computer keyboard with FTSE 100 index button. Stock market indexes concept.
Free with trial Black lightning shaped arrow on ominous red background. Crisis, problem, decrease, recession, risk and danger concept. Flat design. EPS 8 vector illustration, no transparency, no gradients. Decrease stock vectors Lightning arrow, crisis concept. Black lightning shaped arrow on ominous red background. Crisis, problem, decrease, recession, risk and danger concept. Flat. Black lightning shaped arrow on ominous red background. Crisis, problem, decrease, recession, risk and danger concept. Flat design. EPS 8 vector illustration, no transparency, no gradients
Free with trial Character design and business concept. Illustration of bull vs b. Ear fighting which is symbol of stock market trend. (a series of bull vs bear. Decrease stock illustrations Character design and business concept. Illustration of bull vs b. Ear fighting which is symbol of stock market trend. (a series of bull vs bear
Free with trial This image depicts a candlestick chart, a type of financial chart used to describe price movements of securities, derivatives, or currencies. The chart shows a series of green and red vertical bars, with each bar representing a specific time period. The green bars indicate a price increase, while the red bars indicate a price decrease. Each bar has a rectangular body and thin lines, or wicks,. Decrease stock illustrations Candlestick chart showing the rise and fall of stock prices over time. This image depicts a candlestick chart, a type of financial chart used to describe price. This image depicts a candlestick chart, a type of financial chart used to describe price movements of securities, derivatives, or currencies. The chart shows a series of green and red vertical bars, with each bar representing a specific time period. The green bars indicate a price increase, while the red bars indicate a price decrease. Each bar has a rectangular body and thin lines, or wicks,
Free with trial The image depicts a city map overlaid with stock market trend lines, illustrating various financial movements. Different colored lines represent upward and downward trends with percentage changes, indicating stock performance or indices across different regions. The visual juxtaposition of financial data against a geographical layout highlights how market movements correlate with specific. Decrease stock illustrations Stock market trends and performance analysis on a city map background. The image depicts a city map overlaid with stock market trend lines, illustrating various. The image depicts a city map overlaid with stock market trend lines, illustrating various financial movements. Different colored lines represent upward and downward trends with percentage changes, indicating stock performance or indices across different regions. The visual juxtaposition of financial data against a geographical layout highlights how market movements correlate with specific
Free with trial The image displays two bar graphs representing the stock market activities of buying and selling. The left graph, labeled 'BUY', shows a pyramid structure with increasing bars from bottom to top, indicating a rise in buying activities. The right graph, labeled 'SELL', shows a pyramid structure with decreasing bars from top to bottom, indicating a rise in selling activities. Decrease stock illustrations Stock market buy and sell graphs. The image displays two bar graphs representing the stock market activities of buying and selling. The left graph, labeled 'BUY. The image displays two bar graphs representing the stock market activities of buying and selling. The left graph, labeled 'BUY', shows a pyramid structure with increasing bars from bottom to top, indicating a rise in buying activities. The right graph, labeled 'SELL', shows a pyramid structure with decreasing bars from top to bottom, indicating a rise in selling activities
Free with trial Stock market. The rise and fall of securities. Successful trading. Market trend up green and red down arrows, financial graphs. Business investment growth and loss arrow. Graph going up and down symbol vector illustration. Decrease stock vectors Stock market. The rise and fall of securities. Successful trading. Market trend up green and red down arrows, financial graphs. Business investment growth and
Free with trial Stock market. The rise and fall of securities. Successful trading. Market trend up green and red down arrows, financial graphs. Business investment growth and loss arrow. Graph going up and down symbol vector illustration. Decrease stock vectors Stock market. The rise and fall of securities. Successful trading. Market trend up green and red down arrows, financial graphs. Business investment growth and
Free with trial Stock market. The rise and fall of securities. Successful trading. Market trend up green and red down arrows, financial graphs. Business investment growth and loss arrow. Graph going up and down symbol vector illustration. Decrease stock vectors Stock market. The rise and fall of securities. Successful trading. Market trend up green and red down arrows, financial graphs. Business investment growth and
Free with trial Stock market. The rise and fall of securities. Successful trading. Market trend up green and red down arrows, financial graphs. Business investment growth and loss arrow. Graph going up and down symbol vector illustration. Decrease stock vectors Stock market. The rise and fall of securities. Successful trading. Market trend up green and red down arrows, financial graphs. Business investment growth and
Free with trial Stock market. The rise and fall of securities. Successful trading. Market trend up green and red down arrows, financial graphs. Business investment growth and loss arrow. Graph going up and down symbol vector illustration. Decrease stock vectors Stock market. The rise and fall of securities. Successful trading. Market trend up green and red down arrows, financial graphs. Business investment growth and
Free with trial Stock market. The rise and fall of securities. Successful trading. Market trend up green and red down arrows, financial graphs. Business investment growth and loss arrow. Graph going up and down symbol vector illustration. Decrease stock vectors Stock market. The rise and fall of securities. Successful trading. Market trend up green and red down arrows, financial graphs. Business investment growth and
Free with trial Covid 19 coronavirus sketch and falling graph over blurry blue background. Financial and stock market crash concept. 3d rendering. Decrease stock illustrations Coronavirus covid 19 market crash concept. Covid 19 coronavirus sketch and falling graph over blurry blue background. Financial and stock market crash concept. Covid 19 coronavirus sketch and falling graph over blurry blue background. Financial and stock market crash concept. 3d rendering
Free with trial A smartphone displaying a downward stock market trend graph with stacks of gold coins around it. Decrease stock illustrations Smartphone showing falling stock market graph surrounded by gold coins. A smartphone displaying a downward stock market trend graph with stacks of gold coins. A smartphone displaying a downward stock market trend graph with stacks of gold coins around it
Free with trial Indian Rupee crisis concept, Red Indian Rupee Symbol Down to Ground. 3D rendering. On stock market background. Decrease stock illustrations Indian Rupee crisis concept, Red Indian Rupee Symbol Down to Ground. 3D rendering. On stock market background
Free with trial Trading trends and economic statistics. Decrease stock illustrations Stock market trading graph in red color as economy 3D illustration background. Trading trends and economic statistics. Trading trends and economic statistics.
Free with trial Financial data charts showcasing stock market trends. A display of financial data with charts, graphs, and statistics showing market trends and analysis details. Decrease stock illustrations Financial data charts showcasing stock market trends. A display of financial data with charts, graphs, and statistics showing market trends and analysis details
Free with trial This image shows six neatly stacked piles of coins arranged in descending order from left to right, symbolizing diminishing financial value or wealth. Behind the coins is a transparent screen displaying a detailed stock market chart with candlestick patterns and volume bars, highlighting a significant downward trend marked by a prominent red arrow moving from top left to bottom right. The. Decrease stock illustrations Stacked coins decreasing in size against a falling stock market graph with city skyline background at sunset. This image shows six neatly stacked piles of coins. This image shows six neatly stacked piles of coins arranged in descending order from left to right, symbolizing diminishing financial value or wealth. Behind the coins is a transparent screen displaying a detailed stock market chart with candlestick patterns and volume bars, highlighting a significant downward trend marked by a prominent red arrow moving from top left to bottom right. The
Free with trial Illustration featuring financial turmoil with dramatic downward arrows and distressed figures. Symbols like dollar ($), euro (€), and pound (£) are scattered, along with words like "SELL! ", "PANIC", "CRASH! ", and "BEAR MARKET". A piggy bank breaking symbolizes losses. Bar charts and various percentages emphasize financial decline. The style is cartoonish, using black and white sketches to depict the chaotic atmosphere often associated with stock market crashes or economic downturns. Elements convey urgency and distress in an economic context. Decrease stock vectors Stock Market Crash and Global Financial Crisis Hand Drawn Doodle Concept. Illustration featuring financial turmoil with dramatic downward arrows and distressed. Illustration featuring financial turmoil with dramatic downward arrows and distressed figures. Symbols like dollar ($), euro (€), and pound (£) are scattered, along with words like "SELL!", "PANIC", "CRASH!", and "BEAR MARKET". A piggy bank breaking symbolizes losses. Bar charts and various percentages emphasize financial decline. The style is cartoonish, using black and white sketches to depict the chaotic atmosphere often associated with stock market crashes or economic downturns. Elements convey urgency and distress in an economic context.
Free with trial A minimalist vector icon showing a stack of cardboard boxes with a downward arrow and percentage symbol indicating inventory reduction. Decrease stock vectors Inventory Reduction Icon Representing Lower Stock Levels and Decreasing Supply Chain Boxes Vector Illustration. A minimalist vector icon showing a stack of. A minimalist vector icon showing a stack of cardboard boxes with a downward arrow and percentage symbol indicating inventory reduction
Free with trial Financial data chart, glowing lines, digital display. Stock image showing trends. Decrease stock illustrations Digital financial graph with candlestick chart, data analytics, stock market trend, technology concept. Financial data chart, glowing lines, digital display. Financial data chart, glowing lines, digital display. Stock image showing trends
Free with trial Minimalist 3D set of green upward and red downward arrows, isolated on a white background. Realistic glossy render for financial market analysis, stock trading indicators, profit and loss comparison. Decrease stock vectors Minimalist 3D set of green upward and red downward arrows, isolated on a white background. Realistic glossy render for financial market analysis, stock trading
Free with trial Close-up of a man holding a tablet showing a stock market crash graph. The image represents financial loss, economic recession, and investment risks. Decrease stock illustrations Analyzing Stock Market Downturn on Tablet Device. Close-up of a man holding a tablet showing a stock market crash graph. The image represents financial loss. Close-up of a man holding a tablet showing a stock market crash graph. The image represents financial loss, economic recession, and investment risks
Free with trial Digital financial crisis visual with downward arrow impacting a stock chart on a phone. Decrease stock illustrations Digital Arrow Down on Smartphone Screen Showing Falling Stock Market Chart. Digital financial crisis visual with downward arrow impacting a stock chart on a. Digital financial crisis visual with downward arrow impacting a stock chart on a phone
Free with trial The image depicts a stock market chart with a steep downward trend, highlighted by a large red arrow pointing downwards, indicating a significant decline in stock prices. Decrease stock illustrations A dramatic downward trend in a stock market chart with a prominent red arrow. The image depicts a stock market chart with a steep downward trend, highlighted by. The image depicts a stock market chart with a steep downward trend, highlighted by a large red arrow pointing downwards, indicating a significant decline in stock prices
Free with trial Financial problems line icon of income revenue or budget money decrease, outline vector. Banking business problem or company financial recession and economic decline on market or profit downturn. Decrease stock vectors Financial problems line icon of finance recession. Financial problems line icon of income revenue or budget money decrease, outline vector. Banking business. Financial problems line icon of income revenue or budget money decrease, outline vector. Banking business problem or company financial recession and economic decline on market or profit downturn
Free with trial A striking and impactful collection of illustrations depicting a stock market crash with dramatic downward trend graphs. Decrease stock vectors Stock market crash down graph illustration. A striking and impactful collection of illustrations depicting a stock market crash with dramatic downward trend. A striking and impactful collection of illustrations depicting a stock market crash with dramatic downward trend graphs
Free with trial The image depicts a clear glass dome containing a green stock chart displaying a downward trend, symbolizing a financial decline or market crash. The dome is placed atop a stack of gold coins, representing wealth or economic value. A red arrow points from the chart to the coins, emphasizing the connection between the stock market performance and financial assets. Decrease stock illustrations Financial downturn illustrated by a declining stock chart atop gold coins. The image depicts a clear glass dome containing a green stock chart displaying a. The image depicts a clear glass dome containing a green stock chart displaying a downward trend, symbolizing a financial decline or market crash. The dome is placed atop a stack of gold coins, representing wealth or economic value. A red arrow points from the chart to the coins, emphasizing the connection between the stock market performance and financial assets
Free with trial Vector illustration of dollar rate decrease icon. Money symbol with stretching arrow down. Decrease profit, salary, income, cost, price, economy and revenue. Icon for business concept. Decrease stock vectors Vector illustration of dollar rate decrease icon. Money symbol with stretching arrow down. Decrease profit, salary, income, cost,. Price, economy and revenue. Vector illustration of dollar rate decrease icon. Money symbol with stretching arrow down. Decrease profit, salary, income, cost, price, economy and revenue. Icon for business concept
Free with trial A macro shot of a negative stock chart in the background and the symbol of the company next to the chart. Concept of declining profits and failure. Image is generated using AI. Decrease stock illustrations Stock Price Drop Symbol on Chart. A macro shot of a negative stock chart in the background and the symbol of the company next to the chart. Concept of declining. A macro shot of a negative stock chart in the background and the symbol of the company next to the chart. Concept of declining profits and failure. Image is generated using AI
Free with trial The image shows a stock market graph with two lines, one red and one blue, both trending downwards. In the foreground, there is a stack of gold coins, symbolizing wealth or investment. Decrease stock illustrations A declining stock market graph with a stack of gold coins in the foreground. The image shows a stock market graph with two lines, one red and one blue, both. The image shows a stock market graph with two lines, one red and one blue, both trending downwards. In the foreground, there is a stack of gold coins, symbolizing wealth or investment
Free with trial Digital stock market falling graph and blurry coronavirus. Concept of stock market crash due to covid 19 coronavirus pandemic. 3d rendering toned image double exposure. Decrease stock illustrations Coronavirus market crash and financial crisis. Digital stock market falling graph and blurry coronavirus. Concept of stock market crash due to covid 19. Digital stock market falling graph and blurry coronavirus. Concept of stock market crash due to covid 19 coronavirus pandemic. 3d rendering toned image double exposure
Free with trial Financial candlestick charts showing stock market trading data over an abstract blurred city lights background during nighttime. Decrease stock illustrations Financial market data showing city trading analysis. Financial candlestick charts showing stock market trading data over an abstract blurred city lights. Financial candlestick charts showing stock market trading data over an abstract blurred city lights background during nighttime
Free with trial A simple illustration of a declining blue bar graph against a black background. Represents loss or decrease. Decrease stock vectors Declining bar graph demonstrating financial loss and recession illustration. A simple illustration of a declining blue bar graph against a black background. A simple illustration of a declining blue bar graph against a black background. Represents loss or decrease.
Free with trial Economic crisis down graph color line icon of businessman silhouette showing chart with falling arrow. Vector finance recession, economic downturn and business decrease, money loss, and bankruptcy. Decrease stock illustrations Economic crisis downward graph color line icon. Economic crisis down graph color line icon of businessman silhouette showing chart with falling arrow. Vector. Economic crisis down graph color line icon of businessman silhouette showing chart with falling arrow. Vector finance recession, economic downturn and business decrease, money loss, and bankruptcy
Free with trial A detailed financial chart showing a downward trend in stock prices, represented by red candlesticks and a downward arrow. Decrease stock illustrations Downward stock market trend with red candlesticks. A detailed financial chart showing a downward trend in stock prices, represented by red candlesticks and a. A detailed financial chart showing a downward trend in stock prices, represented by red candlesticks and a downward arrow
Free with trial Black Downward Trend Arrow Icon with Dashed Line Elements. Decrease stock illustrations A stylized black icon representing a downward trend or decrease, featuring a sharp arrow pointing down and to the right,. Black Downward Trend Arrow Icon with. Black Downward Trend Arrow Icon with Dashed Line Elements
Free with trial Black dollar sign icon with a bold downward arrow, representing money loss, decreasing value, or falling stock prices in finance and business. Decrease stock illustrations Dollar sign with downward arrow symbolizing financial loss or stock decline. Black dollar sign icon with a bold downward arrow, representing money loss. Black dollar sign icon with a bold downward arrow, representing money loss, decreasing value, or falling stock prices in finance and business
Free with trial Flat graphic showing a dollar coin with arrows illustrating market fluctuation and volatility, styled as flat cartoon icon. Decrease stock vectors Investment Fluctuation Illustration Showing Increase and Decrease of Capital. Flat graphic showing a dollar coin with arrows illustrating market fluctuation and. Flat graphic showing a dollar coin with arrows illustrating market fluctuation and volatility, styled as flat cartoon icon.
Free with trial 3d render of keyboard with natural gas button. Stock market concept. Decrease stock illustrations 3d render of keyboard with natural gas button. Stock market concept
Free with trial Black Bold Line Graph Arrow Pointing Downward Trend Icon. Decrease stock vectors A simple black icon illustrating a line graph with a downward trend indicated by an arrow, symbolizing decline or decrease. Black Bold Line Graph Arrow Pointing. Black Bold Line Graph Arrow Pointing Downward Trend Icon
Free with trial 3d render of bull and bear over white. 3d render of bull and bear isolated over white background. Stock market symbols concept. Decrease stock illustrations 3d render of bull and bear over white. 3d render of bull and bear isolated over white background. Stock market symbols concept
Free with trial Outline Monoline Dollar Sign Down Arrow Indicating Price Decrease Financial Graphic Icon. Decrease stock illustrations An outline or monoline icon featuring a dollar sign symbol accompanied by a downward-pointing arrow. This graphic clearly. Outline Monoline Dollar Sign Down. Outline Monoline Dollar Sign Down Arrow Indicating Price Decrease Financial Graphic Icon
Free with trial Golden Key on Stock Market Candlestick Chart Background, Trading Success Concept. Metallic key floating before digital stock chart with red blue bars. Decrease stock illustrations Golden Key on Stock Market Candlestick Chart Background, Trading Success Concept. Metallic key floating before digital stock chart with red blue bars
Free with trial Recession Financial Risk Failure down , Business graph with arrows tending Recession , Recession, global economy crisis , Economy crisis, recession. Stock market graph down Recession. Decrease stock illustrations Recession Financial Risk Failure down , Business graph with arrows tending Recession , Recession, global economy crisis , Economy. Crisis, recession. Stock. Recession Financial Risk Failure down , Business graph with arrows tending Recession , Recession, global economy crisis , Economy crisis, recession. Stock market graph down Recession
Free with trial 3d render closeup of computer keyboard with CAC 40 index button. Stock market indexes concept. Decrease stock illustrations 3d render of computer keyboard with CAC 40 index button. 3d render closeup of computer keyboard with CAC 40 index button. Stock market indexes concept. 3d render closeup of computer keyboard with CAC 40 index button. Stock market indexes concept.
Free with trial Indian Rupee crisis concept, Red Indian Rupee Symbol Down to Ground. 3D rendering. On stock market background. Decrease stock illustrations Indian Rupee crisis concept, Red Indian Rupee Symbol Down to Ground. 3D rendering. On stock market background
Free with trial Coronavirus or COVID-19 impact on global economy, stock market down and fall, financial crisis concept, vector flat illustration. Decrease stock vectors Coronavirus or COVID-19 impact on global economy. Stock market down and fall, financial crisis concept, vector flat illustration
Free with trial This image depicts a stock market graph with a clear upward trend, featuring significant fluctuations and notable peaks and troughs over a specified period. The graph includes trend lines and an arrow indicating the overall upward movement. Decrease stock illustrations Stock market graph showing upward trend with significant fluctuations over time. This image depicts a stock market graph with a clear upward trend, featuring. This image depicts a stock market graph with a clear upward trend, featuring significant fluctuations and notable peaks and troughs over a specified period. The graph includes trend lines and an arrow indicating the overall upward movement
Free with trial Coronavirus Covid-19 outbreak and business recession concept, wireframe dot and line virus shape stock graph downing, metaphor declining economy and business failure when virus disease, global crisis. Decrease stock vectors Covid-19 Coronavirus with failure business 001. Coronavirus Covid-19 outbreak and business recession concept, wireframe dot and line virus shape stock graph. Coronavirus Covid-19 outbreak and business recession concept, wireframe dot and line virus shape stock graph downing, metaphor declining economy and business failure when virus disease, global crisis
Free with trial Oil barrels on stacks of golden coins and oil pump jack with market price chart. Decline of oil stock prices and extraction of oil. Concept. 3d illustration. Decrease stock illustrations Oil barrels on stacks of golden coins and oil pump jack with market price chart. Decline of oil stock prices and extraction of oil. Concept. 3d illustration
Free with trial Financial crisis. Poor man with empty pockets watching falling arrow. Cartoon employee character losing money, economy recession concept vector. Company bankruptcy or income decrease. Decrease stock vectors Financial crisis. Poor man with empty pockets watching falling arrow. Cartoon employee character losing money. Economy recession concept vector. Company. Financial crisis. Poor man with empty pockets watching falling arrow. Cartoon employee character losing money, economy recession concept vector. Company bankruptcy or income decrease
Free with trial STOCK MARKET icon series highlighting solid business graphics of bear market, candlestick chart, crypto exchange, ipo listing, and trade agreement for investment applications. Decrease stock vectors Stock market icon series of bear market, candlestick chart, crypto exchange, IPO listing, and trade agreement. STOCK MARKET icon series highlighting solid. STOCK MARKET icon series highlighting solid business graphics of bear market, candlestick chart, crypto exchange, ipo listing, and trade agreement for investment applications.
Free with trial An abstract and futuristic visualization of a financial trading chart on a dark, cosmic background. The image features a candlestick graph transitioning from a volatile red phase into a clear bullish, upward trend in blue. This dynamic concept represents stock market growth, forex trading, cryptocurrency investment, and financial success. It's an ideal background for topics related to fintech, data analysis, economic recovery, and modern investment strategies, symbolizing progress and profitability in the digital economy. Decrease stock illustrations Futuristic Stock Market Trading Graph Background. An abstract and futuristic visualization of a financial trading chart on a dark, cosmic background. The image. An abstract and futuristic visualization of a financial trading chart on a dark, cosmic background. The image features a candlestick graph transitioning from a volatile red phase into a clear bullish, upward trend in blue. This dynamic concept represents stock market growth, forex trading, cryptocurrency investment, and financial success. It's an ideal background for topics related to fintech, data analysis, economic recovery, and modern investment strategies, symbolizing progress and profitability in the digital economy.
Free with trial The image displays a financial stock market chart with various colored candlesticks and multiple technical indicators overlaid on a grid background. Decrease stock illustrations Detailed financial stock market chart with technical indicators and price movements. The image displays a financial stock market chart with various colored. The image displays a financial stock market chart with various colored candlesticks and multiple technical indicators overlaid on a grid background
Free with trial The stock market crash is depicted with a red graph, symbolizing financial loss and economic decline. The crisis represents a significant downturn in investment. Decrease stock illustrations Stock market crash with red graph. The stock market crash is depicted with a red graph, symbolizing financial loss and economic decline. The crisis represents a. The stock market crash is depicted with a red graph, symbolizing financial loss and economic decline. The crisis represents a significant downturn in investment.
Free with trial Conceptual image symbolizes a downward trend with golden arrow breaking through a silver line graph. This could represent economic decline, financial crisis, or a stock market crash. 3D rendering. Decrease stock illustrations Downward Trend Arrow, Economic Decline, Stock Market Crash. Conceptual image symbolizes a downward trend with golden arrow breaking through a silver line graph. Conceptual image symbolizes a downward trend with golden arrow breaking through a silver line graph. This could represent economic decline, financial crisis, or a stock market crash. 3D rendering.
Free with trial The image shows a stock market crash represented by a downward-sloping line graph against a backdrop of a galaxy filled with stars and nebulous clouds. the line graph, rendered in a light purple hue, indicates a significant decline, culminating in a sharp drop represented by an arrow pointing downwards. the background galaxy adds a dramatic and symbolic layer, suggesting a cosmic scale of economic downturn. Decrease stock illustrations Stock market crash in a galaxy background. The image shows a stock market crash represented by a downward-sloping line graph against a backdrop of a galaxy. the image shows a stock market crash represented by a downward-sloping line graph against a backdrop of a galaxy filled with stars and nebulous clouds. the line graph, rendered in a light purple hue, indicates a significant decline, culminating in a sharp drop represented by an arrow pointing downwards. the background galaxy adds a dramatic and symbolic layer, suggesting a cosmic scale of economic downturn.
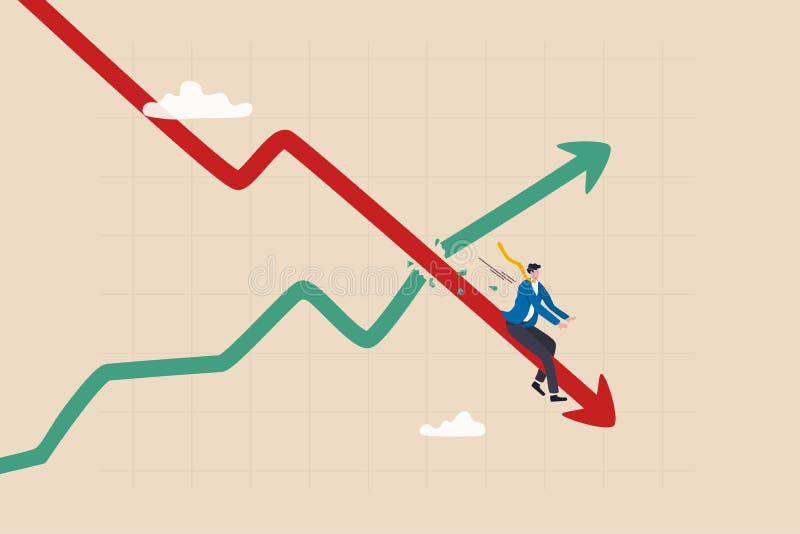
Free with trial Stagflation, economic slow down or recession while inflation high up, GDP growth decrease causing by unemployment concept, fearful businessman riding fall down economic graph with inflation high up. Decrease stock vectors Stagflation, economic slow down or recession while inflation high up, GDP growth decrease causing by unemployment concept, fearful. Businessman riding fall down. Stagflation, economic slow down or recession while inflation high up, GDP growth decrease causing by unemployment concept, fearful businessman riding fall down economic graph with inflation high up
Free with trial The image shows a financial dashboard with a stock price chart, a significant upward trend arrow, and various metrics. The chart indicates a stock price of 1,219 with. Decrease stock illustrations Financial dashboard displaying stock market performance with upward trend indicator. The image shows a financial dashboard with a stock price chart, a. The image shows a financial dashboard with a stock price chart, a significant upward trend arrow, and various metrics. The chart indicates a stock price of 1,219 with
Free with trial A vibrant red, three-dimensional zigzag arrow sharply points downwards and to the right, set against a transparent background. This striking graphic effectively symbolizes decline, loss, and negative trends across various sectors. It is ideal for illustrating financial downturns, market crashes, economic recessions, falling stock prices, or any situation depicting a decrease in performance. Perfect for business presentations, financial reports, infographics, and news articles requiring a clear visual representation of a downward trajectory or crisis. Decrease stock illustrations Red Downward Zigzag Arrow on Transparent Background. A vibrant red, three-dimensional zigzag arrow sharply points downwards and to the right, set against a. A vibrant red, three-dimensional zigzag arrow sharply points downwards and to the right, set against a transparent background. This striking graphic effectively symbolizes decline, loss, and negative trends across various sectors. It is ideal for illustrating financial downturns, market crashes, economic recessions, falling stock prices, or any situation depicting a decrease in performance. Perfect for business presentations, financial reports, infographics, and news articles requiring a clear visual representation of a downward trajectory or crisis.
Free with trial Joyful and sad businessman stands next to chart showing growth or decline. Investment statistic. Economy crisis. Financial recession. Business failure. Increase or decrease infographic. Vector concept. Decrease stock vectors Joyful and sad businessman stands next to chart showing growth or decline. Investment statistic. Economy crisis. Financial. Recession. Business failure. Joyful and sad businessman stands next to chart showing growth or decline. Investment statistic. Economy crisis. Financial recession. Business failure. Increase or decrease infographic. Vector concept
Free with trial 3D bar and line chart showing stock market performance with percentage gains and candlestick patterns. Decrease stock vectors Financial stock market growth chart with percentage gains and candlestick indicators. 3D bar and line chart showing stock market performance with percentage. 3D bar and line chart showing stock market performance with percentage gains and candlestick patterns
 Sign in