Free with trial A visual representation of a stock market crash, showing falling arrows and declining charts. Illustrates financial crisis, economic downturn, and investment loss. A symbolic depiction of recession. Diagram financial growth decrease illustrations Stock market crash financial crisis recession investment loss downward trend economic downturn chart analysis. A visual representation of a stock market crash, showing falling arrows and declining charts. Illustrates financial crisis, economic downturn, and investment loss. A symbolic depiction of recession.
Free with trial Global economic slowdown, businessman is using a slow snail to represent the gradual growth of GDP in the world economy. Diagram financial growth decrease vectors Global economic slowdown, businessman is using a slow snail to represent the gradual growth of GDP in the world economy
Free with trial A 3D render of a blue bar chart displaying a downward trend, with bars decreasing in height from left to right. The background features a subtle pattern of translucent upward-pointing arrows, suggesting growth or recovery despite the current decline. The scene is set against a clean, gradient gray backdrop with reflections, creating a modern and professional aesthetic. This image is ideal for representing financial downturns, market analysis, economic challenges, or the concept of overcoming obstacles. Diagram financial growth decrease illustrations Declining Blue Bar Chart with Upward Arrows Background. A 3D render of a blue bar chart displaying a downward trend, with bars decreasing in height from left to right. The background features a subtle pattern of translucent upward-pointing arrows, suggesting growth or recovery despite the current decline. The scene is set against a clean, gradient gray backdrop with reflections, creating a modern and professional aesthetic. This image is ideal for representing financial downturns, market analysis, economic challenges, or the concept of overcoming obstacles.
Free with trial Red cube with arrow up. Business and market growth concept. Close-up. Diagram financial growth decrease illustrations Red cube with arrow up. Business and market growth concept
Free with trial Red cube with arrow up. Business and market growth concept. Close-up. Diagram financial growth decrease illustrations Red cube with arrow up. Business and market growth concept
Free with trial Red cube with arrow up. Business and market growth concept. Close-up. Diagram financial growth decrease illustrations Red cube with arrow up. Business and market growth concept
Free with trial Red arrows indicate business growth and decline, along with percentage symbols for financial data and market trends. Diagram financial growth decrease vectors Up and down arrows with percentage symbol business icon. Red arrows indicate business growth and decline, along with percentage symbols for financial data and market trends
Free with trial This is an isometric 3D illustration depicting a dynamic data visualization. It features a combination of bar charts and a line graph, showcasing rising trends and fluctuating data points. The color palette includes shades of blue, teal, and coral, creating a modern and professional aesthetic. This graphic is ideal for representing financial reports, business analytics, market trends, growth, and performance metrics in a visually engaging and easy-to-understand format. Diagram financial growth decrease illustrations Isometric 3D Bar and Line Graph with Data Visualization. This is an isometric 3D illustration depicting a dynamic data visualization. It features a combination of bar charts and a line graph, showcasing rising trends and fluctuating data points. The color palette includes shades of blue, teal, and coral, creating a modern and professional aesthetic. This graphic is ideal for representing financial reports, business analytics, market trends, growth, and performance metrics in a visually engaging and easy-to-understand format.
Free with trial A series of seven golden bars, arranged in descending order of height, form a bar chart on a white background. The bars are smooth and reflective, suggesting a metallic material. This visual representation clearly depicts a downward trend or a decline, commonly associated with financial losses, economic recession, or negative performance. Diagram financial growth decrease illustrations Golden Bar Chart Illustrating a Downward Trend on a White Background graph financial. A series of seven golden bars, arranged in descending order of height, form a bar chart on a white background. The bars are smooth and reflective, suggesting a metallic material. This visual representation clearly depicts a downward trend or a decline, commonly associated with financial losses, economic recession, or negative performance
Free with trial Green cube with arrow up. Business and market growth concept. Close-up. Diagram financial growth decrease illustrations Green cube with arrow up. Business and market growth concept
Free with trial Green cube with arrow up. Business and market growth concept. Close-up. Diagram financial growth decrease illustrations Green cube with arrow up. Business and market growth concept
Free with trial Green cube with arrow up. Business and market growth concept. Close-up. Diagram financial growth decrease illustrations Green cube with arrow up. Business and market growth concept
Free with trial Green cube with arrow up. Business and market growth concept. Close-up. Diagram financial growth decrease illustrations Green cube with arrow up. Business and market growth concept
Free with trial Abstract 3D bar chart with a downward trending arrow, representing financial data and market decline, set against a neutral background. Diagram financial growth decrease illustrations 3D bar chart showing financial decline with downward trend. Abstract 3D bar chart with a downward trending arrow, representing financial data and market decline. Abstract 3D bar chart with a downward trending arrow, representing financial data and market decline, set against a neutral background
Free with trial Blue bar graph showing a downward trend with a yellow percentage sign and marker Visualize financial loss or negative growth in presentations and reports. Diagram financial growth decrease illustrations Declining Bar Graph with Percentage Sign Depicting Economic Downturn. Blue bar graph showing a downward trend with a yellow percentage sign and marker Visualize financial loss or negative growth in presentations and reports
Free with trial A hand with a yellow pen draws a downward arrow on a graph depicting declining bars against a dark background suggesting financial downturn or data analysis. Diagram financial growth decrease illustrations Hand Drawing Downward Arrow on Financial Graph Indicating Decline against a Dark Background. A hand with a yellow pen draws a downward arrow on a graph depicting declining bars against a dark background suggesting financial downturn or data analysis
Free with trial Illustration displays key financial indicators like rising charts, currency bags, and gold bars suggesting market analysis or investment decisions. Ideal for finance presentations or educational content. Diagram financial growth decrease illustrations Analyzing Financial Market Trends with Gold, Currency, and Global Impact. Illustration displays key financial indicators like rising charts, currency bags, and gold bars suggesting market analysis or investment decisions. Ideal for finance presentations or educational content
Free with trial Golden coins stack with arrow graph showing growth and decline. Financial success and loss concept. Business and finance illustration. Diagram financial growth decrease vectors Golden coins stack with upward and downward trending graph. Golden coins stack with arrow graph showing growth and decline. Financial success and loss concept. Business and finance illustration
Free with trial 3D rendering of various financial charts and graphs in red and pink tones on a white background. Concept of business analytics. Diagram financial growth decrease illustrations 3D Rendering of financial charts and graphs on a white background. 3D Rendering. 3D rendering of various financial charts and graphs in red and pink tones on a white background. Concept of business analytics
Free with trial A business report illustration featuring a graph and chart, ideal for presentations and documents, conveying financial data and analysis in a clear and concise manner. Diagram financial growth decrease vectors Illustration of business report with graph and chart, showcasing financial data and analysis for presentations and documents. A business report illustration featuring a graph and chart, ideal for presentations and documents, conveying financial data and analysis in a clear and concise manner
Free with trial Cost and quality control, Businessman use computer laptop with quality control growth graph and cost reduction. Successful corporate strategy, quality control. Diagram financial growth decrease illustrations Cost and quality control, Businessman use computer laptop with quality control growth graph and cost reduction. Successful
Free with trial Dual trend line graph bar business growth and decline visualization. Diagram financial growth decrease vectors Profit growth and loss decline business graph bar. Dual trend line graph bar business growth and decline visualization
Free with trial Illustration of a growing budget efficiency with a simple money bag closing tightly, a stylized downward-pointing cost arrow, and a stream of saved coins. Vector flat icon design on a white background for a cost control illustration --chaos 30 --ar 16:9 --v 7 Job ID: 35adf769-e45b-43cf-a8e7-0b2af69479b3. Diagram financial growth decrease illustrations Money Bag with Falling Coins and Downward Arrow, Symbolizing Financial Loss or Decrease. Illustration of a growing budget efficiency with a simple money bag closing tightly, a stylized downward-pointing cost arrow, and a stream of saved coins. Vector flat icon design on a white background for a cost control illustration --chaos 30 --ar 16:9 --v 7 Job ID: 35adf769-e45b-43cf-a8e7-0b2af69479b3
Free with trial Declining Bar Graph with Downward Arrow Showing Loss or Decrease. Diagram financial growth decrease vectors Declining Bar Graph with Downward Arrow Showing Loss or Decrease
Free with trial Red arrow pointing downward against a blue background symbolizes financial loss and decline, with a clean and minimalist composition suitable for illustrating economic downturn in business and finance contexts. Diagram financial growth decrease illustrations Falling Red Arrow on Blue Background Showing Financial Decline. Red arrow pointing downward against a blue background symbolizes financial loss and decline, with a clean and minimalist composition suitable for illustrating economic downturn in business and finance contexts
Free with trial Decrease on line graph with panic word on red. Finance, fear, global economic crisis, recession and investment concept. Flat design. EPS 8 vector illustration, no transparency, no gradients. Diagram financial growth decrease vectors Panic decrease, crisis, fear. Decrease on line graph with panic word on red. Finance, fear, global economic crisis, recession and investment concept. Flat design. EPS 8 vector illustration, no transparency, no gradients
Free with trial A stock market chart analysis with a downward trend arrow, illustrating financial decline, economic downturn, and investment risk in a clear visual manner. Diagram financial growth decrease vectors Vector art of stock market chart analysis with downward trend arrow indicating financial decline and economic downturn. A stock market chart analysis with a downward trend arrow, illustrating financial decline, economic downturn, and investment risk in a clear visual manner
Free with trial This image shows a balance scale with upward and downward arrows, symbolizing market trends, economic fluctuations, and financial equilibrium in the economy. Diagram financial growth decrease vectors Vector art of balance scale with upward and downward arrows, symbolizing market trends, economic fluctuations, and financial. This image shows a balance scale with upward and downward arrows, symbolizing market trends, economic fluctuations, and financial equilibrium in the economy
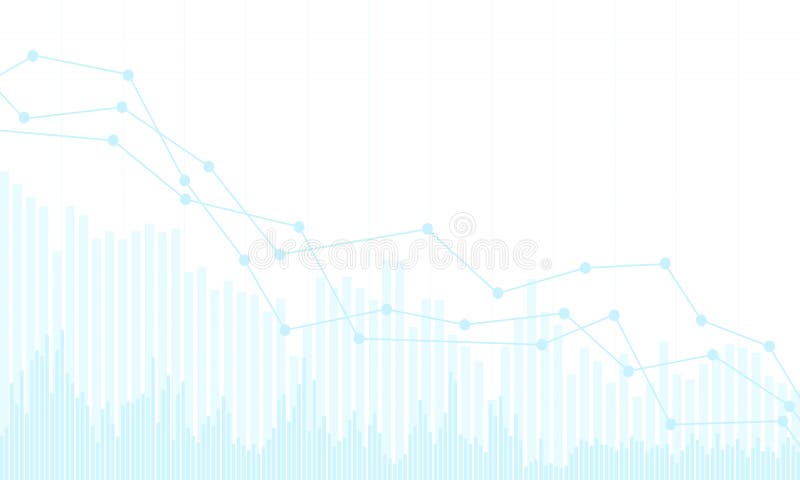
Free with trial Blue stock market or financial chart with a declining trend. On a white background - vector. Diagram financial growth decrease vectors Blue stock market or financial chart with a declining trend. On a white background, vector
Free with trial A line drawing depicts a money bag, a downward trending graph, and a magnifying glass, symbolizing financial loss. Diagram financial growth decrease illustrations Financial Loss Analysis Money Bag, Downward Graph, Magnifying Glass. A line drawing depicts a money bag, a downward trending graph, and a magnifying glass, symbolizing financial loss.
Free with trial Financial stock crisis chart, vector art illustration. Diagram financial growth decrease vectors Financial stock crisis chart
Free with trial Unemployment line icon of unemployed man on labor market, vector symbol. Economic crisis, global financial downturn and bankruptcy icon of economy recession and unemployment problem. Diagram financial growth decrease vectors Unemployment line icon, economic financial crisis. Unemployment line icon of unemployed man on labor market, vector symbol. Economic crisis, global financial downturn and bankruptcy icon of economy recession and unemployment problem
Free with trial Colorful bar chart visualizing business data, financial growth, and market analysis with a retro aesthetic. Diagram financial growth decrease illustrations Colorful geometric bar chart displaying data visualization progress. Colorful bar chart visualizing business data, financial growth, and market analysis with a retro aesthetic
Free with trial This image depicts a financial graph illustrating net worth over time, featuring a teal shaded area and a line graph with data points. The graph is presented on a clean white background, making it easy to read and understand. The image is suitable for use in financial reports, presentations, and marketing materials, providing a clear and concise visual representation of financial data. The graph's design is simple, yet effective, allowing viewers to quickly grasp the trend and pattern of net worth changes over time. Diagram financial growth decrease vectors A financial graph showing net worth over time with a teal shaded area. This image depicts a financial graph illustrating net worth over time, featuring a teal shaded area and a line graph with data points. The graph is presented on a clean white background, making it easy to read and understand. The image is suitable for use in financial reports, presentations, and marketing materials, providing a clear and concise visual representation of financial data. The graph's design is simple, yet effective, allowing viewers to quickly grasp the trend and pattern of net worth changes over time.
Free with trial A visually appealing bar graph illustration against a sleek black background, showcasing business growth, data analysis, and statistical trends. The illustration is suitable for presentations, reports, and web content related to finance, marketing, and technology. Diagram financial growth decrease illustrations Bar Graph Illustration Business Growth, Data Analysis, and Statistics. A visually appealing bar graph illustration against a sleek black background, showcasing business growth, data analysis, and statistical trends. The illustration is suitable for presentations, reports, and web content related to finance, marketing, and technology.
Free with trial A businessman in a suit is drawing a downward sloping graph illustrating the decline of profits against the rise of costs the image represents financial challenges business downturns and the need for cost reduction strategies for improved profitability. Diagram financial growth decrease illustrations Business person drawing a graph representing financial decline and reduced profits due to cost. A businessman in a suit is drawing a downward sloping graph illustrating the decline of profits against the rise of costs the image represents financial challenges business downturns and the need for cost reduction strategies for improved profitability
Free with trial Pink bar graph showing a downward trend on a pink background, financial concept. Diagram financial growth decrease illustrations Pink bar graph showing a downward trend on a pink background, financial concept
Free with trial An abstract 3D bar chart showing growth and decline trend in silver and yellow colors. Diagram financial growth decrease illustrations Growth and decline concept using 3D bar chart in silver and yellow colors. An abstract 3D bar chart showing growth and decline trend in silver and yellow colors
Free with trial Financial graph with candlestick chart and world map on a light background. Concept of global business and finance. 3D Rendering. Diagram financial growth decrease illustrations Financial graph with candlestick chart and world map on light background. 3D Rendering. Financial graph with candlestick chart and world map on a light background. Concept of global business and finance. 3D Rendering
Free with trial Simple and clean blue gradient line graph is going up and down showing growth and decline over a period of time. Diagram financial growth decrease vectors Blue gradient line graph showing growth and decline over time. Simple and clean blue gradient line graph is going up and down showing growth and decline over a period of time
Free with trial Analyzing Financial Data with Glowing Charts and Vibrant Color Bokeh Effect , colorful theme. Diagram financial growth decrease illustrations Analyzing Financial Data with Glowing Charts and Vibrant Color Bokeh Effect
Free with trial Financial crisis concept with red descending arrow. AI generative. Diagram financial growth decrease illustrations Financial crisis concept with red descending arrow.
Free with trial Financial crisis concept with red descending arrow. AI generative. Diagram financial growth decrease illustrations Financial crisis concept with red descending arrow.
Free with trial Financial crisis concept with red descending arrow. AI generative. Diagram financial growth decrease illustrations Financial crisis concept with red descending arrow.
Free with trial Financial crisis concept with red descending arrow. AI generative. Diagram financial growth decrease illustrations Financial crisis concept with red descending arrow.
Free with trial Financial crisis concept with red descending arrow. AI generative. Diagram financial growth decrease illustrations Financial crisis concept with red descending arrow.
Free with trial Financial crisis concept with red descending arrow. AI generative. Diagram financial growth decrease illustrations Financial crisis concept with red descending arrow.
Free with trial A blue zig zag line represents a stock market graph that rises and falls. It is placed upon a financial square grid of many small blocks with color changing from red to blue. Diagram financial growth decrease illustrations Stock Market Graph Showing Trending Line on Financial Grid During Daytime. A blue zig zag line represents a stock market graph that rises and falls. It is placed upon a financial square grid of many small blocks with color changing from red to blue.
Free with trial Line chart with bars and a red arrow going downwards to signify a financial decrease. Diagram financial growth decrease vectors Declining stock market chart with red arrow indicating loss, economy crisis. Line chart with bars and a red arrow going downwards to signify a financial decrease.
Free with trial This 3D illustration depicts a financial report represented by a document with a bar chart and a line graph. The bar chart shows alternating red and blue bars, while a blue line graph with an upward arrow indicates a positive trend. A yellow and purple magnifying glass is positioned over the chart, suggesting analysis and scrutiny. The artwork is set against a subtle light purple background. Diagram financial growth decrease illustrations 3D illustration of a financial report with a magnifying glass and bar chart on a light purple background. This 3D illustration depicts a financial report represented by a document with a bar chart and a line graph. The bar chart shows alternating red and blue bars, while a blue line graph with an upward arrow indicates a positive trend. A yellow and purple magnifying glass is positioned over the chart, suggesting analysis and scrutiny. The artwork is set against a subtle light purple background
Free with trial Financial concept illustration with arrows pointing towards and away from bag. Diagram financial growth decrease vectors Financial concept illustration with arrows pointing towards and away from bag
Free with trial Growth and decline bar chart icon illustration. Upward and downward arrow graph symbol. Business up and down trend concept. Diagram financial growth decrease vectors Growth and decline bar chart icon. Upward and downward arrow graph symbol. Business up and down trend concept
Free with trial A dramatic red stock market chart showing a significant downturn. it illustrates a financial crisis, economic recession, or a major market crash. a visual representation of loss and investment risk. Diagram financial growth decrease illustrations Stock market crash financial crisis economic recession downtrend chart red graph business loss investment. a dramatic red stock market chart showing a significant downturn. it illustrates a financial crisis, economic recession, or a major market crash. a visual representation of loss and investment risk.
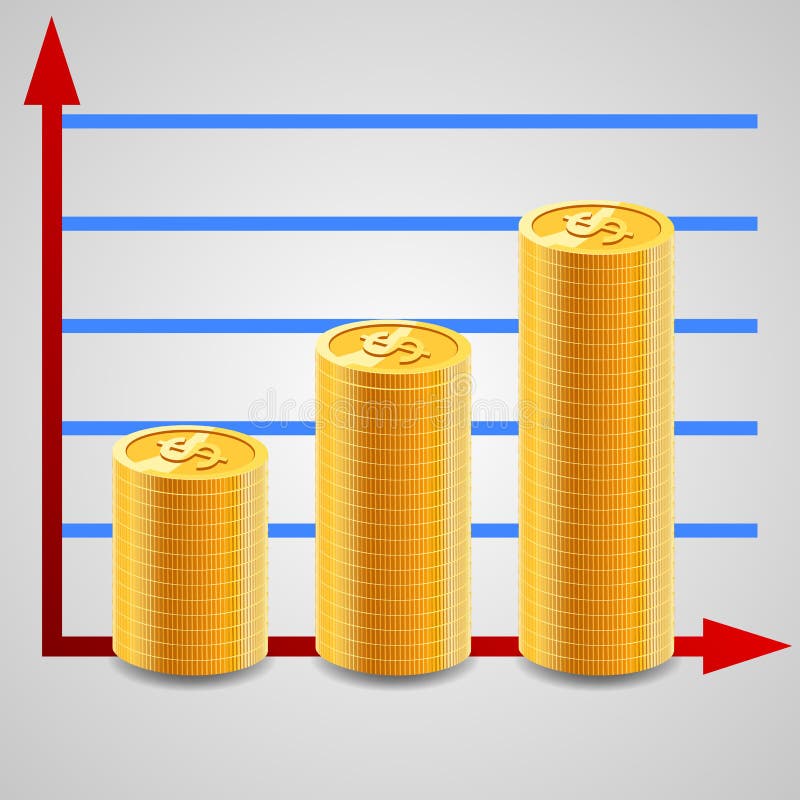
Free with trial Increasing piles of coins with going up graph. Concept for financial growth. illustration. Diagram financial growth decrease vectors Increasing piles of coins with going up graph.
Free with trial This vector illustration shows a financial chart with green bar graphs, arrows indicating downfalls, a dollar coin and money bag. It conveys a financial concept. Diagram financial growth decrease vectors Financial Chart Showing Market Trends with Dollar Signs and Green Arrows. This vector illustration shows a financial chart with green bar graphs, arrows indicating downfalls, a dollar coin and money bag. It conveys a financial concept.
Free with trial Abstract background vector of blue decreasing Economic growth or GDP. Diagram financial growth decrease vectors Background vector of blue decreasing Economic growth or GDP
Free with trial A flat illustration showing a financial decline with a bar graph, falling line, and arrow pointing down. It is in a colorful style. Diagram financial growth decrease vectors Financial Downturn Graphic: Stock Chart with Decreasing Value and Falling Arrow. A flat illustration showing a financial decline with a bar graph, falling line, and arrow pointing down. It is in a colorful style.
Free with trial Glitch green matrix symbols with decrease red trade graph. Diagram financial growth decrease illustrations Glitch green matrix symbols with decrease trade graph
Free with trial Growth and decline bar chart icon illustration. Upward and downward arrow graph symbol. Business up and down trend concept in black circle. Diagram financial growth decrease vectors Growth and decline bar chart icon. Upward and downward arrow graph symbol. Business up and down trend concept in black circle
Free with trial A 3D png of a red jagged arrow pointing downwards. This graphic represents a decline in stock markets, financial loss, economic recession, or a negative business trend, isolated on a white background. Diagram financial growth decrease vectors Red downward trend arrow financial crisis concept isolated on transparent background. A 3D png of a red jagged arrow pointing downwards. This graphic represents a decline in stock markets, financial loss, economic recession, or a negative business trend, isolated on a white background.
Free with trial Bid is spelled out with wooden blocks on top of a financial chart with stacks of coins in the background representing investment opportunity financial growth and strategic business planning for futur. Diagram financial growth decrease illustrations Bid investment finance money growth success strategy market opportunity auction competition offer proposal deal price value econom. Bid is spelled out with wooden blocks on top of a financial chart with stacks of coins in the background representing investment opportunity financial growth and strategic business planning for futur
Free with trial Analyzing Data: Person Presenting Graph Showing Progress and Growth Pointing to Top Data Peak, Achievement Concept. Diagram financial growth decrease illustrations Analyzing Data: Person Presenting Graph Showing Progress and Growth Pointing to Top Data Peak, Achievement Concept
Free with trial Colorful bar chart analysis: growth, trends, and data visualization on a wooden table ,Generative ai. Diagram financial growth decrease illustrations Colorful bar chart data analysis, visualizing growth trends and performance on a wooden table. Colorful bar chart analysis: growth, trends, and data visualization on a wooden table ,Generative ai
Free with trial A digital dashboard displaying financial data and market analytics on a desk with potted plants and greenery accents showcasing a modern technology driven workspace for business economics. Diagram financial growth decrease illustrations Financial Data Analytics Display with Greenery Accents on Office Desk. A digital dashboard displaying financial data and market analytics on a desk with potted plants and greenery accents showcasing a modern technology driven workspace for business economics
Free with trial Stacked coins illustrate financial decline, overlaid with a red trend line and world map, symbolizing global economic downturn and investment risk. Diagram financial growth decrease illustrations Global Financial Downturn: Stacked Coins with Declining Red Trend Line and World Map. Stacked coins illustrate financial decline, overlaid with a red trend line and world map, symbolizing global economic downturn and investment risk
Free with trial Man pointing at declining chart in office symbolizing loss and economic downturn in business strategy a man pointing at a declining chart ,Generative ai. Diagram financial growth decrease illustrations Businessman Pointing at Declining Chart Showing Negative Growth in Financial Analysis Presentation Businessman. Man pointing at declining chart in office symbolizing loss and economic downturn in business strategy a man pointing at a declining chart ,Generative ai
Free with trial An illustration of a bar graph showing a decline with descending arrow indicating business downturn and financial loss using flat style. Diagram financial growth decrease vectors Financial decline graph with a descending arrow showing losses and market downturns. An illustration of a bar graph showing a decline with descending arrow indicating business downturn and financial loss using flat style
Free with trial Stylized business chart icon depicting financial growth, percentage, and decline. Flat design, blue outline with light blue fill, minimalistic style. Diagram financial growth decrease vectors Business chart icon showing growth, percentage, and decline in a simple outlined style. Stylized business chart icon depicting financial growth, percentage, and decline. Flat design, blue outline with light blue fill, minimalistic style.
Free with trial A dynamic visual representation showcases interest rate volatility, featuring fluctuating lines, percentage symbols, and financial data analysis. The display creates a sense of market flux and economic shifts. Ideal for illustrating financial news, investment strategies, economic forecasts, and mark. Diagram financial growth decrease illustrations Interest Rate Volatility Display Showing Financial Data Trends and Fluctuations for Market Analysis. A dynamic visual representation showcases interest rate volatility, featuring fluctuating lines, percentage symbols, and financial data analysis. The display creates a sense of market flux and economic shifts. Ideal for illustrating financial news, investment strategies, economic forecasts, and mark
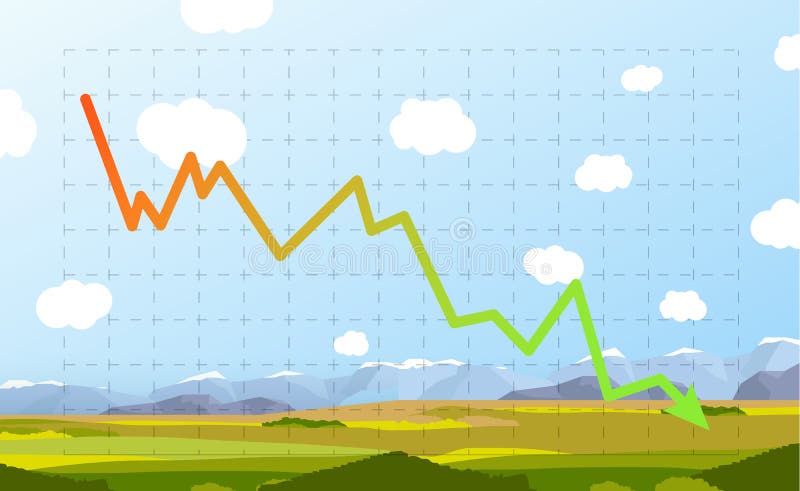
Free with trial Bright green and red decrease stocks graph on sunny nature landscape. Diagram financial growth decrease vectors Green and red decrease stocks graph on sunny nature landscape
Free with trial Abstract financial trading graph with candlestick charts and data analysis on a dark background. Diagram financial growth decrease illustrations Abstract financial trading graph with candlestick charts and data analysis on a dark background
Free with trial Stacked cubes with red arrow down symbols showing step by step decreasing trend and negative growth. Generative AI. Diagram financial growth decrease illustrations Stacked cubes with red arrow down symbols showing step by step decreasing trend and negative growth
Free with trial Economy growth graph down vector icon illustration. Diagram financial growth decrease vectors Economy growth graph down icon design. economy growth graph down vector icon illustration
Free with trial A set of black and white icons representing different types of business and financial charts including bar graphs line graphs and pie charts. Diagram financial growth decrease vectors Collection of various business and financial chart icons including bar graphs line graphs and pie charts. A set of black and white icons representing different types of business and financial charts including bar graphs line graphs and pie charts
Free with trial Collection of white icons arranged on a blue background representing financial and commercial objects in a clean, minimalist style. Diagram financial growth decrease vectors Collection of Business Finance and Banking Icons Representing Investment and Financial Operations. Collection of white icons arranged on a blue background representing financial and commercial objects in a clean, minimalist style.
Free with trial The "Vector Up and Down Graph Icon" is a graphic symbol designed to represent data trends, changes, or comparisons within a graph or chart. Diagram financial growth decrease vectors Vector Up And Down Graph Icon. Up And Down Chart Icon. Growth Diagram Icon. The "Vector Up and Down Graph Icon" is a graphic symbol designed to represent data trends, changes, or comparisons within a graph or chart.
Free with trial The "Vector Up and Down Graph Icon" is a graphic symbol designed to represent data trends, changes, or comparisons within a graph or chart. Diagram financial growth decrease vectors Vector Up And Down Graph Icon. Up And Down Chart Icon. Growth Diagram Icon. The "Vector Up and Down Graph Icon" is a graphic symbol designed to represent data trends, changes, or comparisons within a graph or chart
Free with trial Financial Data Chart Analysis with Glowing Stock Market Uptrend Graph in Blue and Orange Colors, Generated by AI. Diagram financial growth decrease illustrations Financial Data Chart Analysis with Glowing Stock Market Uptrend Graph in Blue and Orange Colors
Free with trial Dynamic stock market chart illuminates dark trading room reflects financial volatility. Red line graph shows fluctuations. Trader analyzes data on multiple screens. Global financial. Diagram financial growth decrease illustrations Dynamic stock market chart illuminates dark trading room, reflects financial volatility. Red line graph shows fluctuations. Dynamic stock market chart illuminates dark trading room reflects financial volatility. Red line graph shows fluctuations. Trader analyzes data on multiple screens. Global financial.