Free with trial Stock market. The rise and fall of securities. Successful trading. Market trend up green and red down arrows, financial graphs. Business investment growth and loss arrow. Graph going up and down symbol vector illustration. Diagram financial growth decrease vectors Stock market. The rise and fall of securities. Successful trading. Market trend up green and red down arrows, financial graphs.
Free with trial Stock market. The rise and fall of securities. Successful trading. Market trend up green and red down arrows, financial graphs. Business investment growth and loss arrow. Graph going up and down symbol vector illustration. Diagram financial growth decrease vectors Stock market. The rise and fall of securities. Successful trading. Market trend up green and red down arrows, financial graphs.
Free with trial Stock market. The rise and fall of securities. Successful trading. Market trend up green and red down arrows, financial graphs. Business investment growth and loss arrow. Graph going up and down symbol vector illustration. Diagram financial growth decrease vectors Stock market. The rise and fall of securities. Successful trading. Market trend up green and red down arrows, financial graphs.
Free with trial Set Browser with stocks market Financial growth Pie chart infographic Binary code Cloud computing lock Search data analysis and Data icon. Vector. Diagram financial growth decrease vectors Set Browser with stocks market, Financial growth, Pie chart infographic, Binary code, Cloud computing lock, Search data. Set Browser with stocks market Financial. Set Browser with stocks market Financial growth Pie chart infographic Binary code Cloud computing lock Search data analysis and Data icon. Vector.
Free with trial A collage of various hand-drawn charts and graphs in shades of blue, illustrating business growth, data analysis, and financial trends. The collection includes bar charts, line graphs, and pie charts, all rendered with a sketchy, artistic style. These visuals are perfect for presentations, reports, or any project requiring a dynamic and informative representation of data and progress. Diagram financial growth decrease illustrations Hand-Drawn Business Growth Charts and Graphs Collection. A collage of various hand-drawn charts and graphs in shades of blue, illustrating business growth, data analysis, and financial trends. The collection includes bar charts, line graphs, and pie charts, all rendered with a sketchy, artistic style. These visuals are perfect for presentations, reports, or any project requiring a dynamic and informative representation of data and progress.
Free with trial Abstract illustration of business growth, featuring bar graphs and line graphs in shades of blue and grey. The image conveys concepts of data analysis, progress, and financial performance. Suitable for presentations, reports, and marketing materials related to business, finance, and technology. Diagram financial growth decrease illustrations Abstract Business Growth Chart. Abstract illustration of business growth, featuring bar graphs and line graphs in shades of blue and grey. The image conveys concepts of data analysis, progress, and financial performance. Suitable for presentations, reports, and marketing materials related to business, finance, and technology.
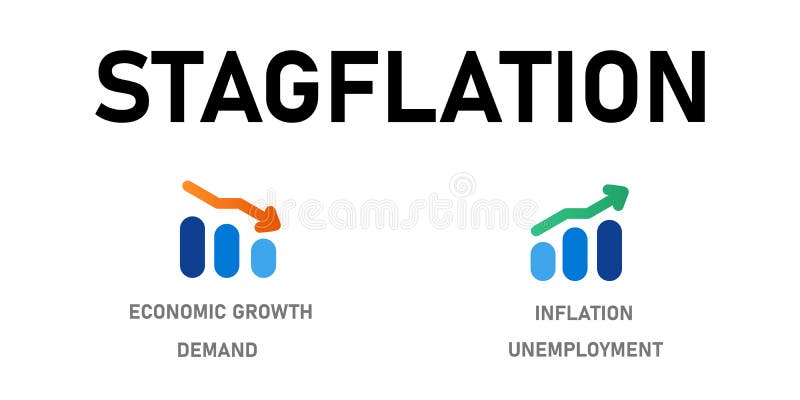
Free with trial Stagflation economic condition with high inflation increase price unemployment but low decrease economic growth and demand chart vector. Diagram financial growth decrease vectors Stagflation economic condition with high inflation increase price unemployment but low decrease economic growth and
Free with trial Gold bars on graph and arrow up, growth, chart gold with increase and decrease, gold profit and loss concept. Diagram financial growth decrease vectors Gold bars on graph and arrow up, growth, chart gold with increase and decrease, gold profit and loss concept
Free with trial A vector icon of a descending line graph on a green base, illustrating a downward trend, decrease, or decline in data. Represents financial loss, reduced performance, or negative growth. Suitable for business reports, statistical analysis, and economic presentations, vector design Generative AI. Diagram financial growth decrease vectors Descending Line Graph Decline Trend Chart Icon, vector design Generative AI. A vector icon of a descending line graph on a green base, illustrating a downward trend, decrease, or decline in data. Represents financial loss, reduced performance, or negative growth. Suitable for business reports, statistical analysis, and economic presentations, vector design Generative AI
Free with trial A digital financial chart shows upward market trends. The red line and green bars rise against a grid. A gold data network overlay adds depth to the business graphic. Diagram financial growth decrease illustrations Growing Financial Chart Shows Market Growth With Data Grid Background. A digital financial chart shows upward market trends. The red line and green bars rise against a grid. A gold data network overlay adds depth to the business graphic.
Free with trial Increase and Decrease Stroke icon collections. Containing Increase, Decrease, Growth, Fall, up, down icons. Editable Stroke icon collections. Diagram financial growth decrease vectors Increase and Decrease Stroke icon collections.
Free with trial Stock fall recession economy crisis financial global market chart on red decline background concept with loss price down finance graph or digital crash diagram failure money. Diagram financial growth decrease illustrations Stock fall recession economy crisis financial global market chart on red decline background concept with loss price down finance
Free with trial A flat vector icon showing a line graph with a distinct downward trend. Represents decline, decrease, negative growth, or falling performance. Suitable for business analysis, financial reports, or graphics illustrating negative progress or statistics, vector design Generative AI. Diagram financial growth decrease vectors Downward line graph icon representing negative trend decline, vector design Generative AI. A flat vector icon showing a line graph with a distinct downward trend. Represents decline, decrease, negative growth, or falling performance. Suitable for business analysis, financial reports, or graphics illustrating negative progress or statistics, vector design Generative AI
Free with trial Financial risk icons. Decrease icon set. Vector illustration isolated on white background. Diagram financial growth decrease illustrations Financial risk icons
Free with trial A simple bar graph illustrating upward growth and financial success. Ideal for presentations, reports, and website use. Diagram financial growth decrease vectors Upward Trending Bar Graph: Business Growth and Financial Success. A simple bar graph illustrating upward growth and financial success. Ideal for presentations, reports, and website use.
Free with trial A conceptual vector illustration depicting the duality of business performance. On a modern teal background, two reports are shown side-by-side. One features a rising red graph symbolizing growth, profit, and success, while the other displays a descending graph representing decline, loss, and failure. This flat design graphic is ideal for financial analysis, market trend comparisons, business presentations, and infographics illustrating opposite outcomes or strategic choices. The long shadow effect adds a contemporary feel to the design. Diagram financial growth decrease vectors Growth and Decline Business Charts Comparison. A conceptual vector illustration depicting the duality of business performance. On a modern teal background, two reports are shown side-by-side. One features a rising red graph symbolizing growth, profit, and success, while the other displays a descending graph representing decline, loss, and failure. This flat design graphic is ideal for financial analysis, market trend comparisons, business presentations, and infographics illustrating opposite outcomes or strategic choices. The long shadow effect adds a contemporary feel to the design.
Free with trial Line Graph Trend Analysis Line And Solid Icon Set. Data Visualization, Business Growth, Statistical Analysis Symbol Collection. Financial And Market Insights. Isolated Vector Illustration. Diagram financial growth decrease vectors Line Graph Trend Analysis Line And Solid Icon Set. Data Visualization, Business Growth, Statistical Analysis Symbol
Free with trial Mobile phone screen displaying a cryptocurrency trading application for Bitcoin. The interface shows a financial candlestick chart with growth analysis, a Bitcoin coin icon, and a fingerprint scanner for secure transactions. Vector illustration isolated on white background. Diagram financial growth decrease illustrations Smartphone with Bitcoin cryptocurrency trading app interface on screen showing financial chart and fingerprint security. Mobile phone screen displaying a cryptocurrency trading application for Bitcoin. The interface shows a financial candlestick chart with growth analysis, a Bitcoin coin icon, and a fingerprint scanner for secure transactions. Vector illustration isolated on white background
Free with trial A professional bar chart visualization featuring multiple colorful vertical bars of varying heights, representing statistical data, growth, or financial analysis in a clean minimalist style. Created AI. Diagram financial growth decrease illustrations A colorful bar graph showing financial data trends on white background. A professional bar chart visualization featuring multiple colorful vertical bars of varying heights, representing statistical data, growth, or financial analysis in a clean minimalist style.Created AI
Free with trial A dynamic financial chart illustrating market fluctuations with percentage changes and various currency coins. Ideal for illustrating economic trends, investment analysis, or financial reports. Diagram financial growth decrease illustrations Financial Growth Chart with Currency Symbols. A dynamic financial chart illustrating market fluctuations with percentage changes and various currency coins. Ideal for illustrating economic trends, investment analysis, or financial reports
Free with trial Decline, growth, success, recession business flat concept illustration. Graphs depict increase and decrease business. Vector template element for infographic, web, presentation, social networks. Diagram financial growth decrease vectors Recession, decline, growth, increase, success business arrows. F. Decline, growth, success, recession business flat concept illustration. Graphs depict increase and decrease business. Vector template element for infographic, web, presentation, social networks.
Free with trial A dynamic black and white background pattern featuring a collection of hand-drawn financial and economic elements. The design includes various currency symbols like the Dollar, Euro, and Yen, alongside upward and downward arrows, zig-zag lines representing market volatility, and simple bar charts indicating growth or decline. Scattered ink splatters add a grunge, artistic touch to the overall composition. This versatile illustration is ideal for conveying concepts related to global finance, business trends, investment, stock market fluctuations, economic data, and wealth management in a creative and engaging way. Diagram financial growth decrease vectors Hand Drawn Financial Market Elements Background Pattern. A dynamic black and white background pattern featuring a collection of hand-drawn financial and economic elements. The design includes various currency symbols like the Dollar, Euro, and Yen, alongside upward and downward arrows, zig-zag lines representing market volatility, and simple bar charts indicating growth or decline. Scattered ink splatters add a grunge, artistic touch to the overall composition. This versatile illustration is ideal for conveying concepts related to global finance, business trends, investment, stock market fluctuations, economic data, and wealth management in a creative and engaging way.
Free with trial Close-up view of a graph illustrating data analysis, trends, and financial growth ,Generative ai. Diagram financial growth decrease illustrations Closeup, graph analysis, trends, and financial growth insights on table closeup. Close-up view of a graph illustrating data analysis, trends, and financial growth ,Generative ai
Free with trial Growth financial business on white background. Isolated 3D illustration. Diagram financial growth decrease illustrations Growth financial business on white background. Isolated 3D illustration
Free with trial A clean, minimalist 3D rendering of a declining bar chart in a monochromatic pastel pink color scheme. The bars are arranged in descending order, clearly illustrating a concept of decrease, loss, or a downward trend. This abstract and modern graphic is perfect for business and financial presentations, reports, or infographics about recession, economic downturn, sales reduction, or negative growth. The soft lighting and ample copy space make it a versatile background for various data visualization and corporate concepts. Diagram financial growth decrease illustrations Minimalist Pink 3D Bar Chart Showing a Downward Trend. A clean, minimalist 3D rendering of a declining bar chart in a monochromatic pastel pink color scheme. The bars are arranged in descending order, clearly illustrating a concept of decrease, loss, or a downward trend. This abstract and modern graphic is perfect for business and financial presentations, reports, or infographics about recession, economic downturn, sales reduction, or negative growth. The soft lighting and ample copy space make it a versatile background for various data visualization and corporate concepts.
Free with trial A collection of line icons representing various financial concepts, including money, bitcoin, shopping, and business growth, all in a simple black and white design. Diagram financial growth decrease vectors Financial Icons Set with Money, Bitcoin, and Business Symbols. A collection of line icons representing various financial concepts, including money, bitcoin, shopping, and business growth, all in a simple black and white design
Free with trial Money loss and economic crisis, money market crash and global financial downturn, vector line icons. Economic crisis icons of bankruptcy, price decrease with money inflation and unemployment growth. Diagram financial growth decrease vectors Money loss and economic crisis, money market crash
Free with trial This digital image shows a glowing blue financial graph indicating market trends, growth, and data analysis. Diagram financial growth decrease illustrations Blue digital financial graph representing increasing data and information. This digital image shows a glowing blue financial graph indicating market trends, growth, and data analysis
Free with trial Money loss and economic crisis, money market crash and global financial downturn, vector line icons. Economic crisis icons of bankruptcy, price decrease with money inflation and unemployment growth. Diagram financial growth decrease vectors Money loss and economic crisis, money market crash
Free with trial Detailed illustration featuring a variety of hand drawn style financial charts and data analysis line icons including growth curves and market trends. Diagram financial growth decrease vectors Collection of business data and financial analytics line icons. detailed illustration featuring a variety of hand drawn style financial charts and data analysis line icons including growth curves and market trends
Free with trial A vibrant infographic illustrating business growth, financial analysis, and data visualization with charts, graphs, and icons. Diagram financial growth decrease vectors Infographic of Business Growth and Financial Analysis with Charts and Icons. A vibrant infographic illustrating business growth, financial analysis, and data visualization with charts, graphs, and icons
Free with trial This is an detailed collection of financial growth charts and market volatility icons in a clean minimal style. Diagram financial growth decrease vectors Financial line icons showing stock market trends with bull and bear symbols. This is an detailed collection of financial growth charts and market volatility icons in a clean minimal style
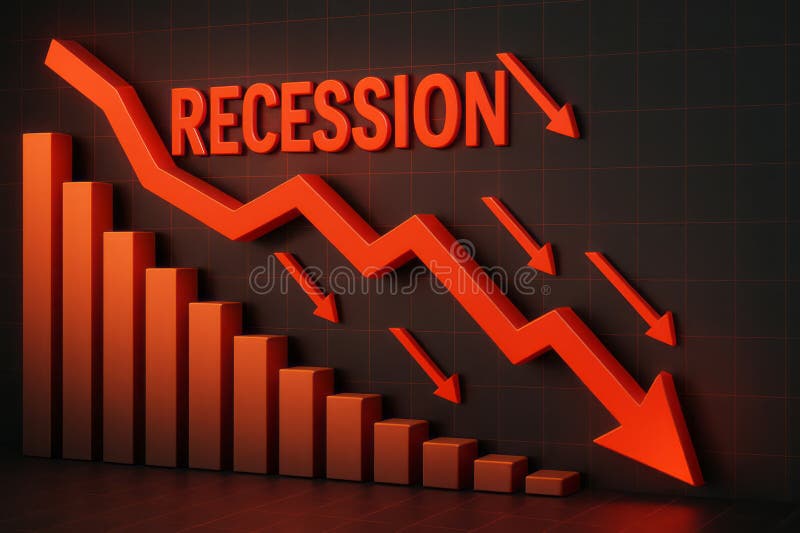
Free with trial This image visually represents an economic recession through downward trends and statistics. The vibrant red arrows emphasize the significant decline in growth, making it an impactful visual for financial analysis. Diagram financial growth decrease illustrations Dramatic Decline in Economic Growth with Recession Indicator and Downward Arrows in Red. This image visually represents an economic recession through downward trends and statistics. The vibrant red arrows emphasize the significant decline in growth, making it an impactful visual for financial analysis
Free with trial Wooden blocks and spheres displaying percentage signs represent financial concepts such as discounts sales interest rates investments savings loans mortgages banking economy market growth return prof. Diagram financial growth decrease illustrations Percentage discount sale promotion offer finance interest rate investment savings loan mortgage banking economy market growth retu. Wooden blocks and spheres displaying percentage signs represent financial concepts such as discounts sales interest rates investments savings loans mortgages banking economy market growth return prof
Free with trial Percentage symbol displayed on a wooden block represents financial concepts such as discounts sales interest rates savings investments profit margins and economic growth applicable for business prese. Diagram financial growth decrease illustrations Percentage discount sale offer promotion finance interest rate savings investment earnings profit margin growth return value marke. Percentage symbol displayed on a wooden block represents financial concepts such as discounts sales interest rates savings investments profit margins and economic growth applicable for business prese
Free with trial Person analyzes growth chart, market trends, financial data, stock exchange, investment portfolio,Generative AI. Diagram financial growth decrease illustrations Business person analyzes growth charts, market trends, and financial data on an interactive screen. Person analyzes growth chart, market trends, financial data, stock exchange, investment portfolio,Generative AI
Free with trial Businessman falls from a stack of coins. Financial crisis. Decrease in capital. Diagram financial growth decrease vectors Businessman falls from a stack of coins. Financial crisis. Decrease in capital.
Free with trial Three coin stacks with dollar signs, showing growth, and a downward arrow indicating potential decline. Diagram financial growth decrease vectors A line drawing depicting three stacks of coins with dollar signs on top, showing financial growth. three coin stacks with dollar signs, showing growth, and a downward arrow indicating potential decline
Free with trial Ascending green chart indicates positive financial growth in stock market investment ,Generative ai. Diagram financial growth decrease illustrations Ascending green stock chart symbolizes positive financial growth and investment success in market. Ascending green chart indicates positive financial growth in stock market investment ,Generative ai
Free with trial Conceptual image showing a declining financial graph on a hand, symbolizing business economy crisis, investment loss, or market crash. It represents negative growth and economic downturn. Diagram financial growth decrease illustrations Declining financial graph on hand concept for business economy crisis or investment loss and market crash. conceptual image showing a declining financial graph on a hand, symbolizing business economy crisis, investment loss, or market crash. It represents negative growth and economic downturn.
Free with trial Business analytics icon depicting price fluctuations in economic market data, financial growth concept. Diagram financial growth decrease vectors Financial candlestick chart illustrating market trend for investment, stock trading data analysis. Isolated digital graphic. Business analytics icon depicting price fluctuations in economic market data, financial growth concept.
Free with trial A decreasing bar graph with a downward arrow and coin, symbolizing financial loss and economic decline. This image represents negative growth and market downturns. Diagram financial growth decrease vectors Vector art of decreasing bar graph with a downward arrow and coin, symbolizing financial loss and economic decline, , indicating. A decreasing bar graph with a downward arrow and coin, symbolizing financial loss and economic decline. This image represents negative growth and market downturns
Free with trial Business analytics, data visualization, market research, financial reports, and growth strategies are symbolized in this image. Elegant empty space crafted for branding, ads, and product presentations. Suitable for marketing campaigns and creative displays. . Generative AI. Diagram financial growth decrease illustrations Colorful Data Charts and Graphs on White Background Business analytics data visualization market research financial reports. Business analytics, data visualization, market research, financial reports, and growth strategies are symbolized in this image. Elegant empty space crafted for branding, ads, and product presentations. Suitable for marketing campaigns and creative displays. . Generative AI
Free with trial Blue stacked arrows illustrate financial growth, market trends. Graphic displays upward, downward movement, signifying progress, decline in business economy. Represents strategy,. Diagram financial growth decrease illustrations Blue stacked arrows illustrate financial growth, market trends. Graphic displays upward, downward movement, signifying progress
Free with trial This icon represents a financial transaction, showing money flow with arrows pointing both up and down, symbolizing the fluctuation of value in investments. Diagram financial growth decrease vectors Vector art of financial transaction icon, depicting money flow with arrows indicating both increase and decrease in value or. This icon represents a financial transaction, showing money flow with arrows pointing both up and down, symbolizing the fluctuation of value in investments
Free with trial Grow online diagram icon flat vector. Data price. Bitcoin decrease coin. Diagram financial growth decrease illustrations Grow online diagram icon flat vector. Data price
Free with trial Grow online diagram icon outline vector. Data price. Bitcoin decrease coin. Diagram financial growth decrease illustrations Grow online diagram icon outline vector. Data price
Free with trial Diagram graph, Investment graph and Swipe up icons simple set. Button with halftone dots. Presentation chart, Investment infochart, Growth report. Scrolling page. Science set. Vector. Diagram financial growth decrease vectors Diagram graph, Investment graph and Swipe up icons set. Vector. Diagram graph, Investment graph and Swipe up icons simple set. Button with halftone dots. Presentation chart, Investment infochart, Growth report. Scrolling page. Science set. Vector
Free with trial Exhibitors sign. Diploma certificate, save planet chat bubbles. Question mark, Diagram and Diagram chart line icons set. Ask support, Growth graph, Presentation graph. Information desk. Vector. Diagram financial growth decrease vectors Question mark, Diagram and Diagram chart icons set. Exhibitors sign. Vector. Exhibitors sign. Diploma certificate, save planet chat bubbles. Question mark, Diagram and Diagram chart line icons set. Ask support, Growth graph, Presentation graph. Information desk. Vector
Free with trial Three red percentage symbols are shown with arrows pointing downward, representing a decline. Each symbol is positioned above words: "Economy," "Growth," and "Stocks," indicating a decrease in these areas. The arrows are bold and the symbols feature a glossy finish, emphasizing the visual concept of reduction or negative trend. The overall design highlights financial or economic themes. Diagram financial growth decrease illustrations Three red percentage symbols are shown with arrows pointing downward
Free with trial A 3D rendered illustration depicting business growth. The image showcases two upward-trending arrow charts, one in gold and the other in blue, representing positive trends, progress, and success. The charts are set against a clean, light background, emphasizing the upward movement and potential for financial gain. Suitable for illustrating economic growth, investment strategies, and business performance. Diagram financial growth decrease illustrations Growth Chart with Arrows. A 3D rendered illustration depicting business growth. The image showcases two upward-trending arrow charts, one in gold and the other in blue, representing positive trends, progress, and success. The charts are set against a clean, light background, emphasizing the upward movement and potential for financial gain. Suitable for illustrating economic growth, investment strategies, and business performance.
Free with trial Stock market crash concept. Broken chart arrow. Stock market growth and sudden drawdown. Financial chart that presents stock crisis. Business bankruptcy. Investment risks. Vector illustration. Diagram financial growth decrease vectors Stock market growth and sudden drawdown illustration. Stock market crash concept. Broken chart arrow. Stock market growth and sudden drawdown. Financial chart that presents stock crisis. Business bankruptcy. Investment risks. Vector illustration
Free with trial MInus growths chart collection. Deficit symbol. Bar diagram. Fail growth arrow icon. Non progress symbol. Chart decrease - stock vector. Diagram financial growth decrease vectors Decreasing chart with bar, arrow, and Rupiah symbol. MInus growths chart collection. Deficit symbol. Bar diagram. Fail growth arrow icon. Non progress symbol. Chart decrease - stock vector.
Free with trial A collection of hand-drawn, black and white icons representing growth, decline, and financial concepts. The set includes upward and downward arrows, percentage symbols, and a bar graph illustrating trends. The simple line art style makes these icons versatile for various applications, including presentations, infographics, and website design. They convey concepts of progress, success, loss, and market fluctuations. Diagram financial growth decrease illustrations Growth and Decline Icons Set. A collection of hand-drawn, black and white icons representing growth, decline, and financial concepts. The set includes upward and downward arrows, percentage symbols, and a bar graph illustrating trends. The simple line art style makes these icons versatile for various applications, including presentations, infographics, and website design. They convey concepts of progress, success, loss, and market fluctuations.
Free with trial A 3D illustration of a stack of silver dollar coins with an decrease and increase arrow graph, symbolizing financial growth and success, isolated, png, transparent, clipart, transparent background, cutout, cut-out. Diagram financial growth decrease vectors A 3D illustration of a stack of golden coins. A 3D illustration of a stack of silver dollar coins with an decrease and increase arrow graph, symbolizing financial growth and success, isolated, png, transparent, clipart, transparent background, cutout, cut-out
Free with trial A 3D illustration of a stack of golden dollar coins with an decrease and increase arrow graph, symbolizing financial growth and success, isolated, png, transparent, clipart, transparent background, cutout, cut-out. Diagram financial growth decrease vectors A 3D illustration of a stack of golden coins. A 3D illustration of a stack of golden dollar coins with an decrease and increase arrow graph, symbolizing financial growth and success, isolated, png, transparent, clipart, transparent background, cutout, cut-out
Free with trial Money loss and economic crisis, money market crash and global financial downturn, vector line icons. Economic crisis icons of bankruptcy, price decrease with money inflation and unemployment growth. Diagram financial growth decrease vectors Money loss and economic crisis, money market crash
Free with trial Rrow Business graphics, Arrow Business, Financial analysis data graphs and diagram, marketing statistic modern business presentation elements vector investment progress icon set. element for presentation, poster, business. Diagram financial growth decrease vectors Arrow Business graphics, Arrow Business, Financial analysis data graphs. rrow Business graphics, Arrow Business, Financial analysis data graphs and diagram, marketing statistic modern business presentation elements vector investment progress icon set. element for presentation, poster, business
Free with trial Stock market crash concept. Broken chart arrow. Stock market growth and sudden drawdown. Financial chart that presents stock crisis. Business bankruptcy. Investment risks. Vector illustration. Diagram financial growth decrease vectors Stock market growth and sudden drawdown illustration. Stock market crash concept. Broken chart arrow. Stock market growth and sudden drawdown. Financial chart that presents stock crisis. Business bankruptcy. Investment risks. Vector illustration
Free with trial A modern flat design icon representing financial data analysis and market trends. This vector illustration features a combination of a green bar chart and a dark grey line graph, showing fluctuations in performance. An upward arrow indicates initial growth, followed by a volatile trend line symbolizing concepts like market instability, economic changes, profit and loss, or business analytics. This versatile graphic is perfect for infographics, financial reports, presentations, websites, and applications related to business, finance, statistics, and economics. Isolated on a white background for easy use. Diagram financial growth decrease vectors Financial Market Fluctuation Graph Icon. A modern flat design icon representing financial data analysis and market trends. This vector illustration features a combination of a green bar chart and a dark grey line graph, showing fluctuations in performance. An upward arrow indicates initial growth, followed by a volatile trend line symbolizing concepts like market instability, economic changes, profit and loss, or business analytics. This versatile graphic is perfect for infographics, financial reports, presentations, websites, and applications related to business, finance, statistics, and economics. Isolated on a white background for easy use.
Free with trial Economic crisis line icons of global financial downturn and business bankruptcy, vector banner. Money loss and banking crisis icons of depreciation, unemployment and price decrease of pandemic crisis. Diagram financial growth decrease vectors Economic crisis icons of global financial downturn. Economic crisis line icons of global financial downturn and business bankruptcy, vector banner. Money loss and banking crisis icons of depreciation, unemployment and price decrease of pandemic crisis
Free with trial Decrease statistic illustration vector design, statistical diagram that serves to provide information about a data or so on. Diagram financial growth decrease vectors Decrease statistic illustration vector design
Free with trial Hand with diagram report arrows decrease vector illustration. Diagram financial growth decrease vectors Hand with diagram report
Free with trial Agent, 24 hours and Payment received signs. Infographics timeline. Growth chart, Diagram graph and Web report line icons set. Diagram graph, Presentation chart, Business person. Time. Vector. Diagram financial growth decrease vectors Growth chart, Diagram graph and Web report icons set. Agent, 24 hours and Payment received signs. Vector. Agent, 24 hours and Payment received signs. Infographics timeline. Growth chart, Diagram graph and Web report line icons set. Diagram graph, Presentation chart, Business person. Time. Vector
Free with trial This minimalist vector illustration features two identical line graphs, presented in contrasting black and white themes. The left graph displays a black line on a white background, while the right shows a white line on a black background. Both graphs depict a clear downward trend with jagged fluctuations, symbolizing decline, loss, or negative growth over time. This versatile icon set is ideal for illustrating concepts such as economic downturns, financial losses, market crashes, business failures, or any data showing a significant decrease. Perfect for presentations, reports, infographics, and web design. Diagram financial growth decrease vectors Declining Line Graph Icon Set - Black and White. This minimalist vector illustration features two identical line graphs, presented in contrasting black and white themes. The left graph displays a black line on a white background, while the right shows a white line on a black background. Both graphs depict a clear downward trend with jagged fluctuations, symbolizing decline, loss, or negative growth over time. This versatile icon set is ideal for illustrating concepts such as economic downturns, financial losses, market crashes, business failures, or any data showing a significant decrease. Perfect for presentations, reports, infographics, and web design.
Free with trial Calendar, Report diagram and Presentation board icons simple set. Smartphone statistics sign. Event reminder, Financial market, Growth chart. Mobile business. Education set. Linear calendar icon. Diagram financial growth decrease vectors Calendar, Report diagram and Presentation board icons set. Smartphone statistics sign. Vector. Calendar, Report diagram and Presentation board icons simple set. Smartphone statistics sign. Event reminder, Financial market, Growth chart. Mobile business. Education set. Linear calendar icon
Free with trial Diagram graph, Investment graph and Swipe up icons simple set. Halftone dots button. Presentation chart, Investment infochart, Growth report. Scrolling page. Science set. Vector. Diagram financial growth decrease vectors Diagram graph, Investment graph and Swipe up icons set. Vector. Diagram graph, Investment graph and Swipe up icons simple set. Halftone dots button. Presentation chart, Investment infochart, Growth report. Scrolling page. Science set. Vector
Free with trial A 3D render illustrating the concept of financial decline and economic crisis. The image features a bar chart with progressively smaller bars and a prominent red arrow pointing downwards, signifying a sharp downturn. This visual metaphor represents a stock market crash, business failure, investment loss, or recession. The minimalist design on a yellow background is perfect for financial reports, business presentations, economic news articles, and web graphics discussing negative growth, losses, or bankruptcy. A small stack of coins reinforces the monetary theme. Diagram financial growth decrease illustrations 3D Financial Decline Graph with Downward Arrow. A 3D render illustrating the concept of financial decline and economic crisis. The image features a bar chart with progressively smaller bars and a prominent red arrow pointing downwards, signifying a sharp downturn. This visual metaphor represents a stock market crash, business failure, investment loss, or recession. The minimalist design on a yellow background is perfect for financial reports, business presentations, economic news articles, and web graphics discussing negative growth, losses, or bankruptcy. A small stack of coins reinforces the monetary theme.
Free with trial Business growth presentation with charts and graphs showing progress, statistics, and performance. The image showcases key financial indicators in a clear, concise format. Diagram financial growth decrease vectors Financial Data Analysis Report on Screen Display. Business growth presentation with charts and graphs showing progress, statistics, and performance. The image showcases key financial indicators in a clear, concise format.
Free with trial A collection of financial chart icons, showcasing data analysis and business growth concepts. The image features multiple variations of a line graph and bar chart combination, presented in both grayscale and beige color schemes. These icons are ideal for illustrating financial reports, business presentations, market trends, and data visualization projects. The clean, modern design makes them suitable for a wide range of applications. Diagram financial growth decrease vectors Financial Chart Icons: Business and Data Analysis. A collection of financial chart icons, showcasing data analysis and business growth concepts. The image features multiple variations of a line graph and bar chart combination, presented in both grayscale and beige color schemes. These icons are ideal for illustrating financial reports, business presentations, market trends, and data visualization projects. The clean, modern design makes them suitable for a wide range of applications.
Free with trial Business graphics traffic, Arrow Business, Financial analysis data graphs and diagram, marketing statistic modern business presentation elements vector investment progress icon set, element arrow presentation. Diagram financial growth decrease vectors Business graphics traffic, Arrow Business, Financial analysis data graphiics. Business graphics traffic, Arrow Business, Financial analysis data graphs and diagram, marketing statistic modern business presentation elements vector investment progress icon set, element arrow presentation
Free with trial Set line Pie chart infographic Server Financial growth Cloud download and upload Calculator and Data analysis icon. Vector. Diagram financial growth decrease vectors Set line Pie chart infographic, Server, Financial growth, Cloud download and upload, Calculator, and Data analysis icon
Free with trial A vector illustration showing a magnifying glass focused on a bar graph and line chart indicating growth. The magnifying glass has a blue frame and red handle. The chart depicts an upward trend, suggesting positive business performance. This image is suitable for illustrating data analysis, business strategy, market research, and financial growth concepts. Diagram financial growth decrease vectors Analyzing Growth: Magnifying Glass on Business Chart. A vector illustration showing a magnifying glass focused on a bar graph and line chart indicating growth. The magnifying glass has a blue frame and red handle. The chart depicts an upward trend, suggesting positive business performance. This image is suitable for illustrating data analysis, business strategy, market research, and financial growth concepts.
Free with trial A futuristic concept of financial trading and data analysis. A glowing holographic stock market chart, with candlesticks and graphs, is projected onto a modern office desk. The scene includes a laptop and coffee, set against a large window with a blurry night city skyline. This image represents concepts like fintech, investment, big data, economic growth, and innovative business technology. Ideal for illustrating topics on digital finance, stock exchange, forex trading, and corporate strategy in a high-tech world. Diagram financial growth decrease illustrations Futuristic Financial Trading Hologram on Office Desk. A futuristic concept of financial trading and data analysis. A glowing holographic stock market chart, with candlesticks and graphs, is projected onto a modern office desk. The scene includes a laptop and coffee, set against a large window with a blurry night city skyline. This image represents concepts like fintech, investment, big data, economic growth, and innovative business technology. Ideal for illustrating topics on digital finance, stock exchange, forex trading, and corporate strategy in a high-tech world.
Free with trial A symbolic illustration of a person with a downward-pointing arrow, representing decline, reduction, or negative trends. Ideal for financial reports, statistical analyses, or problem identification. This visual effectively communicates a downturn or decrease in various metrics. vector design Generative AI. Diagram financial growth decrease vectors Person with Down Arrow, Decline, Downtrend & Reduced Growth, vector design Generative AI. A symbolic illustration of a person with a downward-pointing arrow, representing decline, reduction, or negative trends. Ideal for financial reports, statistical analyses, or problem identification. This visual effectively communicates a downturn or decrease in various metrics. vector design Generative AI
Free with trial Set of Finance icons, such as Debit card, Column chart, Loan percent icons. UI phone app screens with people. Growth chart line symbols. Wallet with credit card, Financial graph, Decrease rate. Vector. Diagram financial growth decrease vectors Set of Finance icons, such as Debit card, Column chart, Loan percent. Vector. Set of Finance icons, such as Debit card, Column chart, Loan percent icons. UI phone app screens with people. Growth chart line symbols. Wallet with credit card, Financial graph, Decrease rate. Vector
Free with trial Vector set of Customer satisfaction, Report diagram and Dot plot line icons set. UI phone app screens with line icons. Payment icon. Happy smile chart, Financial market, Presentation graph. Vector. Diagram financial growth decrease vectors Vector set of Customer satisfaction, Report diagram and Dot plot line icons set. Vector. Vector set of Customer satisfaction, Report diagram and Dot plot line icons set. UI phone app screens with line icons. Payment icon. Happy smile chart, Financial market, Presentation graph. Vector