Free with trial The flag of Luxembourg with declining stock market graph and financial data overlay, symbolizing economic downturn, recession, or bearish market trends. Finance stock decrease illustrations The flag of Luxembourg with declining stock market graph and financial data overlay
Free with trial Concept of financial crisis with connected icons. Finance stock decrease illustrations Concept of financial crisis
Free with trial Bitcoin Price Falling. Financial Crisis, BTC Fall Down. Crypto Inflation. Falling Currency Symbol With Neon Arrows Showing Economic Decline And Market Drop In Futuristic Style. Vector Illustration. Finance stock decrease vectors Bitcoin Price Falling. Financial Crisis, BTC Fall Down. Crypto Inflation. Falling Currency Symbol With Neon Arrows
Free with trial The flag of Kyrgyzstan with declining stock market graph and financial data overlay, symbolizing economic downturn, recession, or bearish market trends. Finance stock decrease illustrations The flag of Kyrgyzstan with declining stock market graph and financial data overlay
Free with trial The flag of Mozambique with declining stock market graph and financial data overlay, symbolizing economic downturn, recession, or bearish market trends. Finance stock decrease illustrations The flag of Mozambique with declining stock market graph and financial data overlay
Free with trial The flag of Madagascar with declining stock market graph and financial data overlay, symbolizing economic downturn, recession, or bearish market trends. Finance stock decrease illustrations The flag of Madagascar with declining stock market graph and financial data overlay
Free with trial The flag of Uzbekistan with declining stock market graph and financial data overlay, symbolizing economic downturn, recession, or bearish market trends. Finance stock decrease illustrations The flag of Uzbekistan with declining stock market graph and financial data overlay
Free with trial The flag of Indonesia with declining stock market graph and financial data overlay, symbolizing economic downturn, recession, or bearish market trends. Finance stock decrease illustrations The flag of Indonesia with declining stock market graph and financial data overlay
Free with trial The flag of Azerbaijan with declining stock market graph and financial data overlay, symbolizing economic downturn, recession, or bearish market trends. Finance stock decrease illustrations The flag of Azerbaijan with declining stock market graph and financial data overlay
Free with trial The flag of East Timor with declining stock market graph and financial data overlay, symbolizing economic downturn, recession, or bearish market trends. Finance stock decrease illustrations The flag of East Timor with declining stock market graph and financial data overlay
Free with trial The flag of Costa Rica with declining stock market graph and financial data overlay, symbolizing economic downturn, recession, or bearish market trends. Finance stock decrease illustrations The flag of Costa Rica with declining stock market graph and financial data overlay
Free with trial The flag of Bangladesh with declining stock market graph and financial data overlay, symbolizing economic downturn, recession, or bearish market trends. Finance stock decrease illustrations The flag of Bangladesh with declining stock market graph and financial data overlay
Free with trial The flag of Kazakhstan with declining stock market graph and financial data overlay, symbolizing economic downturn, recession, or bearish market trends. Finance stock decrease illustrations The flag of Kazakhstan with declining stock market graph and financial data overlay
Free with trial The flag of Ivory Coast with declining stock market graph and financial data overlay, symbolizing economic downturn, recession, or bearish market trends. Finance stock decrease illustrations The flag of Ivory Coast with declining stock market graph and financial data overlay
Free with trial The flag of New Zealand with declining stock market graph and financial data overlay, symbolizing economic downturn, recession, or bearish market trends. Finance stock decrease illustrations The flag of New Zealand with declining stock market graph and financial data overlay
Free with trial The flag of Macau China with declining stock market graph and financial data overlay, symbolizing economic downturn, recession, or bearish market trends. Finance stock decrease illustrations The flag of Macau China with declining stock market graph and financial data overlay
Free with trial The flag of El Salvador with declining stock market graph and financial data overlay, symbolizing economic downturn, recession, or bearish market trends. Finance stock decrease illustrations The flag of El Salvador with declining stock market graph and financial data overlay
Free with trial The flag of South Korea with declining stock market graph and financial data overlay, symbolizing economic downturn, recession, or bearish market trends. Finance stock decrease illustrations The flag of South Korea with declining stock market graph and financial data overlay
Free with trial The flag of Netherlands with declining stock market graph and financial data overlay, symbolizing economic downturn, recession, or bearish market trends. Finance stock decrease illustrations The flag of Netherlands with declining stock market graph and financial data overlay
Free with trial The flag of Burkina Faso with declining stock market graph and financial data overlay, symbolizing economic downturn, recession, or bearish market trends. Finance stock decrease illustrations The flag of Burkina Faso with declining stock market graph and financial data overlay
Free with trial The flag of Turkmenistan with declining stock market graph and financial data overlay, symbolizing economic downturn, recession, or bearish market trends. Finance stock decrease illustrations The flag of Turkmenistan with declining stock market graph and financial data overlay
Free with trial The flag of New Caledonia with declining stock market graph and financial data overlay, symbolizing economic downturn, recession, or bearish market trends. Finance stock decrease illustrations The flag of New Caledonia with declining stock market graph and financial data overlay
Free with trial The flag of Central Africa with declining stock market graph and financial data overlay, symbolizing economic downturn, recession, or bearish market trends. Finance stock decrease illustrations The flag of Central Africa with declining stock market graph and financial data overlay
Free with trial The flag of European Union with declining stock market graph and financial data overlay, symbolizing economic downturn, recession, or bearish market trends. Finance stock decrease illustrations The flag of European Union with declining stock market graph and financial data overlay
Free with trial The flag of Czech Republic with declining stock market graph and financial data overlay, symbolizing economic downturn, recession, or bearish market trends. Finance stock decrease illustrations The flag of Czech Republic with declining stock market graph and financial data overlay
Free with trial The flag of Trinidad and Tobago with declining stock market graph and financial data overlay, symbolizing economic downturn, recession, or bearish market trends. Finance stock decrease illustrations The flag of Trinidad and Tobago with declining stock market graph and financial data overlay
Free with trial The flag of North Macedonia with declining stock market graph and financial data overlay, symbolizing economic downturn, recession, or bearish market trends. Finance stock decrease illustrations The flag of North Macedonia with declining stock market graph and financial data overlay
Free with trial The flag of Papua New Guinea with declining stock market graph and financial data overlay, symbolizing economic downturn, recession, or bearish market trends. Finance stock decrease illustrations The flag of Papua New Guinea with declining stock market graph and financial data overlay
Free with trial The flag of Brunei Darussalam with declining stock market graph and financial data overlay, symbolizing economic downturn, recession, or bearish market trends. Finance stock decrease illustrations The flag of Brunei Darussalam with declining stock market graph and financial data overlay
Free with trial The flag of Bosnia and Herzegovina with declining stock market graph and financial data overlay, symbolizing economic downturn, recession, or bearish market trends. Finance stock decrease illustrations The flag of Bosnia and Herzegovina with declining stock market graph and financial data overlay
Free with trial The flag of China with declining stock market graph and financial data overlay, symbolizing economic downturn, recession, or bearish market trends. Finance stock decrease illustrations The flag of China with declining stock market graph and financial data overlay
Free with trial The flag of Guinea with declining stock market graph and financial data overlay, symbolizing economic downturn, recession, or bearish market trends. Finance stock decrease illustrations The flag of Guinea with declining stock market graph and financial data overlay
Free with trial The flag of Democratic Republic of the Congo with declining stock market graph and financial data overlay, symbolizing economic downturn, recession, or bearish market trends. Finance stock decrease illustrations The flag of Democratic Republic of the Congo with declining stock market graph and financial data overlay
Free with trial Generated with the use of AI. Stock market trading graph in red color as economy 3D illustration background. Trading trends and economic development. Generative AI. Finance stock decrease illustrations Stock market trading graph in red color as economy 3D illustration background. Trading trends and economic development. Generative
Free with trial Generated with the use of AI. Stock market trading graph in red color as economy 3D illustration background. Trading trends and economic development. Generative AI. Finance stock decrease illustrations Stock market trading graph in red color as economy 3D illustration background. Trading trends and economic development. Generative
Free with trial Generated with the use of AI. Stock market trading graph in red color as economy 3D illustration background. Trading trends and economic development. Generative AI. Finance stock decrease illustrations Stock market trading graph in red color as economy 3D illustration background. Trading trends and economic development. Generative
Free with trial Generated with the use of AI. Stock market trading graph in red color as economy 3D illustration background. Trading trends and economic development. Generative AI. Finance stock decrease illustrations Stock market trading graph in red color as economy 3D illustration background. Trading trends and economic development. Generative
Free with trial Gold bullion placed on a financial stock market chart background, representing investment, wealth, and market trends in the global economy. Finance stock decrease illustrations Gold bullion with financial chart, investment concept. Gold bullion placed on a financial stock market chart background, representing investment, wealth, and market trends in the global economy.
Free with trial Businessman falling with red arrow down and golden coins, symbolizing financial crisis, economic downturn, stock market crash, money loss, and business failure concept illustration. Finance stock decrease vectors Businessman sliding down red arrow with falling coins. Businessman falling with red arrow down and golden coins, symbolizing financial crisis, economic downturn, stock market crash, money loss, and business failure concept illustration
Free with trial Businesswoman falling with red arrow down and golden coins, symbolizing financial crisis, economic downturn, stock market crash, money loss, and business failure concept illustration. Finance stock decrease vectors Businesswoman sliding down red arrow with falling coins. Businesswoman falling with red arrow down and golden coins, symbolizing financial crisis, economic downturn, stock market crash, money loss, and business failure concept illustration
Free with trial Decline symbol. Red 3d arrow down icon isolated on white background. Finance stock decrease vectors Decline symbol. Red 3d arrow down icon
Free with trial Red bent arrow. Round return 3d symbol isolated on white background. Finance stock decrease vectors Red bent arrow. Round return 3d symbol
Free with trial Woman entrepreneur is experiencing problems in business, standing near falling chart and holding thermometer in mouth. Businesslady learned about company stagnation and decline in business indicators. Finance stock decrease vectors Woman entrepreneur is experiencing problems in business, standing near falling chart
Free with trial Arrow down in red 3d style. Fall symbol. Reduction sign isolated on white background. Finance stock decrease vectors Arrow down in red 3d style. Fall symbol. Reduction sign
Free with trial Businessman sets a goal about business development and income growth, man strives forward and upward on the growing graph to the piggy bank, banner. Flat vector illustration. Finance stock decrease vectors Businessman sets a goal about business development and income growth, man strives forward and upward on the growing
Free with trial Analytics, rising and falling trend. Deposits and loans. Economy and business. Income and Loss. Stock exchange trading. Finance stock decrease illustrations Analytics, rising and falling trend. Deposits and loans.
Free with trial Abstract striped red falling financial graph chart background. Vector tech design. Finance stock decrease vectors Abstract falling financial graph chart background. Abstract striped red falling financial graph chart background. Vector tech design
Free with trial Set of red 3D arrows pointing downward in various styles. Concept of business decline, market crash, or financial loss for economic visualization. Vector illustration. Finance stock decrease vectors Set of red 3D arrows pointing downward
Free with trial 3d Red arrow pointing downward with shattered gold coin pieces. Financial crisis concept illustrating business downturn, loss, and instability. Vector illustration. Finance stock decrease vectors 3d Red arrow downward with gold coin pieces. 3d Red arrow pointing downward with shattered gold coin pieces. Financial crisis concept illustrating business downturn, loss, and instability. Vector illustration
Free with trial Abstract blue green dotted financial graph chart sparkling background. Vector minimal tech design. Finance stock decrease vectors Abstract dotted financial graph chart sparkling background. Abstract blue green dotted financial graph chart sparkling background. Vector minimal tech design
Free with trial Decline graph line outline icon isolated on white. Vector illustration. Finance stock decrease vectors Decline graph line outline icon
Free with trial Business person examines financial data on a laptop, focusing on a declining graph and calculation symbols. The vector illustration highlights financial challenges and downturns faced by investments. Finance stock decrease vectors Business Crisis Analysis with Falling. Business person examines financial data on a laptop, focusing on a declining graph and calculation symbols. The vector illustration highlights financial challenges and downturns faced by investments.
Free with trial Top view of laptop with symbol of economic crash concept. Finance stock decrease illustrations Concept of economic crash. Top view of laptop with symbol of economic crash concept
Free with trial Concept of financial crisis with connected icons. Finance stock decrease illustrations Concept of financial crisis
Free with trial Decreasing bar graph with falling arrow as a metaphor for stock market crash business loss and economic crisis concept. Finance stock decrease illustrations Decreasing red graph symbolizing business loss and economic crisis. Decreasing bar graph with falling arrow as a metaphor for stock market crash business loss. Decreasing bar graph with falling arrow as a metaphor for stock market crash business loss and economic crisis concept
Free with trial Economic collapse concept above the hand of a woman in background. Finance stock decrease illustrations Concept of economic collapse. Economic collapse concept above the hand of a woman in background
Free with trial Dotted bull vs bear financial market chart background vector. Finance stock decrease vectors Dotted bull vs bear financial market chart background
Free with trial Bullish profit vs bearish loss market trade background vector. Finance stock decrease vectors Bullish profit vs bearish loss market trade background
Free with trial 3D bear market trading chart with Bitcoin coin symbol representing crypto bearish trend. Finance stock decrease illustrations 3D Bear Market icon. 3D bear market trading chart with Bitcoin coin symbol representing crypto bearish trend.
Free with trial Money Transfer Icons Set, Currency Exchange Logo, Crypto Financial Services. Vector illustration. Finance stock decrease vectors Money Transfer Icons Set, Currency Exchange Logo, Crypto Financial Services. Vector
Free with trial Money Transfer Icons Set, Currency Exchange Logo, Crypto Financial Services. Vector illustration. Finance stock decrease vectors Money Transfer Icons Set, Currency Exchange Logo, Crypto Financial Services. Vector
Free with trial A paper cutout illustration of two arrows, one red, one green, indicating upward & downward trends. Finance stock decrease illustrations Stock market growth red arrow outpacing. A paper cutout illustration of two arrows, one red, one green, indicating upward & downward trends
Free with trial House investment logo. sell and buy property logo. house arrow monogram. Finance stock decrease vectors House Investment Arrow Logo. house investment logo. sell and buy property logo. house arrow monogram
Free with trial A 3D illustration of a financial bar chart showing a drastic decline with a red arrow, symbolizing a stock market crash, recession, and economic loss. Finance stock decrease illustrations Market Crash 3D Bar Chart with Downward Arrow. A 3D illustration of a financial bar chart showing a drastic decline with a red arrow, symbolizing a stock market crash, recession, and economic loss
Free with trial Learning from mistakes concept, analyze the crash in the stock market crash, learn from investment failure mistakes, businessman holding a magnifying glass to find the cause of the stock chart fall. Finance stock decrease vectors Learning from mistakes concept
Free with trial A person meticulously studies complex financial or historical data displayed on a paper chart. The brass-rimmed magnifying glass highlights crucial upticks and downward trends in the graph line. Rendered by Ai. This scene captures the essence of deep research, analysis, and discovery in a vintage setting. Finance stock decrease illustrations Magnifying glass focused on a detailed stock chart. A person meticulously studies complex financial or historical data displayed on a paper chart. The brass-rimmed magnifying glass highlights crucial upticks and downward trends in the graph line. Rendered by Ai. This scene captures the essence of deep research, analysis, and discovery in a vintage setting
Free with trial A minimalist, black and white vector illustration depicting a financial graph with a clear downward trend. The graph features a jagged line representing fluctuating data, leading into a bold, thick arrow pointing downwards and to the right. This icon symbolizes decline, loss, recession, or negative performance in various contexts, such as business, economics, or stock markets. Its clean design makes it versatile for presentations, websites, and infographics. Finance stock decrease vectors Downward Trend Graph with Arrow Icon. A minimalist, black and white vector illustration depicting a financial graph with a clear downward trend. The graph features a jagged line representing fluctuating data, leading into a bold, thick arrow pointing downwards and to the right. This icon symbolizes decline, loss, recession, or negative performance in various contexts, such as business, economics, or stock markets. Its clean design makes it versatile for presentations, websites, and infographics.
Free with trial Cartoon Color Economic Decline Chart Crisis Concept Flat Design Style and Line Elements. Vector illustration of Financial Failure. Finance stock decrease vectors Cartoon Color Economic Decline Chart Crisis Concept. Vector. Cartoon Color Economic Decline Chart Crisis Concept Flat Design Style and Line Elements. Vector illustration of Financial Failure
Free with trial Dotted style bull vs bear investing trade background vector. Finance stock decrease vectors Dotted style bull vs bear investing trade background
Free with trial A hand holding magnifying glass focus on Inflation text. Downtrend price movement to show the hyper inflation has started. Symbol, icon and presentation for economy, trading stock market and forex. Finance stock decrease illustrations Magnifying glass focus on Inflation text.
Free with trial A clean and modern vector illustration featuring graphic symbols for business growth and decline. This EPS file shows an upward-trending green arrow for success and a downward-trending red arrow for loss, both depicted on a stylized financial chart. Ideal for corporate presentations, financial reports, economic analysis, and stock market metaphors. Finance stock decrease vectors Growth And Decline Chart Graphic Symbol. A clean and modern vector illustration featuring graphic symbols for business growth and decline. This EPS file shows an upward-trending green arrow for success and a downward-trending red arrow for loss, both depicted on a stylized financial chart. Ideal for corporate presentations, financial reports, economic analysis, and stock market metaphors.
Free with trial Wavy green arrows visualizing market movement, trend fluctuation, and economic volatility, depicting both growth and decline, ideal for financial data and business analytics concepts. Finance stock decrease illustrations Wavy arrows showing up and down fluctuation trend. Wavy green arrows visualizing market movement, trend fluctuation, and economic volatility, depicting both growth and decline, ideal for financial data and business analytics concepts
Free with trial Unsuccessful investments cause negative emotions in woman standing among declining charts. Girl had bad luck and lost income or investments due to crisis and lack of financial analysis. Finance stock decrease vectors Unsuccessful investments cause negative emotions in woman standing among declining charts
Free with trial Business graphic vector set. Chart line, round and candlestick graph trend glassmorphism effect. Transparent glass blur button on gradient arrows. Financial diagram statistics with percentage sign. Finance stock decrease vectors Business graphic vector set, chart line, round and candlestick graph glassmorphism effect, glass blur button on arrow. Business graphic vector set. Chart line, round and candlestick graph trend glassmorphism effect. Transparent glass blur button on gradient arrows. Financial diagram statistics with percentage sign
Free with trial A simple flat design graphic illustrates stock market growth and decline using green upward and red downward arrows with bar charts. Ideal for finance and business concepts. Finance stock decrease vectors Bar chart showing financial growth and decline. A simple flat design graphic illustrates stock market growth and decline using green upward and red downward arrows with bar charts. Ideal for finance and business concepts
Free with trial Black arrows illustrating an upward and downward zigzag fluctuation, symbolizing a dynamic process of movement, change, and varying trends on a clean white background. Finance stock decrease vectors Fluctuation movement with up and down zigzag arrows. Black arrows illustrating an upward and downward zigzag fluctuation, symbolizing a dynamic process of movement, change, and varying trends on a clean white background
Free with trial Abstract financial data display showing fluctuating market trends. Finance stock decrease illustrations Glowing Financial Stock Market Data Analysis Chart. Abstract financial data display showing fluctuating market trends
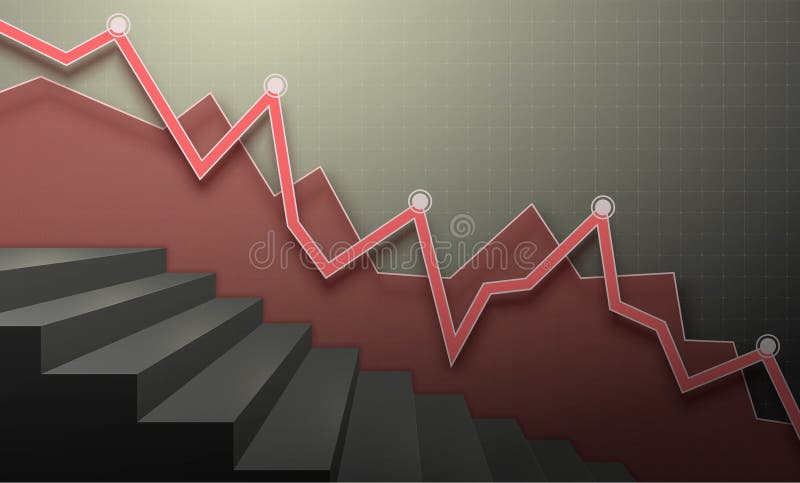
Free with trial Red financial chart with descending lines and a ladder. Vector 3D illustration. Finance stock decrease vectors Red financial chart with descending lines and a ladder. Vector 3D
Free with trial A flat design bar chart displays a downward trend, highlighted by a red arrow. Minimalist graphic, illustrative style. Finance stock decrease vectors Flat bar chart showing downward trend with red arrow. A flat design bar chart displays a downward trend, highlighted by a red arrow. Minimalist graphic, illustrative style.
Free with trial Problem of bankruptcy for girl lost savings due to financial crisis, sitting near falling economic chart. Girl is bankruptcy fighter after being fired from job and losing investments. Finance stock decrease vectors Problem of bankruptcy for girl lost savings due to financial crisis, sitting near falling chart. Problem of bankruptcy for girl lost savings due to financial crisis, sitting near falling economic chart. Girl is bankruptcy fighter after being fired from job and losing investments.