Free with trial 3D bar chart with red arrows pointing upwards, reflecting off a shiny, blue surface. The clean, minimalist design symbolizes financial growth, business success, and positive market trends. Ideal for use in presentations, financial reports, and marketing materials related to investment, stock market, and economic progress. Finance stock decrease illustrations Financial Growth 3D Bar Chart with Red Arrows. 3D bar chart with red arrows pointing upwards, reflecting off a shiny, blue surface. The clean, minimalist design symbolizes financial growth, business success, and positive market trends. Ideal for use in presentations, financial reports, and marketing materials related to investment, stock market, and economic progress
Free with trial A minimalist graphic illustration of a downward financial trend features a green line graph with three vertical bars topped by dollar signs, where the first bar is green, the second yellow, and the third orange, symbolizing decreasing monetary value, set against a clean white background with scattered dollar signs emphasizing economic decline, conveying a clear message of financial loss, market. Finance stock decrease illustrations Downward financial trend with colored dollar signs on white background. A minimalist graphic illustration of a downward financial trend features a green line graph with three vertical bars topped by dollar signs, where the first bar is green, the second yellow, and the third orange, symbolizing decreasing monetary value, set against a clean white background with scattered dollar signs emphasizing economic decline, conveying a clear message of financial loss, market
Free with trial A conceptual illustration of digital currency coins with a financial candlestick chart in the background, representing cryptocurrency market fluctuations and investment trends. Finance stock decrease vectors Digital currency coins on financial stock market candlestick chart showing trading trends and investment growth. a conceptual illustration of digital currency coins with a financial candlestick chart in the background, representing cryptocurrency market fluctuations and investment trends
Free with trial Concept of economic crash with connected icons. Finance stock decrease illustrations Concept of economic crash
Free with trial Money Transfer Icons Set, Currency Exchange Logo, Crypto Financial Services. Vector illustration. Finance stock decrease vectors Money Transfer Icons Set, Currency Exchange Logo, Crypto Financial Services. Vector
Free with trial Black silhouette of a descending graph with arrow for business decline concepts. Finance stock decrease vectors Black silhouette of a descending graph with arrow for business decline concepts.
Free with trial A 3D png of a red jagged arrow pointing downwards. This graphic represents a decline in stock markets, financial loss, economic recession, or a negative business trend, isolated on a white background. Finance stock decrease vectors Red downward trend arrow financial crisis concept isolated on transparent background. A 3D png of a red jagged arrow pointing downwards. This graphic represents a decline in stock markets, financial loss, economic recession, or a negative business trend, isolated on a white background.
Free with trial A downward arrow made of smoke indicates economic loss in a dark setting, symbolizing market decline. Finance stock decrease illustrations Smoke arrow pointing down showing economic loss in a dark background Generative AI. A downward arrow made of smoke indicates economic loss in a dark setting, symbolizing market decline
Free with trial An abstract digital financial chart features multiple vibrant, fluctuating neon lines in blue, green, pink, and white, set against a dark grid background. Prominent red upward and downward arrows, along with a green downward arrow, clearly indicate market trends, growth, and decline. Interspersed geometric shapes connected by lines suggest complex data points and network connections. This dynamic visualization is ideal for illustrating concepts of stock market data, cryptocurrency trends, business analytics, investment volatility, big data, AI, and financial technology, suitable for modern business and tech-related projects. Finance stock decrease illustrations Digital Financial Data Chart with Fluctuating Lines and Arrows. An abstract digital financial chart features multiple vibrant, fluctuating neon lines in blue, green, pink, and white, set against a dark grid background. Prominent red upward and downward arrows, along with a green downward arrow, clearly indicate market trends, growth, and decline. Interspersed geometric shapes connected by lines suggest complex data points and network connections. This dynamic visualization is ideal for illustrating concepts of stock market data, cryptocurrency trends, business analytics, investment volatility, big data, AI, and financial technology, suitable for modern business and tech-related projects.
Free with trial A striking visual depicting a golden coin with intricate patterns standing upright against a dark, reflective background. A vibrant, glowing red arrow dramatically points downwards towards the coin, symbolizing financial decline, market downturn, or a significant loss in value. This powerful image effectively conveys concepts like investment risk, economic crisis, depreciation of assets, and falling prices. Ideal for illustrating articles, reports, or presentations on financial challenges, stock market crashes, investment warnings, and economic trends. Finance stock decrease illustrations Golden Coin and Red Downward Arrow: Financial Decline Concept. A striking visual depicting a golden coin with intricate patterns standing upright against a dark, reflective background. A vibrant, glowing red arrow dramatically points downwards towards the coin, symbolizing financial decline, market downturn, or a significant loss in value. This powerful image effectively conveys concepts like investment risk, economic crisis, depreciation of assets, and falling prices. Ideal for illustrating articles, reports, or presentations on financial challenges, stock market crashes, investment warnings, and economic trends.
Free with trial Green arrow pointing downward on financial graph. Business chart with falling trend line. Digital stock market data visualization for investment analysis. Finance stock decrease illustrations Green arrow pointing downward on financial graph. Business chart with falling trend line
Free with trial Red arrow pointing downward on financial graph. Business chart showing recession in economy. Digital stock market data visualization for investment analysis. Finance stock decrease illustrations Red arrow pointing downward on financial graph. Business chart showing recession in economy
Free with trial A high-quality conceptual image featuring a row of smooth wooden cubes spelling the word "PESSIMISM" on a wooden surface. The arrangement includes a stacked block showing a sad face emoticon and a downward-sloping line graph, symbolizing financial loss, recession, negative market sentiment, and psychological discouragement in a professional or personal context. Finance stock decrease illustrations Wooden Blocks Spelling Pessimism with Sad Face Icon and Downward Trend Graph. A high-quality conceptual image featuring a row of smooth wooden cubes spelling the word "PESSIMISM" on a wooden surface. The arrangement includes a stacked block showing a sad face emoticon and a downward-sloping line graph, symbolizing financial loss, recession, negative market sentiment, and psychological discouragement in a professional or personal context.
Free with trial Red and grey arrows pointing up and down. Finance stock decrease illustrations Red and grey arrows pointing up and down
Free with trial Displaying jagged red line chart declining on trading screen, with numeric labels and lens-flare. Financial, technology, analytics, investment, data visualization, digital, modern. Finance stock decrease illustrations Displaying jagged red line chart declining on trading screen, with numeric labels and lens-flare
Free with trial Stock showing diverse collection of black and white for financial data analysis charts and graphs keywords: financial, data, analysis, charts. Finance stock decrease illustrations Diverse Collection of Black and White for Financial Data Analysis Charts and Graphs Keywords: financial, data
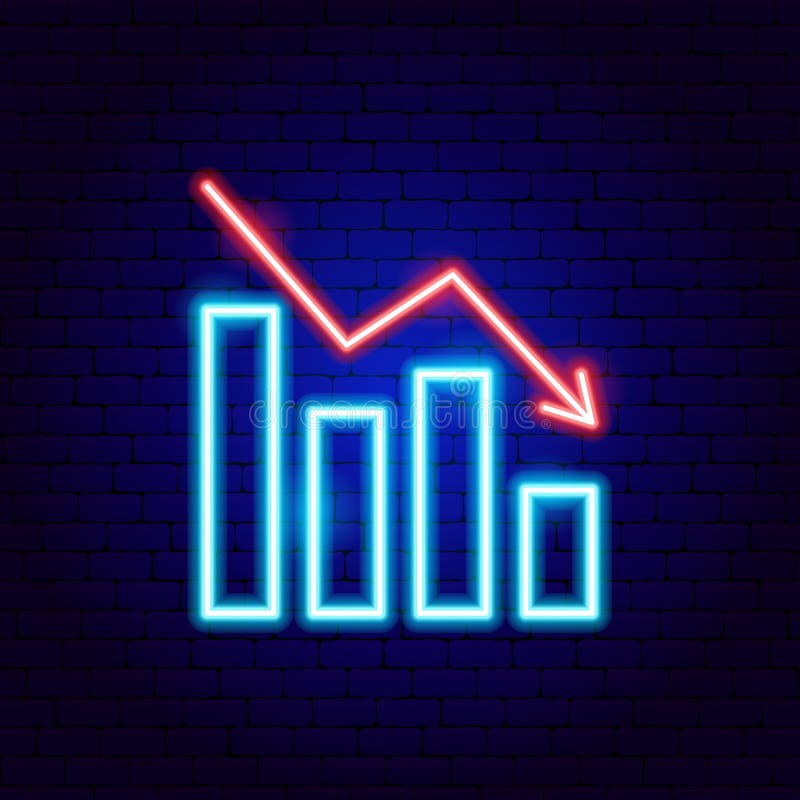
Free with trial Loss Graph Neon Sign. Vector Illustration of Analytics Data Symbol. Finance stock decrease vectors Loss Graph Neon Sign
Free with trial Line graph with a green line and a red dot on top. The red dot is located at the top left corner of the graph. Finance stock decrease illustrations Graph with a green line and a red dot
Free with trial This isometric illustration shows a delicious breakfast plate alongside a stock market graph, representing the connection between food trends and market data. The visual, generated by AI, is perfect for illustrating articles about food market analysis or investment opportunities in the food industr. Finance stock decrease illustrations Breakfast Market Trends. This isometric illustration shows a delicious breakfast plate alongside a stock market graph, representing the connection between food trends and market data. The visual, generated by AI, is perfect for illustrating articles about food market analysis or investment opportunities in the food industr
Free with trial A conceptual image representing financial loss, economic downturn, or business failure. A person's hands are holding and seemingly guiding a glowing red line graph that is pointing sharply downwards. The arrow at the end confirms the negative trend. The neutral background keeps the focus on this clear symbol of decline. Generative AI. Finance stock decrease illustrations Two hands holding a glowing red line graph that is trending downwards. A conceptual image representing financial loss, economic downturn, or business failure. A person's hands are holding and seemingly guiding a glowing red line graph that is pointing sharply downwards. The arrow at the end confirms the negative trend. The neutral background keeps the focus on this clear symbol of decline. Generative AI.
Free with trial Four vibrant lines undulating on a dark dashboard, illustrating progress over time while emphasizing key data points with distinct circles for enhanced clarity and analysis. Finance stock decrease vectors Four vibrant lines undulating on a dark dashboard, illustrating progress over time while emphasizing key data points
Free with trial The image shows a downward trending line graph, rendered in a bright, neon blue. the line is composed of many small dots, giving it a somewhat ethereal appearance. the background resembles a stage or auditorium, with rows of seats and stage lighting. the overall impression is one of decline or loss, perhaps representing a financial downturn or a negative trend in some other area. the lighting adds a sense of drama and importance to the image. Finance stock decrease illustrations Stock market crash with dramatic stage lighting. the image shows a downward trending line graph, rendered in a bright, neon blue. the line is composed of many small dots, giving it a somewhat ethereal appearance. the background resembles a stage or auditorium, with rows of seats and stage lighting. the overall impression is one of decline or loss, perhaps representing a financial downturn or a negative trend in some other area. the lighting adds a sense of drama and importance to the image.
Free with trial A stock market graph depicting a downturn is shown through a rain-covered window. The image, generated by AI, creates a mood of economic uncertainty and pessimism. The blurred background adds to the overall sense of ambiguity. Finance stock decrease illustrations Rainy Day Market Decline. A stock market graph depicting a downturn is shown through a rain-covered window. The image, generated by AI, creates a mood of economic uncertainty and pessimism. The blurred background adds to the overall sense of ambiguity.
Free with trial A conceptual illustration featuring a large white downward arrow and the text PRICE DROP on a deeply cracked red surface, symbolizing a stock market crash or significant economic decline. Finance stock decrease illustrations Price Drop Concept with Downward Arrow on Cracked Red Surface Representing Economic Collapse. A conceptual illustration featuring a large white downward arrow and the text PRICE DROP on a deeply cracked red surface, symbolizing a stock market crash or significant economic decline
Free with trial Sketchy bar graph illustration of financial decline and economic loss. Finance stock decrease vectors Sketchy bar graph illustration of financial decline and economic loss
Free with trial Colorful line graph illustrating growth and decline over time, with variously colored data points on a dark background, visualizing financial performance and trends. Finance stock decrease vectors Colorful line graph illustrating growth and decline over time, with variously colored data points on a dark background
Free with trial A digital financial chart shows upward market trends. The red line and green bars rise against a grid. A gold data network overlay adds depth to the business graphic. Finance stock decrease illustrations Growing Financial Chart Shows Market Growth With Data Grid Background. A digital financial chart shows upward market trends. The red line and green bars rise against a grid. A gold data network overlay adds depth to the business graphic.
Free with trial A hand holds a piece of paper showing a sharply declining graph, representing a downturn in the market. The image is generated by AI and symbolizes financial loss or economic recession. Finance stock decrease illustrations Falling Stock Market Graph. A hand holds a piece of paper showing a sharply declining graph, representing a downturn in the market. The image is generated by AI and symbolizes financial loss or economic recession.
Free with trial A colorful graph with the words Net Income written below it. The graph is made up of many different colored lines and dots. Finance stock decrease illustrations A colorful graph with the words Net Income written below it
Free with trial A laptop screen displays financial data, illuminated against a blurry background, suggesting analysis. Finance stock decrease illustrations Laptop displays dynamic financial data represented in charts and graphs. A laptop screen displays financial data, illuminated against a blurry background, suggesting analysis
Free with trial A golden house miniature sits on a smartphone screen displaying stock market charts, surrounded by stacks of gold coins. This image represents the concept of investing in real estate through mobile apps and online platforms, highlighting the potential for financial growth and digital investment strategies in the property market. Finance stock decrease illustrations Real Estate Investment on Mobile. A golden house miniature sits on a smartphone screen displaying stock market charts, surrounded by stacks of gold coins. This image represents the concept of investing in real estate through mobile apps and online platforms, highlighting the potential for financial growth and digital investment strategies in the property market.
Free with trial Red arrow pointing down and crashing stock market chart representing financial crisis, recession and economic downturn. Finance stock decrease illustrations Market crash showing economic downturn with falling chart and percentage symbol. Red arrow pointing down and crashing stock market chart representing financial crisis, recession and economic downturn
Free with trial Hand pushing on a declining graph representing business regression and stock market downturns. Finance stock decrease illustrations Business regression
Free with trial Hand pushing on a declining graph representing business regression and stock market downturns. Finance stock decrease illustrations Business regression
Free with trial Individuals analyzing energy consumption and associated costs, with large bill, gas meter, and monetary symbols, emphasizing efficient resource management and cost-saving vector illustration. Finance stock decrease vectors Energy consumption and cost analysis concept. individuals analyzing energy consumption and associated costs, with large bill, gas meter, and monetary symbols, emphasizing efficient resource management and cost-saving vector illustration.
Free with trial An abstract digital rendering of a financial market chart with a prominent red line indicating fluctuations in a stock market or trading scenario, set against a background of data streams and numerical information. It can be used for visualizing economic trends or for representing financial analytics. Finance stock decrease illustrations Abstract financial chart depicting market trends and data analysis interface. An abstract digital rendering of a financial market chart with a prominent red line indicating fluctuations in a stock market or trading scenario, set against a background of data streams and numerical information. It can be used for visualizing economic trends or for representing financial analytics
Free with trial Cost reduction icon price lower arrow. Vector low cost money crisis line icon. Finance stock decrease vectors Cost reduction icon price lower arrow. Vector low cost money crisis line icon
Free with trial A shiny red arrow curves downwards, indicating a downward trend or negative growth. This image visually represents concepts like financial decline market crash or falling stock prices. Finance stock decrease illustrations Red arrow points downward showing decline trend and negative growth concept. A shiny red arrow curves downwards, indicating a downward trend or negative growth. This image visually represents concepts like financial decline market crash or falling stock prices
Free with trial Business crisis and financial recession vector concept. Symbol of downturn, fall, bankruptcy. Minimal design eps10 illustration. Finance stock decrease vectors Business crisis and financial recession vector concept. Symbol of downturn, fall, bankruptcy. Minimal illustration.
Free with trial Falling financial chart with a sharp decline. Space for text. Finance stock decrease illustrations Falling financial chart with a sharp decline. Space for text.
Free with trial Drawn down arrow trend graph depicting financial decline and economic downturn. Finance stock decrease vectors Drawn down arrow trend graph depicting financial decline and economic downturn
Free with trial Top view of hands using laptop with symbol of economic crash concept. Finance stock decrease illustrations Concept of economic crash. Top view of hands using laptop with symbol of economic crash concept
Free with trial Falling bar chart with up and right arrows illustrating declining business trends. Finance stock decrease vectors Falling bar chart with up and right arrows illustrating declining business trends
Free with trial A vibrant image featuring a thick, textured green arrow pointing upwards, symbolizing growth, success, and progress. Contrasting this, a bold red arrow points downwards, representing decline, loss, and failure. Both arrows are rendered with a painterly style, suggesting a hand-drawn or artistic representation of financial or market trends. The clean white background isolates the arrows, emphasizing their symbolic meaning. This visual is ideal for illustrating concepts like stock market fluctuations, business performance, positive and negative trends, or decision-making. Finance stock decrease illustrations Up and Down Arrows: Growth vs. Decline. A vibrant image featuring a thick, textured green arrow pointing upwards, symbolizing growth, success, and progress. Contrasting this, a bold red arrow points downwards, representing decline, loss, and failure. Both arrows are rendered with a painterly style, suggesting a hand-drawn or artistic representation of financial or market trends. The clean white background isolates the arrows, emphasizing their symbolic meaning. This visual is ideal for illustrating concepts like stock market fluctuations, business performance, positive and negative trends, or decision-making.
Free with trial A 3D rendered image depicts a teal bar graph with a sharply downward trending red arrow. Gold coins with dollar signs are scattered around the graph, some appearing to fall. A large gold dollar sign rests near the base of the graph. The background is a blurred cityscape at night. The overall mood is one of financial downturn or crisis. The style is realistic 3D rendering with a focus on metallic. Finance stock decrease illustrations 3 D Render Falling Stock Market Graph Teal Red Gold Coins. A 3D rendered image depicts a teal bar graph with a sharply downward trending red arrow. Gold coins with dollar signs are scattered around the graph, some appearing to fall. A large gold dollar sign rests near the base of the graph. The background is a blurred cityscape at night. The overall mood is one of financial downturn or crisis. The style is realistic 3D rendering with a focus on metallic
Free with trial Dark grey descending bar chart with arrow indicating decline on white background. Finance stock decrease illustrations Dark grey descending bar chart with arrow indicating decline on white background
Free with trial Businessman on percentage sign with falling down. Depicts Inflation, decline, falling profits in an economic recession and falling stock market values. Success talent concept. Finance stock decrease vectors Profit Fall in Economic Recession. Businessman on Percentage Sign with Falling Down. Businessman on percentage sign with falling down. Depicts Inflation, decline, falling profits in an economic recession and falling stock market values. Success talent concept
Free with trial Hand loss business graph crisis chart diagram financial economy on down arrow investment market background of digital technology inflation strategy economic stock. Finance stock decrease illustrations Hand loss business graph crisis chart diagram financial economy on down arrow investment market background of digital technology
Free with trial A 3D illustration depicts a financial chart with a downward trend. Four vertical bars, colored yellow, orange, and green, are arranged in descending order of height, suggesting a decline. To the left, a prominent orange circle contains a white downward-pointing arrow, reinforcing the theme of a negative trend or decrease. The entire composition is set against a plain white background. Finance stock decrease illustrations Financial chart with downward trend indicator stock market. A 3D illustration depicts a financial chart with a downward trend. Four vertical bars, colored yellow, orange, and green, are arranged in descending order of height, suggesting a decline. To the left, a prominent orange circle contains a white downward-pointing arrow, reinforcing the theme of a negative trend or decrease. The entire composition is set against a plain white background
Free with trial Financial Growth Chart on a Suitcase Business Investment Economy Graphic Illustration. Finance stock decrease vectors Financial Growth Chart on a Suitcase Business Investment Economy Graphic Illustration
Free with trial A financial graph depicting a decline, featuring vibrant red and yellow candlesticks on a sleek digital background, conveying market downturns. Finance stock decrease illustrations Digital stock market chart showing a downward trend with red and yellow candlesticks. A financial graph depicting a decline, featuring vibrant red and yellow candlesticks on a sleek digital background, conveying market downturns
Free with trial Red graph plummeting down with the word crash superposed, representing a financial crisis. Finance stock decrease illustrations Stock market crashing showing economic crisis. Red graph plummeting down with the word crash superposed, representing a financial crisis
Free with trial A clear glass jar labeled 'savings' tips over, spilling gold and silver coins onto a reflective surface, with a red downward trending graph in the background symbolizing financial loss or economic decline. Finance stock decrease illustrations Glass jar labeled savings spilling coins with downward trending graph. A clear glass jar labeled 'savings' tips over, spilling gold and silver coins onto a reflective surface, with a red downward trending graph in the background symbolizing financial loss or economic decline
Free with trial 3D bar chart with red arrows pointing upwards, reflecting off a shiny, blue surface. The clean, minimalist design symbolizes financial growth, business success, and positive market trends. Ideal for use in presentations, financial reports, and marketing materials related to investment, stock market, and economic progress. Finance stock decrease illustrations Financial Growth 3D Bar Chart with Red Arrows. 3D bar chart with red arrows pointing upwards, reflecting off a shiny, blue surface. The clean, minimalist design symbolizes financial growth, business success, and positive market trends. Ideal for use in presentations, financial reports, and marketing materials related to investment, stock market, and economic progress
Free with trial Pointer with downward arrow on the gray mirror background. Eps 10 vector file. Finance stock decrease vectors Stock Market Crash Red Button. Pointer with downward arrow on the gray mirror background. Eps 10 vector file
Free with trial A person analyzing stock market data on multiple computer screens, indicating financial trends, likely related to investments or trading. Finance stock decrease illustrations A man watches financial data on multiple computer screens in a dark office. A person analyzing stock market data on multiple computer screens, indicating financial trends, likely related to investments or trading
Free with trial Hand holding tablet with red downward trend graph, digital style on dark office background, concept of financial crisis and market collapse. Finance stock decrease illustrations Businessman holding tablet with falling stock market graph and red arrows representing financial crisis and global economic. Hand holding tablet with red downward trend graph, digital style on dark office background, concept of financial crisis and market collapse
Free with trial The concept of a business financial crash depicted by a vibrant 3D rendering of a declining chart. Finance stock decrease illustrations The concept of a business financial crash depicted by a vibrant 3D rendering of a declining chart.
Free with trial This image represents a financial crisis with a downward trend and a broken surface. Finance stock decrease illustrations Economic downturn concept with a red graph and a blue arrow pointing down. This image represents a financial crisis with a downward trend and a broken surface
Free with trial Economic recession symbol with a sharp jagged arrow pointing down indicating a market crash. Finance stock decrease vectors Economic recession symbol with a sharp jagged arrow pointing down indicating a market crash
Free with trial Business decline and economic recession concept with a falling bar graph and a downward red arrow. Finance stock decrease vectors Business decline and economic recession concept with a falling bar graph and a downward red arrow
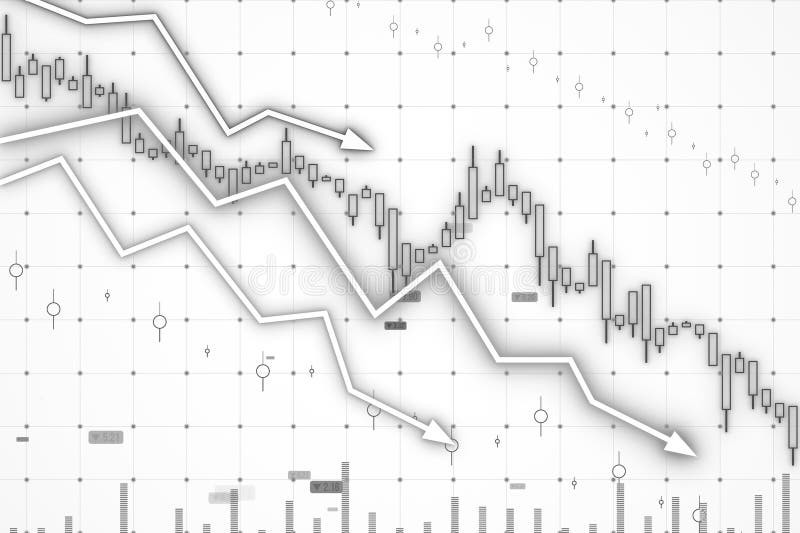
Free with trial Photo of handwritten charts illustrating inflation and potential recession. Graphs show rising prices and economic downturn concerns. Financial crisis concept depicted with, business. Finance stock decrease illustrations Photo of handwritten charts illustrating inflation and potential recession. Graphs show rising prices and economic downturn
Free with trial Colorful blocks in decreasing order on a blue surface. Represents decline or recession in a vibrant, illustrative manner. Stock photo. Finance stock decrease illustrations Colorful blocks in decreasing order on a blue surface. Represents decline or recession in a vibrant, illustrative manner
Free with trial This image displays a financial growth chart, featuring both a candlestick chart and a bar graph, laid out on a wooden surface. The candlestick chart illustrates stock market fluctuations with red and green candles, while the bar graph shows increasing values over time. The overall composition suggests positive financial trends, investment performance, and economic progress. It's ideal for representing concepts like business growth, market analysis, financial planning, and investment strategies. Finance stock decrease illustrations Financial Growth Chart with Candlestick and Bar Graph. This image displays a financial growth chart, featuring both a candlestick chart and a bar graph, laid out. This image displays a financial growth chart, featuring both a candlestick chart and a bar graph, laid out on a wooden surface. The candlestick chart illustrates stock market fluctuations with red and green candles, while the bar graph shows increasing values over time. The overall composition suggests positive financial trends, investment performance, and economic progress. It's ideal for representing concepts like business growth, market analysis, financial planning, and investment strategies.
Free with trial Graph showing a line that is green and has a black background. The line is going up and to the right. Finance stock decrease illustrations Graph showing a line that is green and has a black background
Free with trial A dynamic display of market trends with charts and graphs in a cool blue color scheme. Finance stock decrease illustrations Financial market analysis with data charts and line graphs in blue tone. a dynamic display of market trends with charts and graphs in a cool blue color scheme
Free with trial A graph showing a downward trend on a grid background. 3D Rendering. Finance stock decrease illustrations Declining stock market trend illustration. 3D Rendering. A graph showing a downward trend on a grid background. 3D Rendering
Free with trial Digital red graph with falling stock price on large screen in bright corporate office, concept of financial crisis and economic collapse, 3D Rendering. Finance stock decrease illustrations Red downward financial chart on screen in modern office showing market crash, economic recession, and global investment crisis. Digital red graph with falling stock price on large screen in bright corporate office, concept of financial crisis and economic collapse, 3D Rendering
Free with trial Digital red graph with falling stock price on large screen in bright corporate office, concept of financial crisis and economic collapse, 3D Rendering. Finance stock decrease illustrations Red downward financial chart on screen in modern office showing market crash, economic recession, and global investment crisis. Digital red graph with falling stock price on large screen in bright corporate office, concept of financial crisis and economic collapse, 3D Rendering
Free with trial Graph with a green arrow pointing upwards. The graph is labeled with numbers and the numbers are increasing. Finance stock decrease illustrations Graph with a green arrow pointing upwards
Free with trial Blue arrow points down beside stack of gold coins with dollar sign. Conceptual graphic represents financial decline, market crash or economic recession. Finance stock decrease illustrations Blue arrow points down beside stack of gold coins with dollar sign. Conceptual graphic represents financial decline, market
Free with trial This image depicts a financial downturn concept, featuring a candlestick chart with downward-pointing arrows. The dark blue background emphasizes the negative trend and market decline. Perfect for illustrating financial reports, economic analysis, or business presentations about market volatility and investment risks. Finance stock decrease illustrations Financial Downturn Concept Stock Market Crash with Arrows and Candles on Dark Blue Background. This image depicts a financial downturn concept, featuring a candlestick chart with downward-pointing arrows. The dark blue background emphasizes the negative trend and market decline. Perfect for illustrating financial reports, economic analysis, or business presentations about market volatility and investment risks.
Free with trial A shattered surface reflects falling financial graphs, while a distant cityscape blurred behind conveys uncertainty and instability in urban markets. Finance stock decrease illustrations Digital stock market decline over a cracked surface with a blurred city skyline in the background. A shattered surface reflects falling financial graphs, while a distant cityscape blurred behind conveys uncertainty and instability in urban markets
Free with trial A financial chart showing declining index lines in blue shades on a grid-style white background. Concept of market analysis and trends. 3D Rendering. Finance stock decrease illustrations Financial chart with declining index lines on grid background. 3D Rendering. A financial chart showing declining index lines in blue shades on a grid-style white background. Concept of market analysis and trends. 3D Rendering
Free with trial World map with a prominent red downward trend line indicating a global recession or financial market crash. Red arrows pointing downwards are superimposed over different continents, emphasizing a global economic downturn. The map is illuminated in shades of blue and purple against a dark background, enhancing the visual impact of the red elements. The composition suggests widespread economic decline across various regions. Finance stock decrease illustrations Global recession and financial market crash shown by a declining red graph and arrows over a world map. World map with a prominent red downward trend line indicating a global recession or financial market crash. Red arrows pointing downwards are superimposed over different continents, emphasizing a global economic downturn. The map is illuminated in shades of blue and purple against a dark background, enhancing the visual impact of the red elements. The composition suggests widespread economic decline across various regions.
Free with trial This 3D rendering illustrates economic crisis and financial loss with decreasing coin stacks displayed on a smartphone. The image visualizes recession, bankruptcy, and debt using a minimalist, modern design. Ideal for depicting investment risk, stock market downturns, or negative financial trends in business and digital media. Use this graphic to communicate complex economic concepts effectively. Finance stock decrease illustrations Economic crisis depicted with decreasing coin stacks on a phone 3d render. This 3D rendering illustrates economic crisis and financial loss with decreasing coin stacks displayed on a smartphone. The image visualizes recession, bankruptcy, and debt using a minimalist, modern design. Ideal for depicting investment risk, stock market downturns, or negative financial trends in business and digital media. Use this graphic to communicate complex economic concepts effectively
Free with trial Businessman looking at a stock market chart showing financial crisis and falling profits. Finance stock decrease illustrations Businessman thinking about business decline and financial loss. Businessman looking at a stock market chart showing financial crisis and falling profits
Free with trial Stacks of coins in increasing height arranged on a dark surface, with a blurred, falling stock market graph in red in the background, depicting financial loss. Image is generated using AI. Finance stock decrease illustrations Stacks Of Coins With Falling Graph. Stacks of coins in increasing height arranged on a dark surface, with a blurred, falling stock market graph in red in the background, depicting financial loss. Image is generated using AI
Free with trial A comprehensive set of minimalist linear icons depicting financial analytics and business trends, featuring stacks of coins and both upward and downward trending bar charts. Finance stock decrease vectors Linear Business and Financial Growth Icon Set for Analytics, Investment, and Economic Trend Visualization. A comprehensive set of minimalist linear icons depicting financial analytics and business trends, featuring stacks of coins and both upward and downward trending bar charts.
Free with trial AI-generated image of a hand removing one star from a three-star rating, reflecting poor service, negative reviews, and consumer frustration. Perfect for brand reputation, online reviews, and feedback analysis. Keywords: rating, review, customer, dissatisfaction, star, feedback, negative, opinion, quality, experience, drop, product, poor, hand, score,one star review photo, customer dissatisfaction concept, service quality drop image, online rating removal visual, bad product experience photo, feedback and rating stock image, brand trust issues, AI-generated complaint photo, consumer opinion reaction, poor service concept. Finance stock decrease illustrations One Star Rating Drop Showing Customer Dissatisfaction. AI-generated image of a hand removing one star from a three-star rating, reflecting poor service, negative reviews, and consumer frustration. Perfect for brand reputation, online reviews, and feedback analysis.Keywords: rating, review, customer, dissatisfaction, star, feedback, negative, opinion, quality, experience, drop, product, poor, hand, score,one star review photo, customer dissatisfaction concept, service quality drop image, online rating removal visual, bad product experience photo, feedback and rating stock image, brand trust issues, AI-generated complaint photo, consumer opinion reaction, poor service concept