Free with trial A modern flat design concept illustrating business analytics and sales performance. The scene features a laptop and smartphone displaying a dashboard with various charts, graphs, and statistics for a Q3 report. A world map with a magnifying glass signifies global market analysis and regional breakdown. Additional elements like a checklist and growth decrease icons represent strategic planning, auditing, and financial review. This versatile vector illustration is perfect for presentations, marketing materials, and web design related to finance, data visualization, and business intelligence. Illustration business decrease illustrations Business Analytics and Sales Performance Report Dashboard. A modern flat design concept illustrating business analytics and sales performance. The scene features a laptop and smartphone displaying a dashboard with various charts, graphs, and statistics for a Q3 report. A world map with a magnifying glass signifies global market analysis and regional breakdown. Additional elements like a checklist and growth decrease icons represent strategic planning, auditing, and financial review. This versatile vector illustration is perfect for presentations, marketing materials, and web design related to finance, data visualization, and business intelligence.
Free with trial Business risk and crisis concept. Young businessman in tie hanging dangerously on edge of cliff holding by one hand feeling unconfident vector illustration. Illustration business decrease vectors Business risk and crisis concept
Free with trial Cost Reduction Vector Illustration featuring Decreasing Expenses, Price Minimization, and Falling Profit Rates in Business with a Flat Background. Illustration business decrease vectors Cost Reduction Vector Illustration featuring Decreasing Expenses, Price Minimization, and Falling Profit Rates in Business
Free with trial Tax Decrease line icon. linear style sign for mobile concept and web design. Downward arrow with Tax outline vector icon. Symbol, logo illustration. Vector graphics. Illustration business decrease vectors Tax Decrease line icon
Free with trial CO2 emission and pollution decrease, global greenhouse gas and exhaust reduction color icon set. Carbon dioxide offset, atmosphere, environmental contamination flat elements vector illustration. Illustration business decrease vectors CO2 pollution decrease, global greenhouse gas and exhaust reduction color icon set. CO2 emission and pollution decrease, global greenhouse gas and exhaust reduction color icon set. Carbon dioxide offset, atmosphere, environmental contamination flat elements vector illustration
Free with trial A diverse team of business professionals collaborating in a meeting. This vector illustration features five colleagues, men and women in corporate attire, gathered around a laptop and tablet, actively discussing a project. The scene, depicted in a clean, modern flat design style on a white background, is ideal for concepts like teamwork, data analysis, problem-solving, and strategic planning. The negative number shown can represent financial review, performance metrics, or tackling a business challenge, making it versatile for various corporate and financial themes. Illustration business decrease illustrations Business Team Collaboration Analyzing Negative Results Vector Illustration. A diverse team of business professionals collaborating in a meeting. This vector illustration features five colleagues, men and women in corporate attire, gathered around a laptop and tablet, actively discussing a project. The scene, depicted in a clean, modern flat design style on a white background, is ideal for concepts like teamwork, data analysis, problem-solving, and strategic planning. The negative number shown can represent financial review, performance metrics, or tackling a business challenge, making it versatile for various corporate and financial themes.
Free with trial Broker trader analyzing economic crisis. Trade exchange, financial decrease, bed business strategy, digital asset, loss investment fund, online broker, stock collapse and crisis concept. Illustration business decrease illustrations Broker trader analyzing economic crisis. Trade exchange, financial decrease
Free with trial Line Graph Trend Analysis Line And Solid Icon Set. Data Visualization, Business Growth, Statistical Analysis Symbol Collection. Financial And Market Insights. Isolated Vector Illustration. Illustration business decrease vectors Line Graph Trend Analysis Line And Solid Icon Set. Data Visualization, Business Growth, Statistical Analysis Symbol
Free with trial Cartoon sign text of funny stock bear market of financial investment is invest in value increase or decrease. Character AI illustration is gain or down loss movement by investor in business. Illustration business decrease illustrations Cartoon sign text funny stock bear market financial investment invest value decrease. Cartoon sign text of funny stock bear market of financial investment is invest in value increase or decrease. Character AI illustration is gain or down loss movement by investor in business.
Free with trial Graph growth with arrow up and reduction with arrow down, line chart icon. Financial invest, fall, increase and decrease. Statistics and analytics. Vector flat illustration. Illustration business decrease vectors Graph growth with arrow up and reduction with arrow down, line chart icon. Financial invest, fall, increase and decrease
Free with trial Graph growth with arrow up and reduction with arrow down, line chart icon. Financial invest, fall, increase and decrease. Statistics and analytics. Vector flat illustration. Illustration business decrease vectors Graph growth with arrow up and reduction with arrow down, line chart icon. Financial invest, fall, increase and decrease
Free with trial Abstract Graph Decrease Icon Set, vector editable design, can be used for business or presentation design. Illustration business decrease vectors Abstract Graph Decrease Icon Set
Free with trial 3D Isometric Flat Vector Illustration of Fertility Reduction In Europe, Decline Chart Showing Decrease in Number of People over Time. Illustration business decrease vectors 3D Isometric Flat Vector Illustration of Fertility Reduction In Europe
Free with trial Broker trader analyzing economic crisis. Trade exchange, financial decrease, bed business strategy, digital asset, loss investment fund, online broker, stock collapse and crisis concept. Illustration business decrease illustrations Broker trader analyzing economic crisis. Trade exchange, financial decrease
Free with trial Flat vector illustration of a chart depicting a negative trend, accompanied by a sad face icon, suggesting business decline or failure. Illustration business decrease vectors A chart showing a negative trend with a sad face icon, indicating a decline in business. Flat vector illustration of a chart depicting a negative trend, accompanied by a sad face icon, suggesting business decline or failure.
Free with trial Stock quotes icons set in outline stroke design for web. Pack line pictograms with increase, decrease, exchange currency, investment portfolio, bear, bull, watch list, other. Vector illustration. Illustration business decrease vectors Stock quotes icons set in outline stroke design for web. Pack line pictograms with increase, decrease, exchange currency
Free with trial Woman courier near rising and falling graph symbolizing changing trends in logistics business. Courier girl falls after onset of crisis and decrease in flow of customers from online stores. Illustration business decrease vectors Woman courier near rising and falling graph symbolizing changing trends in logistics business
Free with trial Man pictogram morphing into a downward arrow on white background, illustrating decline, decrease, falling trend or negative direction for finance, economy, data, business and social metrics. Illustration business decrease illustrations Man icon showing data decrease or downward direction. Man pictogram morphing into a downward arrow on white background, illustrating decline, decrease, falling trend or negative direction for finance, economy, data, business and social metrics
Free with trial Finance data analytics, decrease graph line icon. Business research report analysis, finance performance analytics or company statistic outline vector icon column infographics and pointing down arrow. Illustration business decrease illustrations Finance data analytics, decrease graph line icon
Free with trial A stock market crash illustration with red arrows pointing down indicating financial loss and economic downturn. a visual representation of recession and business failure on a blue grid 200. Illustration business decrease illustrations Stock market crash recession financial crisis chart falling down economic downturn graph business loss 100. a stock market crash illustration with red arrows pointing down indicating financial loss and economic downturn. a visual representation of recession and business failure on a blue grid 200
Free with trial A line art illustration isolated on white background displays business performance indicators: a speedometer, arrows, a bar graph, and a line graph, all in a minimalist style. Illustration business decrease vectors Vector art of line art illustration of business performance indicators featuring a speedometer, arrows, bar graph, and line graph. A line art illustration isolated on white background displays business performance indicators: a speedometer, arrows, a bar graph, and a line graph, all in a minimalist style
Free with trial Growth financial business on white background. Isolated 3D illustration. Illustration business decrease illustrations Growth financial business on white background. Isolated 3D illustration
Free with trial A business report illustration featuring a graph and chart, ideal for presentations and documents, conveying financial data and analysis in a clear and concise manner. Illustration business decrease vectors Illustration of business report with graph and chart, showcasing financial data and analysis for presentations and documents. A business report illustration featuring a graph and chart, ideal for presentations and documents, conveying financial data and analysis in a clear and concise manner
Free with trial Frosted glass Financial growth decrease icon isolated on white background. Increasing revenue. Minimalism concept. 3D render illustration. Illustration business decrease illustrations Frosted glass Financial growth decrease icon isolated on white background. Increasing revenue. Minimalism concept. 3D
Free with trial A line art illustration of a man presenting a whiteboard with a large downward-pointing arrow. This graphic effectively represents a decrease, decline, or negative trend in sales, finance, or other data. Useful for business reports. vector design Generative AI. Illustration business decrease vectors Businessman Presenting a Chart with a Downward Arrow. Decrease. vector design Generative AI. A line art illustration of a man presenting a whiteboard with a large downward-pointing arrow. This graphic effectively represents a decrease, decline, or negative trend in sales, finance, or other data. Useful for business reports. vector design Generative AI
Free with trial A visually appealing bar graph illustration against a sleek black background, showcasing business growth, data analysis, and statistical trends. The illustration is suitable for presentations, reports, and web content related to finance, marketing, and technology. Illustration business decrease illustrations Bar Graph Illustration Business Growth, Data Analysis, and Statistics. A visually appealing bar graph illustration against a sleek black background, showcasing business growth, data analysis, and statistical trends. The illustration is suitable for presentations, reports, and web content related to finance, marketing, and technology.
Free with trial Increase and decrease percent rate isolated vector illustration on white background. Illustration business decrease vectors Increase and decrease percent rate isolated vector illustration
Free with trial Man with business fail. Young guy near computer with graphs and diagrams. Economy and trading. Bankruptcy and financial losses. Flat vector illustration. Illustration business decrease vectors Man with business fail. Young guy near computer with graphs and diagrams. Economy and trading. Bankruptcy and financial losses
Free with trial A concise vector illustration of a red downward trending line graph, indicating an economic downturn or statistical decrease. This graphic is ideal for financial analysis, business reports, performance reviews, or economic forecasts. It clearly represents a decline in data, suitable for analytical and business-oriented designs, vector design Generative AI. Illustration business decrease vectors Red downward trend line graph, economic downturn, statistical decrease, vector design Generative AI. A concise vector illustration of a red downward trending line graph, indicating an economic downturn or statistical decrease. This graphic is ideal for financial analysis, business reports, performance reviews, or economic forecasts. It clearly represents a decline in data, suitable for analytical and business-oriented designs, vector design Generative AI
Free with trial Golden Symbol Of Gold Percentage Or Business Tax Rate With Discount Rate, Illustration On A Golden Background. Rendered Image. Illustration business decrease illustrations Golden Symbol Of Gold Percentage Or Business Tax Rate With Discount Rate, Illustration On A Golden Background. Rendered Image.
Free with trial A businessman interacting with a digital interface showing financial growth, time management, and investment strategies. It represents wealth management and business success. Time is money, invest wisely. Illustration business decrease illustrations Business investment strategy time is money financial growth and wealth management concept illustration. a businessman interacting with a digital interface showing financial growth, time management, and investment strategies. It represents wealth management and business success. Time is money, invest wisely.
Free with trial Decreasing Bar Chart With Downward Arrow Line Icon. Financial Decline, Economic Downturn, And Business Loss Outline Symbol. Market Analysis. Editable Stroke. Isolated Vector Illustration. Illustration business decrease vectors Decreasing Bar Chart With Downward Arrow Line Icon. Financial Decline, Economic Downturn, And Business Loss Outline
Free with trial Financial downturn illustration showing falling arrow with dollar coins symbolizing economic crisis, money loss, business decline, and market crash concept in modern flat style. Illustration business decrease vectors Financial downturn illustration showing falling arrow with dollar coins symbolizing economic crisis, money loss, business decline
Free with trial Depicts a green dollar bill, two gold coins, and two red downward pointing arrows. Represents decrease, low earnings, reduced budget or expense reduction. Illustration business decrease vectors Money decrease illustration with downward arrows icon on transparent background. Depicts a green dollar bill, two gold coins, and two red downward pointing arrows. Represents decrease, low earnings, reduced budget or expense reduction.
Free with trial Declining Bar Chart With Downward Arrow Line And Solid Icon Set. Financial Loss, Economic Downturn, And Business Decline Symbol Collection. Risk Assessment. Isolated Vector Illustration. Illustration business decrease vectors Declining Bar Chart With Downward Arrow Line And Solid Icon Set. Financial Loss, Economic Downturn, And Business Decline
Free with trial Business Strategy and Analysis: Lightbulb, Magnifying Glass, Briefcases, and Data Illustration. Illustration business decrease vectors Business Strategy and Analysis Lightbulb Magnifying Glass Briefcases and Data Illustration.
Free with trial Grey line Dollar rate decrease icon isolated seamless pattern on white background. Cost reduction. Money symbol with down arrow. Business lost crisis decrease. Vector. Illustration business decrease illustrations Grey line Dollar rate decrease icon isolated seamless pattern on white background. Cost reduction. Money symbol with
Free with trial Declining Bar Graph With Cursor Solid Icon. Business Performance, Financial Loss, And Market Downturn Silhouette Symbol. Economic Analysis. Isolated Vector Illustration. Illustration business decrease vectors Declining Bar Graph With Cursor Solid Icon. Business Performance, Financial Loss, And Market Downturn Silhouette Symbol
Free with trial Line Graph Chart Line And Solid Icon Set. Data Analysis, Trend Visualization, And Business Growth Symbol Collection. Statistical Representation And Performance Tracking. Isolated Vector Illustration. Illustration business decrease vectors Line Graph Chart Line And Solid Icon Set. Data Analysis, Trend Visualization, And Business Growth Symbol Collection
Free with trial Green Financial growth decrease icon isolated on purple-blue background. Increasing revenue. Minimalism concept. 3D render illustration. Illustration business decrease illustrations Green Financial growth decrease icon isolated on purple-blue background. Increasing revenue. Minimalism concept. 3D
Free with trial Illustration of a stock market crash concept. A red arrow points down across gray steps, symbolizing financial decline and economic recession. Visualizes business and investment risks. 200. Illustration business decrease illustrations Stock market crash concept illustration with red arrow pointing down on gray steps rendering. Illustration of a stock market crash concept. A red arrow points down across gray steps, symbolizing financial decline and economic recession. Visualizes business and investment risks. 200
Free with trial Abstract illustration of financial crisis, economic downturn. Falling red forex chart on grid. Concept of market crash, stock exchange rate decrease, bankrupt business falling price. Illustration business decrease illustrations Abstract illustration of financial crisis, economic downturn. Falling red forex chart on grid. Concept of market crash, stock
Free with trial A striking image of a large red arrow pointing sharply downwards against a dark backdrop Ideal for illustrating concepts of decline decrease or negative trends in business finance or economics The dramatic lighting emphasizes the arrow's downward direction. Illustration business decrease illustrations Dramatic Red Arrow Pointing Downward on Dark Background Decline Decrease Fall Concept AI generated. A striking image of a large red arrow pointing sharply downwards against a dark backdrop Ideal for illustrating concepts of decline decrease or negative trends in business finance or economics The dramatic lighting emphasizes the arrow's downward direction
Free with trial Business Team Managing Financial Crisis and Loss Prevention on Red Downward Arrow Vector Illustration. Illustration business decrease vectors Business Team Managing Financial Crisis and Loss Prevention on Red Downward Arrow Vector Illustration
Free with trial A striking image of a single red 3D arrow pointing downwards set against a dark minimalist background Perfect for illustrating concepts of decline decrease or negative trends in business and finance The clean design is ideal for presentations and websites. Illustration business decrease illustrations Red 3D Arrow Pointing Down on Dark Background Minimalist Decline Decrease Drop Concept AI generated. A striking image of a single red 3D arrow pointing downwards set against a dark minimalist background Perfect for illustrating concepts of decline decrease or negative trends in business and finance The clean design is ideal for presentations and websites
Free with trial A clean vector illustration of a bar chart graph featuring pink striped bars and a yellow highlighted section against a white background. The chart is flat design style, ideal for data visualization, business presentations, or infographics. The bars decrease in height from left to right, with the yellow section emphasizing the bottom area. Illustration business decrease illustrations Striped bar chart graph with yellow highlight and pink bars on white background vector illustration. A clean vector illustration of a bar chart graph featuring. A clean vector illustration of a bar chart graph featuring pink striped bars and a yellow highlighted section against a white background. The chart is flat design style, ideal for data visualization, business presentations, or infographics. The bars decrease in height from left to right, with the yellow section emphasizing the bottom area
Free with trial Minimalist flat design illustration shows a graph declining with a dollar symbol, depicting financial losses or a downturn, with a black background. Illustration business decrease vectors Declining Business Finances: Abstract Chart and Dollar Coin Illustration Showing Economic Downturn. Minimalist flat design illustration shows a graph declining with a dollar symbol, depicting financial losses or a downturn, with a black background.
Free with trial Abstract financial background with arrows going down. Concept decrease. Vector illustration. Abstract background with white paper arrows. Illustration business decrease vectors Abstract financial background with arrows Concept decrease. Vector illustration. Abstract financial background with arrows going down. Concept decrease. Vector illustration. Abstract background with white paper arrows.
Free with trial Business decline stage. Woman with laptop sits near falling graph. Financial recession and economic crisis. Bankruptcy and debts. Global inflation. Flat vector illustration. Illustration business decrease vectors Business decline stage. Woman with laptop sits near falling graph. Financial recession and economic crisis. Bankruptcy
Free with trial A line art illustration shows a bar graph with arrows and a star on a purple background. It represents business growth, success, and achievement of goals. Illustration business decrease vectors Vector art of line art illustration of a bar graph with arrows and a star on a purple background business growth concept. A line art illustration shows a bar graph with arrows and a star on a purple background. It represents business growth, success, and achievement of goals
Free with trial Visualizing market downturn, financial decline, and recession with a blue abstract illustration. Analyzing business trends and economic shifts. Illustration business decrease illustrations Glass Chart: Market Downturn, Financial Decline, Recession Visualization, Blue Abstract Illustration, Business Trends, Economic. Visualizing market downturn, financial decline, and recession with a blue abstract illustration. Analyzing business trends and economic shifts
Free with trial Blue calculator and gold coins near downward trending blue graph. Financial loss and budget, calculation concept. Business analytics data. Economic recession illustration. Digital accounting. Illustration business decrease illustrations Blue calculator and gold coins near downward trending blue graph. Financial loss and budget calculation concept. Business. Blue calculator and gold coins near downward trending blue graph. Financial loss and budget, calculation concept. Business analytics data. Economic recession illustration. Digital accounting
Free with trial Traffic signs to update and transfer data, exchange and repeat, rotate movement, increase and decrease business expand thin black outline symbols vector illustration. Arrow line icons set. Illustration business decrease vectors Arrow line icons set, traffic signs, update and transfer data, repeat or rotate movement. Traffic signs to update and transfer data, exchange and repeat, rotate movement, increase and decrease business expand thin black outline symbols vector illustration. Arrow line icons set.
Free with trial Statistic graph progress, financial profit growth, increase, and decrease line icons set. Infographic charts with arrows, circles, and bars thin black outline symbols vector illustration. Illustration business decrease vectors Statistic graph progress, financial profit growth, increase and decrease line icons set. Statistic graph progress, financial profit growth, increase, and decrease line icons set. Infographic charts with arrows, circles, and bars thin black outline symbols vector illustration.
Free with trial Percent down line icon. Interest rate decrease or a percentage down icon. Arrow down. Finance and money. Interest rate. Banking and credit. Investment concept. Vector illustration flat design. Illustration business decrease vectors Percent down line icon. Interest rate decrease or a percentage down icon.
Free with trial Falling graph trade war tariffs war economic decline coins leaves abstract background business crisis concept vector illustration. Illustration business decrease illustrations Falling graph trade war tariffs war economic decline coins leaves abstract background business crisis concept
Free with trial Cost Reduction Vector Illustration featuring Decreasing Expenses, Price Minimization, and Falling Profit Rates in Business with a Flat Background. Illustration business decrease vectors Cost Reduction Vector Illustration featuring Decreasing Expenses, Price Minimization, and Falling Profit Rates in Business
Free with trial Cost Reduction Vector Illustration featuring Decreasing Expenses, Price Minimization, and Falling Profit Rates in Business with a Flat Background. Illustration business decrease vectors Cost Reduction Vector Illustration featuring Decreasing Expenses, Price Minimization, and Falling Profit Rates in Business
Free with trial Cost Reduction Vector Illustration featuring Decreasing Expenses, Price Minimization, and Falling Profit Rates in Business with a Flat Background. Illustration business decrease vectors Cost Reduction Vector Illustration featuring Decreasing Expenses, Price Minimization, and Falling Profit Rates in Business
Free with trial Cost Reduction Vector Illustration featuring Decreasing Expenses, Price Minimization, and Falling Profit Rates in Business with a Flat Background. Illustration business decrease vectors Cost Reduction Vector Illustration featuring Decreasing Expenses, Price Minimization, and Falling Profit Rates in Business
Free with trial Cost Reduction Vector Illustration featuring Decreasing Expenses, Price Minimization, and Falling Profit Rates in Business with a Flat Background. Illustration business decrease vectors Cost Reduction Vector Illustration featuring Decreasing Expenses, Price Minimization, and Falling Profit Rates in Business
Free with trial Cost Reduction Vector Illustration featuring Decreasing Expenses, Price Minimization, and Falling Profit Rates in Business with a Flat Background. Illustration business decrease vectors Cost Reduction Vector Illustration featuring Decreasing Expenses, Price Minimization, and Falling Profit Rates in Business
Free with trial Cost Reduction Vector Illustration featuring Decreasing Expenses, Price Minimization, and Falling Profit Rates in Business with a Flat Background. Illustration business decrease vectors Cost Reduction Vector Illustration featuring Decreasing Expenses, Price Minimization, and Falling Profit Rates in Business
Free with trial White Dollar rate decrease icon isolated with long shadow background. Cost reduction. Money symbol with down arrow. Business lost crisis decrease. Pink hexagon button. Vector. Illustration business decrease illustrations White Dollar rate decrease icon isolated with long shadow background. Cost reduction. Money symbol with down arrow
Free with trial Business and finance web icons set in duotone flat design. Pack pictograms with money, graph, businessman, piggy bank, justice, coins, handshake, exchange, cash, diamond, other. Vector illustration. Illustration business decrease vectors Business and finance web icons set in duotone flat design. Pack pictograms with money, graph, businessman, piggy bank, justice
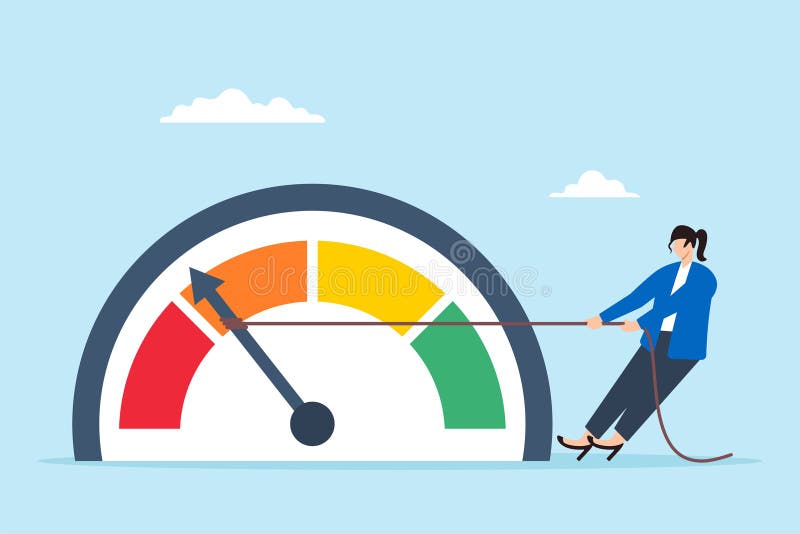
Free with trial Flat illustration of businesswoman pull meter down reducing risk level red alert to green reduce stress decrease anxiety or danger indicator. Illustration business decrease illustrations Flat illustration of businesswoman pull meter down reducing risk level red alert to green reduce stress decrease anxiety or danger
Free with trial Illustration of an entrepreneur who is burdened by excessive business costs flat design vector illustration, financial problems in business, the company operational costs are increasing, cost overruns. Illustration business decrease illustrations Illustration of an entrepreneur who is burdened by excessive business costs flat design vector illustration, financial problems in
Free with trial Blue Financial growth decrease icon isolated on white background. Increasing revenue. Minimalism concept. 3D render illustration. Illustration business decrease illustrations Blue Financial growth decrease icon isolated on white background. Increasing revenue. Minimalism concept. 3D render
Free with trial Fail of startup concept. Employee get failure in development, loss motivation. Problems of business project, crisis collapse. Rocket falls down, crashing. Flat isolated vector illustration on white. Illustration business decrease vectors Fail of startup concept. Employee get failure in development, loss motivation. Problems of business project, crisis
Free with trial Professional monitoring business expenses. Woman at desk, assessing financial charts with declining trends and dollar signs. Cost management and reduction focus. Flat vector illustration. Illustration business decrease vectors Professional monitoring business expenses. Woman
Free with trial Glowing neon Dollar rate decrease icon isolated on brick wall background. Cost reduction. Money symbol with down arrow. Business lost crisis decrease. Neon light alphabet. Vector. Illustration business decrease illustrations Glowing neon Dollar rate decrease icon isolated on brick wall background. Cost reduction. Money symbol with down arrow
Free with trial Professional monitoring business expenses. Woman at desk, assessing financial charts with declining trends and dollar signs. Cost management and reduction focus. Flat vector illustration. Illustration business decrease vectors Professional monitoring business expenses. Woman at desk, assessing
Free with trial Colorful Financial growth decrease icon isolated on white background. Increasing revenue. Minimalism concept. 3D render illustration. Illustration business decrease illustrations Colorful Financial growth decrease icon isolated on white background. Increasing revenue. Minimalism concept. 3D render
Free with trial Colorful Financial growth decrease icon isolated on white background. Increasing revenue. Circle button. 3D render illustration. Illustration business decrease illustrations Colorful Financial growth decrease icon isolated on white background. Increasing revenue. Circle button. 3D render
Free with trial Colorful Financial growth decrease icon isolated on white background. Increasing revenue. Circle button. 3D render illustration. Illustration business decrease illustrations Colorful Financial growth decrease icon isolated on white background. Increasing revenue. Circle button. 3D render
Free with trial The image shows a neon-style graph illustrating a business downturn. the graph features an orange line depicting a downward trend, punctuated by blue vertical lines that may represent key milestones or events. the background is dark, emphasizing the neon glow of the graph elements. the graph suggests a decline in business performance, with the orange line representing a decrease in value or profit over time. Illustration business decrease illustrations Business downturn neon chart illustration. the image shows a neon-style graph illustrating a business downturn. the graph features an orange line depicting a downward trend, punctuated by blue vertical lines that may represent key milestones or events. the background is dark, emphasizing the neon glow of the graph elements. the graph suggests a decline in business performance, with the orange line representing a decrease in value or profit over time.
Free with trial Colorful Financial growth decrease icon isolated on white background. Increasing revenue. Minimalism concept. 3D render illustration. Illustration business decrease illustrations Colorful Financial growth decrease icon isolated on white background. Increasing revenue. Minimalism concept. 3D render
Free with trial Colorful Financial growth decrease icon isolated on white background. Increasing revenue. Minimalism concept. 3D render illustration. Illustration business decrease illustrations Colorful Financial growth decrease icon isolated on white background. Increasing revenue. Minimalism concept. 3D render
Free with trial Vector icon illustration of price increase decrease (price fluctuation. Illustration business decrease vectors Vector icon illustration of price increase decrease (price fluctuation
Free with trial A simple and modern black silhouette icon of a business graph, isolated on a white background. This flat vector illustration combines a bar chart with an overlaid line graph, showing a fluctuating trend with a general decline. The graphic symbolizes concepts such as data analysis, financial reporting, market statistics, economic downturn, and business performance metrics. It's an ideal visual element for presentations, infographics, websites, and applications related to finance, economics, and analytics, representing concepts of decrease, loss, or market volatility. Illustration business decrease vectors Business Data Analytics Chart Icon. A simple and modern black silhouette icon of a business graph, isolated on a white background. This flat vector illustration combines a bar chart with an overlaid line graph, showing a fluctuating trend with a general decline. The graphic symbolizes concepts such as data analysis, financial reporting, market statistics, economic downturn, and business performance metrics. It's an ideal visual element for presentations, infographics, websites, and applications related to finance, economics, and analytics, representing concepts of decrease, loss, or market volatility.