Free with trial Set line Location Graph chart diagram Financial growth decrease Pie infographic Flag Shopping bag with Sale Arrow and Project team base icon. Vector. Increase decrease graph vectors Set line Location, Graph, chart, diagram, Financial growth decrease, Pie infographic, Flag, Shopping bag with Sale. Set line Location Graph chart diagram Financial growth decrease Pie infographic Flag Shopping bag with Sale Arrow and Project team base icon. Vector.
Free with trial Set line Pie chart infographic Dollar symbol Financial growth increase Arrow Pyramid infographics Clock and decrease icon. Vector. Increase decrease graph vectors Set line Pie chart infographic, Dollar symbol, Financial growth increase, Arrow, Pyramid infographics, Clock and. Set line Pie chart infographic Dollar symbol Financial growth increase Arrow Pyramid infographics Clock and decrease icon. Vector.
Free with trial Set Financial growth increase Pie chart infographic Laptop with dollar Diamond Bank building Shopping cart and decrease and Money bag icon. Vector. Increase decrease graph vectors Set Financial growth increase, Pie chart infographic, Laptop with dollar, Diamond, Bank building, Shopping cart and. Set Financial growth increase Pie chart infographic Laptop with dollar Diamond Bank building Shopping cart and decrease and Money bag icon. Vector.
Free with trial Set line Arrow Flag Clock Financial growth decrease Pyramid chart infographics Graph chart diagram and Intersection point icon. Vector. Increase decrease graph illustrations Set line Arrow, Flag, Clock, Financial growth decrease, Pyramid chart infographics, Graph, chart, diagram and. Set line Arrow Flag Clock Financial growth decrease Pyramid chart infographics Graph chart diagram and Intersection point icon. Vector.
Free with trial Set line Arrow Flag Clock Financial growth decrease Pyramid chart infographics Graph chart diagram and Intersection point icon. Vector. Increase decrease graph vectors Set line Arrow, Flag, Clock, Financial growth decrease, Pyramid chart infographics, Graph, chart, diagram and. Set line Arrow Flag Clock Financial growth decrease Pyramid chart infographics Graph chart diagram and Intersection point icon. Vector.
Free with trial Set Financial growth decrease Hierarchy organogram chart Old hourglass with sand Delivery tracking Graph diagram Pyramid infographics Target and Many ways directional arrow icon. Vector. Increase decrease graph vectors Set Financial growth decrease, Hierarchy organogram chart, Old hourglass with sand, Delivery tracking, Graph, diagram. Set Financial growth decrease Hierarchy organogram chart Old hourglass with sand Delivery tracking Graph diagram Pyramid infographics Target and Many ways directional arrow icon. Vector.
Free with trial Set line Graph chart diagram Financial growth decrease Location Hierarchy organogram Intersection point Flag Pie infographic and Arrow icon. Vector. Increase decrease graph vectors Set line Graph, chart, diagram, Financial growth decrease, Location, Hierarchy organogram, Intersection point, Flag, Pie. Set line Graph chart diagram Financial growth decrease Location Hierarchy organogram Intersection point Flag Pie infographic and Arrow icon. Vector.
Free with trial Stock lines increase and decrease: stock crash concept, two circles as copy space - background blue. Increase decrease graph illustrations Stock lines increase and decrease: stock crash concept, two circles as copy space - background
Free with trial Increase and decrease Bitcoin value. Business concept. Isometric vector illustration. Increase decrease graph vectors Increase and decrease Bitcoin value. Business concept. Isometric vector illustration
Free with trial Digital illustration of increase graph and globe in white background. Increase decrease graph illustrations Increase graph and globe
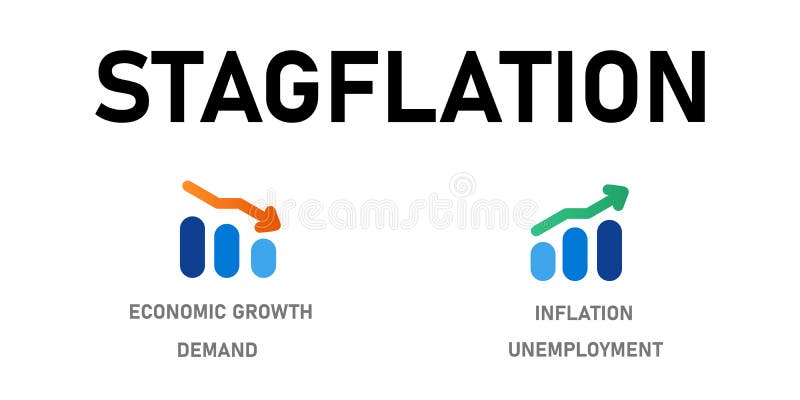
Free with trial Stagflation economic condition with high inflation increase price unemployment but low decrease economic growth and demand chart vector. Increase decrease graph vectors Stagflation economic condition with high inflation increase price unemployment but low decrease economic growth and
Free with trial Digital illustration of increase graph in white background. Increase decrease graph illustrations Increase graph
Free with trial Decline, growth, success, recession business flat concept illustration. Graphs depict increase and decrease business. Vector template element for infographic, web, presentation, social networks. Increase decrease graph vectors Recession, decline, growth, increase, success business arrows. F. Decline, growth, success, recession business flat concept illustration. Graphs depict increase and decrease business. Vector template element for infographic, web, presentation, social networks.
Free with trial Landing page template of financial down. Modern flat design concept of web page design for website and mobile website. Easy to edit and customize, vector, poster, illustration, advertisement, banner, agency, background, business, management, online, resource, social, media, people, character, market, stock, finance, money, graph, investment, chart, economy, crisis, profit, banking, loss, data, currency, growth, success, decrease, economic, trade, report, income, increase, recession, arrow, global, dollar, person, drop. Increase decrease graph vectors Landing page template of financial down. Modern flat design concept of web page design for website and mobile website. Easy to
Free with trial A mirrored rising then falling graph on a dark background that is perfect for representing a increase then a decrease. Increase decrease graph illustrations A white rising and falling graph. A mirrored rising then falling graph on a dark background that is perfect for representing a increase then a decrease.
Free with trial Overcoming unforeseen situations and achieving financial goals, finding a way out of economic instability, creative financial instruments to increase income, man draws a path through graph to wealth. Increase decrease graph vectors Man draws a path through graph to wealth
Free with trial Business analysis icon. symbol with magnifying glass. dollar increase revenue. Money with arrow. finance cost. decrease rate economy stretching. lost crisis. reduction bankrupt. vector illustration. Increase decrease graph vectors Business analysis icon. symbol with magnifying glass. dollar increase revenue. Money with arrow. finance cost. decrease rate econo
Free with trial A minimal style of a red down graph of the financial crisis, economic downturn, inflation, recession, failure, bankruptcy, and crisis concept. A businesswoman pushes decrease business chart diagram. Increase decrease graph vectors A minimal style of a red down graph of the financial crisis
Free with trial Motion graph coloured waves grow and decrease in shape intensively changing colour from pink through green to brown on grey square in dark background. 3d animation. Business and finance concept. Increase decrease graph illustrations Motion graph coloured waves grow in shape changing colour. Motion graph coloured waves grow and decrease in shape intensively changing colour from pink through green to brown on grey square in dark background. 3d animation. Business and finance concept.
Free with trial A line graph showing an overall upward trend while increasing or decreasing. The transition of twists and turns. Abstract concept representing increase and rise. cool blue background. 3D rendering. Increase decrease graph illustrations A line graph showing an overall upward trend while increasing or decreasing. The transition of twists and turns.
Free with trial A mirrored rising then falling graph on a dark background with the camera slightly raised looking down on the subject that is perfect for representing a increase then a decrease. Increase decrease graph illustrations A white rising and falling graph low angle. A mirrored rising then falling graph on a dark background with the camera slightly raised looking down on the subject that is perfect for representing a increase then a decrease.
Free with trial Impact of inflation on decline in income vector illustration. Cartoon tiny people look at percentage arrow increase and inflation growth, decrease in profit chart, unemployment and money loss. Increase decrease graph vectors Impact of inflation on decline in income, tiny people look at percentage arrow increase. Impact of inflation on decline in income vector illustration. Cartoon tiny people look at percentage arrow increase and inflation growth, decrease in profit chart, unemployment and money loss
Free with trial Set of Chart presentation, Report, Increase growth graph icons. Graph line icons. Analytics testing, Falling demand, Pie chart report. Calendar statistics, Stats. Ab testing, Increase sales. Vector. Increase decrease graph vectors Graph line icons. Set of Chart presentation, Report and Increase growth graph icons. Vector. Set of Chart presentation, Report, Increase growth graph icons. Set of Chart presentation, Report, Increase growth graph icons. Graph line icons. Analytics testing, Falling demand, Pie chart report. Calendar statistics, Stats. Ab testing, Increase sales. Vector
Free with trial Business analysis icon. symbol with magnifying glass. dollar increase revenue. Money with arrow. finance cost. decrease rate economy stretching. lost crisis. reduction bankrupt. vector illustration. Increase decrease graph vectors Business analysis icon. symbol with magnifying glass. dollar increase revenue. Money with arrow. finance cost. decrease rate econo
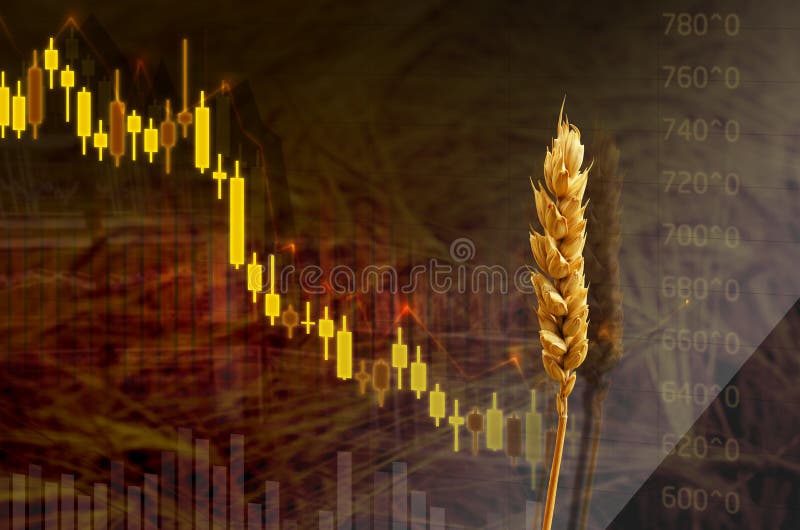
Free with trial Price level decrease of agricultural grains shown by chart, graph and close up photo of wheat, on wheat field brown background. Increase decrease graph illustrations Diagram of fall food prices. Decrease in the price of wheat seedson the graph with dollar sign. Put down price of seeds. Price level decrease of agricultural grains shown by chart, graph and close up photo of wheat, on wheat field brown background.
Free with trial Business analysis icon. symbol with magnifying glass. dollar increase revenue. Money with arrow. finance cost. decrease rate economy stretching. lost crisis. reduction bankrupt. vector illustration. Increase decrease graph vectors Business analysis icon. symbol with magnifying glass. dollar increase revenue. Money with arrow. finance cost. decrease rate econo
Free with trial World money, Graph chart and Loan percent line icons set. Timeline process infograph. Shopping bag sign. Global markets, Get report, Decrease rate. Supermarket discounts. Finance set. Vector. Increase decrease graph vectors World money, Graph chart and Loan percent icons set. Shopping bag sign. Vector. World money, Graph chart and Loan percent line icons set. Timeline process infograph. Shopping bag sign. Global markets, Get report, Decrease rate. Supermarket discounts. Finance set. Vector
Free with trial Downward, down and decrease market graph icon design vector. Increase decrease graph vectors Downward, down and decrease market graph icon design
Free with trial Downward, down and decrease market graph icon design vector. Increase decrease graph vectors Downward, down and decrease market graph icon design
Free with trial Colorful cylinders. Bar graph, column chart elements for finance statistical infographic. Growth or decrease signs. Vector 3d illustration. Increase decrease graph vectors Colorful cylinders. Bar graph, column chart elements for finance statistical infographic. Growth or decrease signs
Free with trial Colorful and white cylinders. Bar graph, column chart elements for finance statistical infographic. Growth and decrease signs. Vector 3d illustration. Increase decrease graph vectors Colorful and white cylinders. Bar graph, column chart elements for finance statistical infographic. Growth and decrease
Free with trial Down market, decrease graph icon design vector. Increase decrease graph vectors Down market, decrease graph icon design
Free with trial Downward, down and decrease market graph icon design vector. Increase decrease graph vectors Downward, down and decrease market graph icon design
Free with trial Down market, decrease graph icon design vector. Increase decrease graph vectors Down market, decrease graph icon design
Free with trial Set Pie chart infographic Factory Financial growth Clock Graph chart diagram Many ways directional arrow decrease and Percent up icon. Vector. Increase decrease graph vectors Set Pie chart infographic, Factory, Financial growth, Clock, Graph, chart, diagram, Many ways directional arrow. Set Pie chart infographic Factory Financial growth Clock Graph chart diagram Many ways directional arrow decrease and Percent up icon. Vector.
Free with trial Set Arrow, Graph, chart, diagram, Percent up arrow, Location, Financial growth decrease, and icon. Vector. Increase decrease graph illustrations Set Arrow, Graph, chart, diagram, Percent up arrow, Location, Financial growth decrease, and icon. Vector
Free with trial Set line Digital speed meter Intersection point Pie chart infographic Arrow Graph chart diagram Percent up arrow and Financial growth decrease icon. Vector. Increase decrease graph vectors Set line Digital speed meter, Intersection point, Pie chart infographic, Arrow, Graph, chart, diagram, Percent up arrow. Set line Digital speed meter Intersection point Pie chart infographic Arrow Graph chart diagram Percent up arrow and Financial growth decrease icon. Vector.
Free with trial Set Server, Search engine, Graph chart infographic and Financial growth decrease icon. Vector. Increase decrease graph vectors Set Server, Search engine, Graph chart infographic and Financial growth decrease icon. Vector
Free with trial Vector badge red arrow on computer monitor. Infographics concept for presentation or financial report. Increase and decrease of indicators in graphic diagram. Increase decrease graph vectors Vector badge red arrow on computer monitor. Infographics concept for presentation or financial report. Increase and
Free with trial Vector illustration of pasting company business dynamics graph search symbol icon increase and decrease. black and white color, line drawing style. color can be edited. 2500 x 2500 pixel perfect. Increase decrease graph vectors Vector illustration of pasting company business dynamics graph search symbol icon increase and decrease.
Free with trial Set line Financial growth decrease, Wrench and gear, Graph, chart, diagram and. Color circle button. Vector. Increase decrease graph vectors Set line Financial growth decrease, Wrench and gear, Graph, chart, diagram and . Color circle button. Vector
Free with trial Set of business down chart. Declining graph with a magnifying glass with a dollar. Arrow pointing down on graph. Financial crisis graph. Dollar rate decrease. Illustration vector. Increase decrease graph vectors Set of business down chart. Declining graph with a magnifying glass with a dollar. Arrow pointing down on graph. Financial crisis
Free with trial Set line Intersection point Arrow Pie chart infographic Unknown search Many ways directional arrow Graph chart diagram Financial growth decrease and icon. Vector. Increase decrease graph vectors Set line Intersection point, Arrow, Pie chart infographic, Unknown search, Many ways directional arrow, Graph, chart. Set line Intersection point Arrow Pie chart infographic Unknown search Many ways directional arrow Graph chart diagram Financial growth decrease and icon. Vector.
Free with trial Set line Graph chart diagram Location Unknown search Percent up arrow Arrow Financial growth decrease and Digital speed meter icon. Vector. Increase decrease graph illustrations Set line Graph, chart, diagram, Location, Unknown search, Percent up arrow, Arrow, Financial growth decrease, and. Set line Graph chart diagram Location Unknown search Percent up arrow Arrow Financial growth decrease and Digital speed meter icon. Vector.
Free with trial Set Mobile phone Infographic of city map Financial growth decrease Graph chart infographic Cloud technology data transfer Create account screen Online shopping and Browser window icon. Vector. Increase decrease graph vectors Set Mobile phone, Infographic of city map, Financial growth decrease, Graph chart infographic, Cloud technology data. Set Mobile phone Infographic of city map Financial growth decrease Graph chart infographic Cloud technology data transfer Create account screen Online shopping and Browser window icon. Vector.
Free with trial Set line Factory Clock Arrow Graph chart diagram Pyramid infographics Many ways directional arrow Financial growth decrease and Pie icon. Vector. Increase decrease graph vectors Set line Factory, Clock, Arrow, Graph, chart, diagram, Pyramid infographics, Many ways directional arrow, Financial. Set line Factory Clock Arrow Graph chart diagram Pyramid infographics Many ways directional arrow Financial growth decrease and Pie icon. Vector.
Free with trial Set line Browser window, Financial growth decrease, Graph chart infographic and. Glowing neon icon. Vector. Increase decrease graph vectors Set line Browser window, Financial growth decrease, Graph chart infographic and . Glowing neon icon. Vector
Free with trial Set Graph, chart, diagram, Financial growth decrease, Percent up arrow and Digital speed meter icon. Vector. Increase decrease graph vectors Set Graph, chart, diagram, Financial growth decrease, Percent up arrow and Digital speed meter icon. Vector
Free with trial Set Arrow Graph chart diagram Financial growth decrease Percent up arrow Wrench and gear Old hourglass with sand and icon. Vector. Increase decrease graph vectors Set Arrow, Graph, chart, diagram, Financial growth decrease, Percent up arrow, Wrench and gear, Old hourglass with sand. Set Arrow Graph chart diagram Financial growth decrease Percent up arrow Wrench and gear Old hourglass with sand and icon. Vector.
Free with trial Set ATM Treasure chest Broken piggy bank Financial growth increase Stacks paper money cash Money payment transfer decrease and Piggy and hammer icon. Vector. Increase decrease graph vectors Set ATM, Treasure chest, Broken piggy bank, Financial growth increase, Stacks paper money cash, Money payment transfer. Set ATM Treasure chest Broken piggy bank Financial growth increase Stacks paper money cash Money payment transfer decrease and Piggy and hammer icon. Vector.
Free with trial Set line Financial growth decrease Graph chart infographic and Magnifying glass with check mark icon. Vector. Increase decrease graph vectors Set line Financial growth decrease, Graph chart infographic and Magnifying glass with check mark icon. Vector
Free with trial Set line Arrow Target Graph chart diagram Financial growth increase Delivery tracking Many ways directional arrow and decrease icon. Vector. Increase decrease graph illustrations Set line Arrow, Target, Graph, chart, diagram, Financial growth increase, Delivery tracking, Many ways directional arrow. Set line Arrow Target Graph chart diagram Financial growth increase Delivery tracking Many ways directional arrow and decrease icon. Vector.
Free with trial Set line Document with graph chart Cloud and shield Processor CPU Data analysis Financial growth Binary code and decrease icon. Vector. Increase decrease graph vectors Set line Document with graph chart, Cloud and shield, Processor CPU, Data analysis, Financial growth, Binary code and. Set line Document with graph chart Cloud and shield Processor CPU Data analysis Financial growth Binary code and decrease icon. Vector.
Free with trial Set Graph chart infographic Search engine Financial growth decrease Browser files Magnifying glass and delete and Online shopping on screen icon. Vector. Increase decrease graph vectors Set Graph chart infographic, Search engine, Financial growth decrease, Browser files, Magnifying glass and delete and. Set Graph chart infographic Search engine Financial growth decrease Browser files Magnifying glass and delete and Online shopping on screen icon. Vector.
Free with trial Set Graph chart diagram Light bulb Pie infographic Old hourglass with sand Intersection point Arrow Financial growth decrease and icon. Vector. Increase decrease graph vectors Set Graph, chart, diagram, Light bulb, Pie infographic, Old hourglass with sand, Intersection point, Arrow, Financial. Set Graph chart diagram Light bulb Pie infographic Old hourglass with sand Intersection point Arrow Financial growth decrease and icon. Vector.
Free with trial Set line Financial growth decrease Graph chart diagram Hierarchy organogram Arrow Location Target and Digital speed meter icon. Vector. Increase decrease graph illustrations Set line Financial growth decrease, Graph, chart, diagram, Hierarchy organogram, Arrow, Location, Target and Digital. Set line Financial growth decrease Graph chart diagram Hierarchy organogram Arrow Location Target and Digital speed meter icon. Vector.
Free with trial Set line Project team base, Financial growth decrease, Graph, chart, diagram and Wrench and gear. Gradient color icons. Vector. Increase decrease graph vectors Set line Project team base, Financial growth decrease, Graph, chart, diagram and Wrench and gear. Gradient color icons
Free with trial Set line Digital speed meter Financial growth decrease Graph chart infographic Browser window Photo retouching Cloud technology data transfer and Secure your site with HTTPS SSL icon. Vector. Increase decrease graph vectors Set line Digital speed meter, Financial growth decrease, Graph chart infographic, Browser window, Photo retouching. Set line Digital speed meter Financial growth decrease Graph chart infographic Browser window Photo retouching Cloud technology data transfer and Secure your site with HTTPS SSL icon. Vector.
Free with trial Set Financial growth decrease Graph chart infographic Browser window Digital speed meter Create account screen Search engine and Online shopping on icon. Vector. Increase decrease graph vectors Set Financial growth decrease, Graph chart infographic, Browser window, Digital speed meter, Create account screen. Set Financial growth decrease Graph chart infographic Browser window Digital speed meter Create account screen Search engine and Online shopping on icon. Vector.
Free with trial Set Server Data Browser window Cloud technology data transfer Magnifying glass and delete Financial growth decrease Graph chart infographic increase and icon. Vector. Increase decrease graph vectors Set Server, Data, Browser window, Cloud technology data transfer, Magnifying glass and delete, Financial growth decrease. Set Server Data Browser window Cloud technology data transfer Magnifying glass and delete Financial growth decrease Graph chart infographic increase and icon. Vector.
Free with trial Set line Search engine Online shopping on screen Financial growth decrease Graph chart infographic Server Data Cloud download and Browser setting icon. Vector. Increase decrease graph vectors Set line Search engine, Online shopping on screen, Financial growth decrease, Graph chart infographic, Server, Data. Set line Search engine Online shopping on screen Financial growth decrease Graph chart infographic Server Data Cloud download and Browser setting icon. Vector.
Free with trial Set Financial growth decrease Browser window Online shopping on screen UI or UX design Graph chart infographic Cloud technology data transfer setting and icon. Vector. Increase decrease graph vectors Set Financial growth decrease, Browser window, Online shopping on screen, UI or UX design, Graph chart infographic. Set Financial growth decrease Browser window Online shopping on screen UI or UX design Graph chart infographic Cloud technology data transfer setting and icon. Vector.
Free with trial Set Light bulb, Arrow, Location, Financial growth decrease, Intersection point and Graph, chart, diagram icon. Vector. Increase decrease graph vectors Set Light bulb, Arrow, Location, Financial growth decrease, Intersection point and Graph, chart, diagram icon. Vector
Free with trial Set line Graph chart infographic, Magnifying glass and delete, Financial growth decrease and Search engine icon. Vector. Increase decrease graph illustrations Set line Graph chart infographic, Magnifying glass and delete, Financial growth decrease and Search engine icon. Vector
Free with trial Set line New chat messages notification Browser window Graph chart infographic Financial growth decrease Search engine Cloud upload and Infographic of city map icon. Vector. Increase decrease graph illustrations Set line New chat messages notification, Browser window, Graph chart infographic, Financial growth decrease, Search. Set line New chat messages notification Browser window Graph chart infographic Financial growth decrease Search engine Cloud upload and Infographic of city map icon. Vector.
Free with trial Set line Many ways directional arrow Graph chart diagram Project team base Infographic element Financial growth decrease Pie infographic and Digital speed meter icon. Vector. Increase decrease graph vectors Set line Many ways directional arrow, Graph, chart, diagram, Project team base, Infographic element, Financial growth. Set line Many ways directional arrow Graph chart diagram Project team base Infographic element Financial growth decrease Pie infographic and Digital speed meter icon. Vector.
Free with trial Set Cloud technology data transfer Browser setting Financial growth decrease window Graph chart infographic files and icon. Vector. Increase decrease graph vectors Set Cloud technology data transfer, Browser setting, Financial growth decrease, window, Graph chart infographic, files. Set Cloud technology data transfer Browser setting Financial growth decrease window Graph chart infographic files and icon. Vector.
Free with trial Set line Search engine, Online shopping on screen, Graph chart infographic and Financial growth decrease icon. Vector. Increase decrease graph illustrations Set line Search engine, Online shopping on screen, Graph chart infographic and Financial growth decrease icon. Vector
Free with trial Set Search engine Online play video Graph chart infographic Browser window setting Financial growth decrease Cloud download and Web developer programming code icon. Vector. Increase decrease graph vectors Set Search engine, Online play video, Graph chart infographic, Browser window, setting, Financial growth decrease, Cloud. Set Search engine Online play video Graph chart infographic Browser window setting Financial growth decrease Cloud download and Web developer programming code icon. Vector.
Free with trial Set line Financial growth decrease New chat messages notification Browser setting and Graph chart infographic icon. Vector. Increase decrease graph vectors Set line Financial growth decrease, New chat messages notification, Browser setting and Graph chart infographic icon
Free with trial Set Graph, chart, diagram, Digital speed meter, Financial growth decrease and Many ways directional arrow. Square glass panels. Vector. Increase decrease graph illustrations Set Graph, chart, diagram, Digital speed meter, Financial growth decrease and Many ways directional arrow. Square glass
Free with trial Set line Search engine Graph chart infographic Financial growth decrease and Photo retouching. Business infographic template. Vector. Increase decrease graph vectors Set line Search engine, Graph chart infographic, Financial growth decrease and Photo retouching. Business infographic. Set line Search engine Graph chart infographic Financial growth decrease and Photo retouching. Business infographic template. Vector.
Free with trial Set line Search engine Graph chart infographic Financial growth decrease and Photo retouching. Business infographic template. Vector. Increase decrease graph illustrations Set line Search engine, Graph chart infographic, Financial growth decrease and Photo retouching. Business infographic. Set line Search engine Graph chart infographic Financial growth decrease and Photo retouching. Business infographic template. Vector.
Free with trial Set line Cloud upload Website and mail Financial growth decrease Browser window Graph chart infographic Online play video technology data transfer and developer programming code icon. Vector. Increase decrease graph vectors Set line Cloud upload, Website and mail, Financial growth decrease, Browser window, Graph chart infographic, Online play. Set line Cloud upload Website and mail Financial growth decrease Browser window Graph chart infographic Online play video technology data transfer and developer programming code icon. Vector.
Free with trial Set Pyramid chart infographics Dollar symbol Arrow Wrench and gear Financial growth increase Shopping bag with Sale Target and decrease icon. Vector. Increase decrease graph vectors Set Pyramid chart infographics, Dollar symbol, Arrow, Wrench and gear, Financial growth increase, Shopping bag with Sale. Set Pyramid chart infographics Dollar symbol Arrow Wrench and gear Financial growth increase Shopping bag with Sale Target and decrease icon. Vector.
Free with trial Set line Financial growth decrease, Graph, chart, diagram, Arrow and icon. Vector. Increase decrease graph illustrations Set line Financial growth decrease, Graph, chart, diagram, Arrow and icon. Vector
Free with trial Coin money golden arrow down bitcoin btc symbol business economy graph chart stock recession stack inflation fail currency crisis depression dollar cash bankrupt decrease. Increase decrease graph illustrations Coin money golden arrow down bitcoin btc symbol business economy graph chart stock recession stack inflation fail currency crisis
Free with trial Set line Many ways directional arrow Delivery tracking Pie chart infographic Graph chart diagram Financial growth decrease Arrow Digital speed meter and Light bulb icon. Vector. Increase decrease graph illustrations Set line Many ways directional arrow, Delivery tracking, Pie chart infographic, Graph, chart, diagram, Financial growth. Set line Many ways directional arrow Delivery tracking Pie chart infographic Graph chart diagram Financial growth decrease Arrow Digital speed meter and Light bulb icon. Vector.