Free with trial Description: A vibrant 3D rendering showcasing a bar chart with orange, blue, and yellow bars, representing upward financial trends or business growth. Ideal for presentations and reports. Increase decrease graph illustrations Colorful 3D Bar Chart: Business Growth and Financial Success. Description: A vibrant 3D rendering showcasing a bar chart with orange, blue, and yellow bars, representing upward financial trends or business growth. Ideal for presentations and reports.
Free with trial Red glossy arrow pointing upwards isolated on white background. Direction guide. Close-up. Increase decrease graph illustrations Red glossy arrow pointing upwards isolated on white background. Direction guide
Free with trial White sugar cubes pile up on dark surface. Blurry financial stock market chart with red green candlestick lines appears in background. Image commodity prices market trends, global. Increase decrease graph illustrations White sugar cubes pile up on dark surface. Blurry financial stock market chart with red green candlestick lines appears in
Free with trial Hand interacting with blue chart, analyzing growth, trends, and financial performance data ,Generative ai. Increase decrease graph illustrations Hand analyzing blue chart, deciphering growth trends and financial performance for business success. Hand interacting with blue chart, analyzing growth, trends, and financial performance data ,Generative ai
Free with trial Close-Up Hand Holds Small Green Plant With Abstract Blurred Financial Candlestick Charts Background, Generated by AI. Increase decrease graph illustrations Close-Up Hand Holds Small Green Plant With Abstract Blurred Financial Candlestick Charts Background
Free with trial Stock market chart analysis displayed on computer screen showing growth and performance ,Generative ai. Increase decrease graph illustrations Stock market analysis chart displayed on computer screen showing growth and investment performance. Stock market chart analysis displayed on computer screen showing growth and performance ,Generative ai
Free with trial Chart icons for data analysis vector art design, Minimalist business charts icons bar graphs, line graphs, and pie charts vector illustration on white background the image is generated using AI. Increase decrease graph vectors Chart icons for data analysis vector art design, Minimalist business charts icons bar graphs, line graphs, and pie charts vector
Free with trial Business Analytics And Data Visualization Line Icon Set. Financial Growth, Market Trends, And Performance Analysis Outline Symbol Collection. Editable Stroke. Isolated Vector Illustration. Increase decrease graph vectors Business Analytics And Data Visualization Line Icon Set. Financial Growth, Market Trends, And Performance Analysis
Free with trial Person holds smartphone displaying stock market charts. Person reviews financial data. Stock market trading in progress, on computer monitor. Person analyses market trends. Person. Increase decrease graph illustrations Person holds smartphone displaying stock market charts. Person reviews financial data. Stock market trading in progress on. Person holds smartphone displaying stock market charts. Person reviews financial data. Stock market trading in progress, on computer monitor. Person analyses market trends. Person.
Free with trial Stock market chart displaying a transition from a downturn to a bullish trend. Red candlesticks indicate a declining phase, followed by green candlesticks showing upward movement. The grid and digital interface feature blue and orange function buttons surrounding the chart. The setup appears designed for financial analysis, illustrating market behavior for reports or presentations. Increase decrease graph illustrations Dynamic stock market chart showing bullish trend after downturn for financial analysis reports and presentations. Stock market chart displaying a transition from a downturn to a bullish trend. Red candlesticks indicate a declining phase, followed by green candlesticks showing upward movement. The grid and digital interface feature blue and orange function buttons surrounding the chart. The setup appears designed for financial analysis, illustrating market behavior for reports or presentations.
Free with trial Business person analyzes financial charts, market trends and investment strategies for economic growth ,Generative ai. Increase decrease graph illustrations Business person analyzes financial charts, market trends and investment strategies for economic growth
Free with trial Two sets of three dimensional bar charts. One set shows ascending bars in light colors, shows bars in yellow, beige with decreasing trend. Visual representation aids in data analysis. Increase decrease graph illustrations Two sets of three dimensional bar charts. One set shows ascending bars in light colors, shows bars in yellow, beige with
Free with trial Global inflation trends displayed on multiple digital screens. Macroeconomic research paper on screens shows worldwide inflation data. Charts graphs illustrate global economic. Increase decrease graph illustrations Global inflation trends displayed on multiple digital screens. Macroeconomic research paper on screens shows worldwide inflation
Free with trial Person analyses stock market trends on mobile phone. Investor views financial data on smartphone display. Stock charts display, market fluctuations. Businessman tracks investment. Increase decrease graph illustrations Person analyses stock market trends on mobile phone. Investor views financial data on smartphone display. Stock charts display
Free with trial Bar Chart Growth And Decline Line And Solid Icon Set. Financial Performance, Economic Trends, Business Analysis Symbol Collection. Data Visualization And Market Trends. Isolated Vector Illustration. Increase decrease graph vectors Bar Chart Growth And Decline Line And Solid Icon Set. Financial Performance, Economic Trends, Business Analysis Symbol
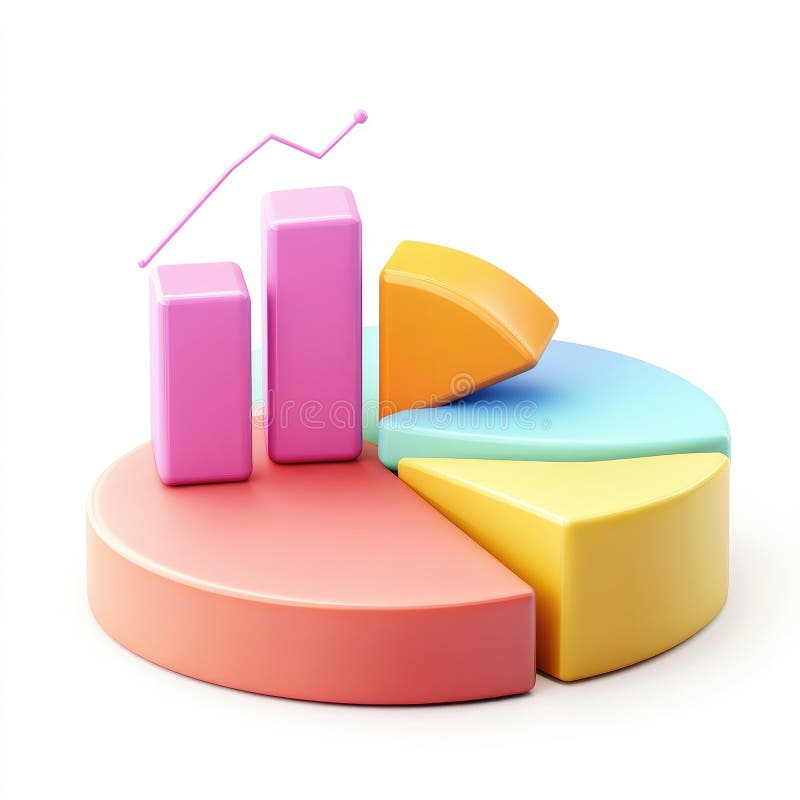
Free with trial This image showcases vibrant 3D bar and pie charts, illustrating growth and statistical data. Perfect for presentations or reports on financial success. Increase decrease graph illustrations Colorful 3D Bar and Pie Charts Showing Business Growth and Statistics. This image showcases vibrant 3D bar and pie charts, illustrating growth and statistical data. Perfect for presentations or reports on financial success.
Free with trial In this conceptual image, two hands are presented, each holding glowing symbols. The left hand displays a percentage sign, while the right hand shows an upward and a downward arrow. The background is dark and blurred, with sparkling lights adding a touch of magic. Created ai. Increase decrease graph illustrations Boost your profits with rising interest rates and falling costs, a great investment opportunity awaits you. In this conceptual image, two hands are presented, each holding glowing symbols. The left hand displays a percentage sign, while the right hand shows an upward and a downward arrow. The background is dark and blurred, with sparkling lights adding a touch of magic. Created ai
Free with trial Hand interacting with a projected bar chart on a wall, exploring data visualization ,Generative ai. Increase decrease graph illustrations Data visualization, hand engages with interactive bar chart projected on wall, exploring trends and insights. Hand interacting with a projected bar chart on a wall, exploring data visualization ,Generative ai
Free with trial Heartbeat line morphs into falling red arrow on dark grid, showing sudden economic flatline. Vector illustration. Concept of downturn, crisis mode, emergency slowdown, collapse, instability. Increase decrease graph vectors Heartbeat line morphs into falling red arrow on dark grid, showing sudden economic flatline. Vector illustration.
Free with trial Vibrant bar chart visualization with dark background displaying data trends ,Generative ai. Increase decrease graph illustrations Colorful bar chart on dark background, data visualization for business performance analysis and trend insights. Vibrant bar chart visualization with dark background displaying data trends ,Generative ai
Free with trial A hand with a pen analyzes financial charts on a digital screen, highlighting investment trends, market analysis, and economic growth using visual representation of performance. Increase decrease graph illustrations Analyzing financial data with pen on digital screen, showing investment trends and growth. Chart displays performance. A hand with a pen analyzes financial charts on a digital screen, highlighting investment trends, market analysis, and economic growth using visual representation of performance
Free with trial A futuristic robotic hand reaches towards interactive financial charts, showcasing cutting-edge technology in data analysis and stock market trends with vivid color accents. Scalp. Increase decrease graph illustrations Advanced robotic hand interacting with dynamic financial charts and graphs, artificial intelligence analysis, stock. A futuristic robotic hand reaches towards interactive financial charts, showcasing cutting-edge technology in data analysis and stock market trends with vivid color accents. Scalp
Free with trial Animated Stream Of Interfaces With Economic and stock information in blue color. Increase decrease graph illustrations Animated Stream Of Interfaces With Economic and stock information in blue color
Free with trial Animated Stream Of Interfaces With Economic and stock information in blue color. Increase decrease graph illustrations Animated Stream Of Interfaces With Economic and stock information in blue color
Free with trial Animated Stream Of Interfaces With Economic and stock information in blue color. Increase decrease graph illustrations Animated Stream Of Interfaces With Economic and stock information in blue color
Free with trial Animated Stream Of Interfaces With Economic and stock information in blue color. Increase decrease graph illustrations Animated Stream Of Interfaces With Economic and stock information in blue color
Free with trial Animated Stream Of Interfaces With Economic and stock information in blue color. Increase decrease graph illustrations Animated Stream Of Interfaces With Economic and stock information in blue color
Free with trial A compilation of minimalist line art icons visually representing various financial concepts, including upward and downward market trends, investment growth, and economic indicators. Increase decrease graph vectors Collection of line art icons representing financial growth and market trends, isolated on transparent background. A compilation of minimalist line art icons visually representing various financial concepts, including upward and downward market trends, investment growth, and economic indicators
Free with trial A dynamic stock market chart against a blurred city skyline, symbolizing financial growth and investment opportunities. it represents the intersection of urban finance and economic trends, showcasing potential. Increase decrease graph illustrations Stock market analysis chart with city skyline background for financial investment growth concept. a dynamic stock market chart against a blurred city skyline, symbolizing financial growth and investment opportunities. it represents the intersection of urban finance and economic trends, showcasing potential.
Free with trial Businessmen hold coins, run on stack of money in bar chart. Complete of business competiition, pursuit of economic success, financial management, capital market performance, and profit growth. Increase decrease graph vectors Businessmen hold coins, run on stack of money in bar chart. Complete of business competiition, pursuit of economic success
Free with trial Up and Down sign with green and red arrows vector illustration. Concept of sales bar chart symbol icon with arrow moving down and sales bar chart with arrow moving up. Increase decrease graph vectors Up and Down sign with green and red arrows vector illustration. Concept of sales bar chart symbol icon
Free with trial A businessman holds a coin, runs on stack of money in bar chart. Concepts of business development, pursuit of economic success, financial management, capital market performance, and profit growth. Increase decrease graph vectors A businessman holds a coin, runs on stack of money in bar chart. Concepts of business development, pursuit of economic success
Free with trial Digital financial chart displays rising falling stock market data. Dynamic investment data visualization shows fluctuating market trends. Abstract financial interface with glowing. Increase decrease graph illustrations Digital financial chart displays rising, falling stock market data. Dynamic investment data visualization shows fluctuating. Digital financial chart displays rising falling stock market data. Dynamic investment data visualization shows fluctuating market trends. Abstract financial interface with glowing.
Free with trial Upward and downward arrows with a percentage symbol. An illustration of arrows pointing up and down, often used to represent changes, fluctuations, or progress, along with a percentage symbol. Increase decrease graph vectors Upward and Downward Arrows with Percentage, Financial Growth and Decline Concept. Upward and downward arrows with a percentage symbol. An illustration of arrows pointing up and down, often used to represent changes, fluctuations, or progress, along with a percentage symbol.
Free with trial Modern artwork. Man in suit holds orange umbrella while standing on golden coin stacks as multiple purple arrows fall, symbolizing protection during financial crisis. Concept of recession, insurance. Increase decrease graph illustrations Modern artwork. Man in suit holds orange umbrella while standing on golden coin stacks as multiple purple arrows fall
Free with trial Set of linear graphs with red and blue lines showing different trends and dynamics vector illustration. Change in time of election results or income. For business analytics, financial reports. Increase decrease graph vectors Set of linear graphs with red and blue lines showing different trends and dynamics vector illustration. Change in time of election
Free with trial Businessmen hold banknotes, run on stack of money in bar chart. Complete of business competiition, pursuit of economic success, financial management, capital market performance, and profit growth. Increase decrease graph vectors Businessmen hold banknotes, run on stack of money in bar chart. Complete of business competiition, pursuit of economic success
Free with trial A vibrant infographic visualizes global consumption trends using circular graphs and colorful gradients This modern data visualization effectively presents worldwide consumption patterns, highlighting key insights for business analysis, market research, and economic reporting Ideal for presentations and publications, its design ensures easy data comprehension AI Generative. Increase decrease graph illustrations Abstract Infographic Global Consumption Trends Visualization with Circular Graphs and Colorful Gradients Modern Data Visualization. A vibrant infographic visualizes global consumption trends using circular graphs and colorful gradients This modern data visualization effectively presents worldwide consumption patterns, highlighting key insights for business analysis, market research, and economic reporting Ideal for presentations and publications, its design ensures easy data comprehension AI Generative
Free with trial Wooden blocks show opposing directional arrows, contrasting trends choices. One block features red up arrow, black down arrow, representing progress decline. Symbols convey concepts of. Increase decrease graph illustrations Wooden blocks show opposing directional arrows, contrasting trends choices. One block features red up arrow, black down arrow
Free with trial Infographic world map with charts, graphs, and data visualizations for business reports, presentations, and website content, vibrant background Generative AI. Increase decrease graph illustrations Infographic world map with charts, graphs, and data visualizations for business reports, presentations, and website content
Free with trial Uptrend or downtrend set on a dark grey to black minimalist studio background, represented by an upward scrolling white columnar bar chart. 3D render visualizing market trend or challenging business. Increase decrease graph illustrations Uptrend or downtrend set on a dark grey to black minimalist studio background, represented by an upward scrolling white columnar
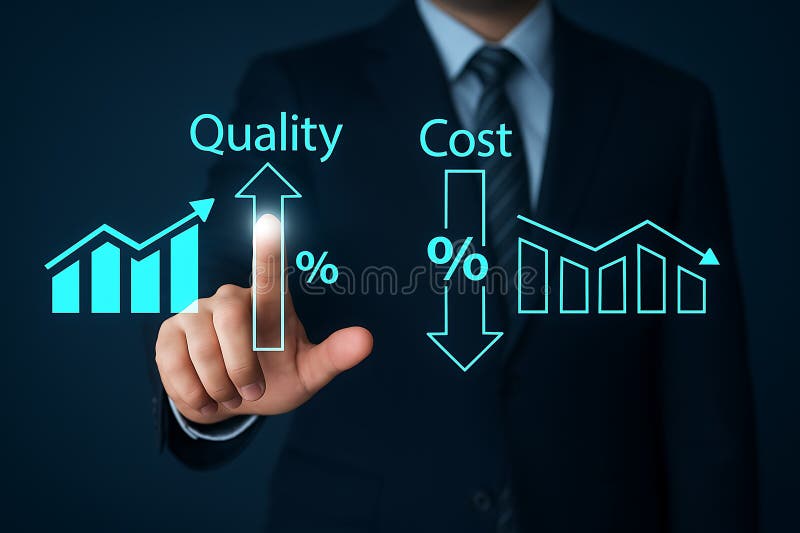
Free with trial Businessman pointing at a digital interface with interactive graphs representing quality and cost, with arrows indicating trends�quality is increasing while cost is decreasing, illustrating a business performance improvement. Increase decrease graph illustrations Businessman interacting with digital interface showing quality and cost graphs with arrows pointing up and down. businessman pointing at a digital interface with interactive graphs representing quality and cost, with arrows indicating trends�quality is increasing while cost is decreasing, illustrating a business performance improvement
Free with trial Vibrant 12-slice pie chart with distinct colored segments labeled with numbers in black cursive font. Gray wall background highlights rich colors and bold numbers. Increase decrease graph illustrations Vibrant 12-slice pie chart with distinct colored segments, labeled with numbers in black cursive font. Gray wall background. Vibrant 12-slice pie chart with distinct colored segments labeled with numbers in black cursive font. Gray wall background highlights rich colors and bold numbers.
Free with trial Red glossy arrow pointing upwards isolated on white background. Direction guide. Close-up. Increase decrease graph illustrations Red glossy arrow pointing upwards isolated on white background. Direction guide
Free with trial Red glossy arrow pointing upwards isolated on white background. Direction guide. Close-up. Increase decrease graph illustrations Red glossy arrow pointing upwards isolated on white background. Direction guide
Free with trial Red glossy arrow pointing upwards isolated on white background. Direction guide. Close-up. Increase decrease graph illustrations Red glossy arrow pointing upwards isolated on white background. Direction guide
Free with trial Red glossy arrow pointing upwards isolated on white background. Direction guide. Close-up. Increase decrease graph illustrations Red glossy arrow pointing upwards isolated on white background. Direction guide
Free with trial Red glossy arrow pointing upwards isolated on white background. Direction guide. Close-up. Increase decrease graph illustrations Red glossy arrow pointing upwards isolated on white background. Direction guide
Free with trial Red glossy arrow pointing upwards isolated on white background. Direction guide. Close-up. Increase decrease graph illustrations Red glossy arrow pointing upwards isolated on white background. Direction guide
Free with trial Red glossy arrow pointing upwards isolated on white background. Direction guide. Close-up. Increase decrease graph illustrations Red glossy arrow pointing upwards isolated on white background. Direction guide
Free with trial Red glossy arrow pointing upwards isolated on white background. Direction guide. Close-up. Increase decrease graph illustrations Red glossy arrow pointing upwards isolated on white background. Direction guide
Free with trial Modern artwork. Businesspeople stand in shock around single golden coin as large purple and yellow arrows point downward, symbolizing financial collapse. Concept of economy crisis, wage stagnation. Ad. Increase decrease graph illustrations Modern artwork. Businesspeople stand in shock around single golden coin as large purple and yellow arrows point downward
Free with trial A set of line art icons illustrating financial growth, investment strategies, and market analysis, perfect for business presentations and reports with clean design. Increase decrease graph vectors Vector art of line art icons depicting financial growth, investment strategies, and market analysis, ideal for illustrating. A set of line art icons illustrating financial growth, investment strategies, and market analysis, perfect for business presentations and reports with clean design
Free with trial Digital tablet displaying real-time gold price chart with line graphs, market indicators. Investment analysis, financial market data, trading concept. Tablet is on gold bars financial. Increase decrease graph illustrations Digital tablet displaying real-time gold price chart with line graphs, market indicators. Investment analysis, financial market
Free with trial A set of linear icons depicting financial growth, including upward arrows, charts, and currency symbols, representing economic progress and investment trends on white. Increase decrease graph vectors Vector art of financial growth icons a collection of symbols representing economic progress, investment, and market trends. A set of linear icons depicting financial growth, including upward arrows, charts, and currency symbols, representing economic progress and investment trends on white
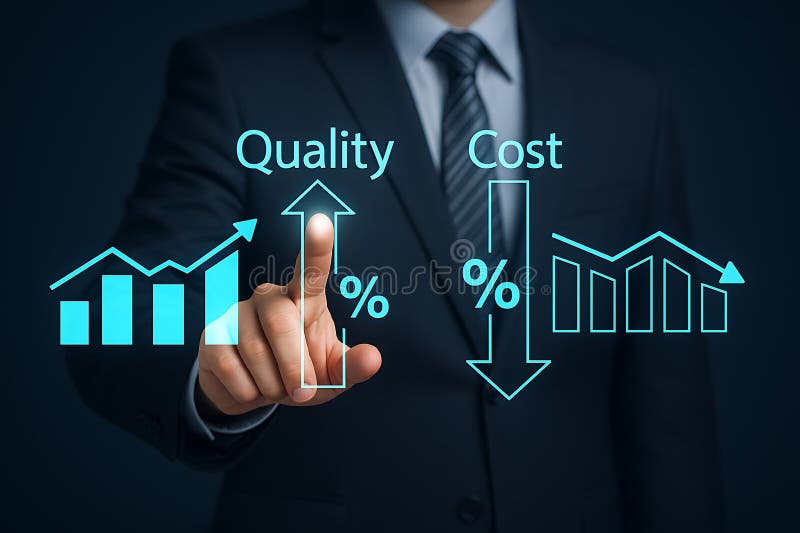
Free with trial Businessman pointing at a digital interface with interactive graphs showing quality and cost, where quality is increasing and cost is decreasing, representing trends in business performance, set in a professional and modern workspace. Increase decrease graph illustrations Businessman interacting with a digital interface showing quality and cost graphs with arrows pointing up and down. businessman pointing at a digital interface with interactive graphs showing quality and cost, where quality is increasing and cost is decreasing, representing trends in business performance, set in a professional and modern workspace
Free with trial A businessman holds banknotes, runs on stack of money in bar chart. Concepts of business development, pursuit of economic success, financial management, capital market performance, and profit growth. Increase decrease graph vectors A businessman holds banknotes, runs on stack of money in bar chart. Concepts of business development, pursuit of economic success
Free with trial The image captures a close-up view of someone examining financial charts on a screen, possibly for making trading or investment decisions, emphasizing the data-driven nature of finance. Increase decrease graph illustrations A person analyzing financial market charts on a screen, possibly for investment or trading decisions. Data-driven finance concept. The image captures a close-up view of someone examining financial charts on a screen, possibly for making trading or investment decisions, emphasizing the data-driven nature of finance
Free with trial Colorful 3D bar chart illustration on blue background with red, orange, yellow, turquoise bars. Simple, clean geometric shapes represent statistics, business data for reports. Increase decrease graph illustrations Colorful 3D bar chart illustration on blue background with red, orange, yellow, turquoise bars. Simple, clean geometric shapes
Free with trial Green glossy arrow pointing upwards isolated on white background. Direction guide. Close-up. Increase decrease graph illustrations Green glossy arrow pointing upwards isolated on white background. Direction guide
Free with trial Green glossy arrow pointing upwards isolated on white background. Direction guide. Close-up. Increase decrease graph illustrations Green glossy arrow pointing upwards isolated on white background. Direction guide
Free with trial Green glossy arrow pointing upwards isolated on white background. Direction guide. Close-up. Increase decrease graph illustrations Green glossy arrow pointing upwards isolated on white background. Direction guide
Free with trial Green glossy arrow pointing upwards isolated on white background. Direction guide. Close-up. Increase decrease graph illustrations Green glossy arrow pointing upwards isolated on white background. Direction guide
Free with trial Green glossy arrow pointing upwards isolated on white background. Direction guide. Close-up. Increase decrease graph illustrations Green glossy arrow pointing upwards isolated on white background. Direction guide
Free with trial Arrows and infographic elements icons collection is a vector illustration with editable stroke. Increase decrease graph vectors Arrows and infographic elements icons collection is a vector illustration with editable stroke.
Free with trial Person using smartphone for stock trading. Mobile phone displays financial data charts. Hands actively interact with screen. Market trends shown in background. Businessman investor. Increase decrease graph illustrations Person using smartphone for stock trading. Mobile phone displays financial data, charts. Hands actively interact with screen. Person using smartphone for stock trading. Mobile phone displays financial data charts. Hands actively interact with screen. Market trends shown in background. Businessman investor.
Free with trial Watercolor illustration of business growth. Orange bar, pie charts on aged paper show data analysis, market trends, financial progress. Visuals represent success, planning strategic. Increase decrease graph illustrations Watercolor illustration of business growth. Orange bar, pie charts on aged paper show data analysis, market trends, financial
Free with trial Magnifying glass focuses on stock market chart details. Analyzing trends changes. Financial data in focus. Investment strategy. Visual representation of market trends. Studying market. Increase decrease graph illustrations Magnifying glass focuses on stock market chart details. Analyzing trends, changes. Financial data in focus. Investment strategy. Magnifying glass focuses on stock market chart details. Analyzing trends changes. Financial data in focus. Investment strategy. Visual representation of market trends. Studying market.
Free with trial Close-up shot of stock market chart with upward and downward trends. Red and blue lines over keyboard show dynamic financial data on screen. Economic analysis forecasting. Increase decrease graph illustrations Close-up shot of stock market chart with upward and downward trends. Red and blue lines over keyboard show dynamic financial data
Free with trial This image features the "3%" symbol, representing a small percentage. It can denote a discount, interest rate, or statistical value in finance and mathematics. Increase decrease graph vectors Vector art of three percent symbol representing a small percentage, discount, interest rate, or statistical value in finance and. This image features the "3%" symbol, representing a small percentage. It can denote a discount, interest rate, or statistical value in finance and mathematics
Free with trial Animated Stream Of Interfaces With Economic and stock information red and yellow color, speculation fall. Increase decrease graph illustrations Animated Stream Of Interfaces With Economic and stock information red and yellow color, speculation fall
Free with trial Animated Stream Of Interfaces With Economic and stock information red and yellow color, speculation fall. Increase decrease graph illustrations Animated Stream Of Interfaces With Economic and stock information red and yellow color, speculation fall
Free with trial Animated Stream Of Interfaces With Economic and stock information red and yellow color, speculation fall. Increase decrease graph illustrations Animated Stream Of Interfaces With Economic and stock information red and yellow color, speculation fall
Free with trial Animated Stream Of Interfaces With Economic and stock information red and yellow color, speculation fall. Increase decrease graph illustrations Animated Stream Of Interfaces With Economic and stock information red and yellow color, speculation fall
Free with trial Animated Stream Of Interfaces With Economic and stock information red and yellow color, speculation fall. Increase decrease graph illustrations Animated Stream Of Interfaces With Economic and stock information red and yellow color, speculation fall