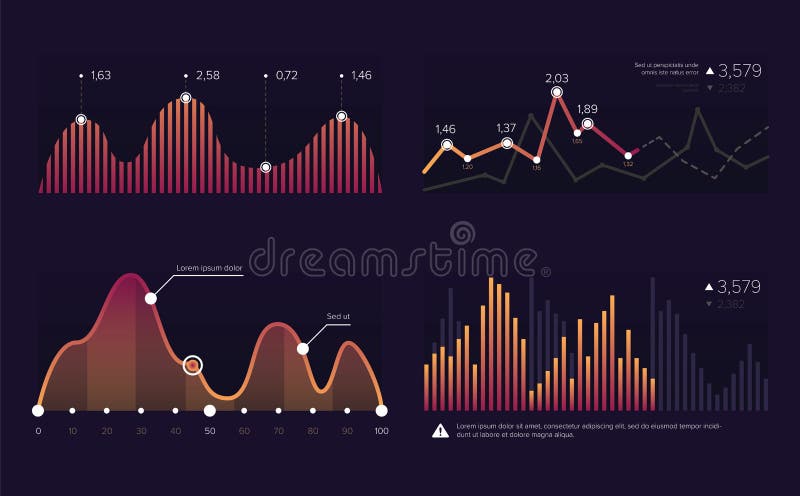
Free with trial Stock market charts and graphs, Vector illustration template design. Infographics financial growth decrease vectors Vector stock market charts and graphs. Stock market charts and graphs, Vector illustration template design
Free with trial Growth bar chart and red arrow moving down. Infographics financial growth decrease illustrations Growth bar chart and red arrow
Free with trial Gold coins falling down. Isolated on white background. illustration. Infographics financial growth decrease vectors Gold coins falling down.
Free with trial Business growth up and down infographics | business graph going down | 3d graph chart decrease infographics - 4k desktop background. Infographics financial growth decrease illustrations Business growth up and down infographics | business graph going down | 3d graph chart decrease infographics. Business growth up and down infographics | business graph going down | 3d graph chart decrease infographics - 4k desktop background
Free with trial Vector image charts and diagrams for presentation or financial report. Infographics concept. Increase and decrease of indicators in graphic diagram. Colorful vector illustration. Infographics financial growth decrease vectors Vector image charts and diagrams for presentation or financial report. Infographics concept.Increase and decrease of
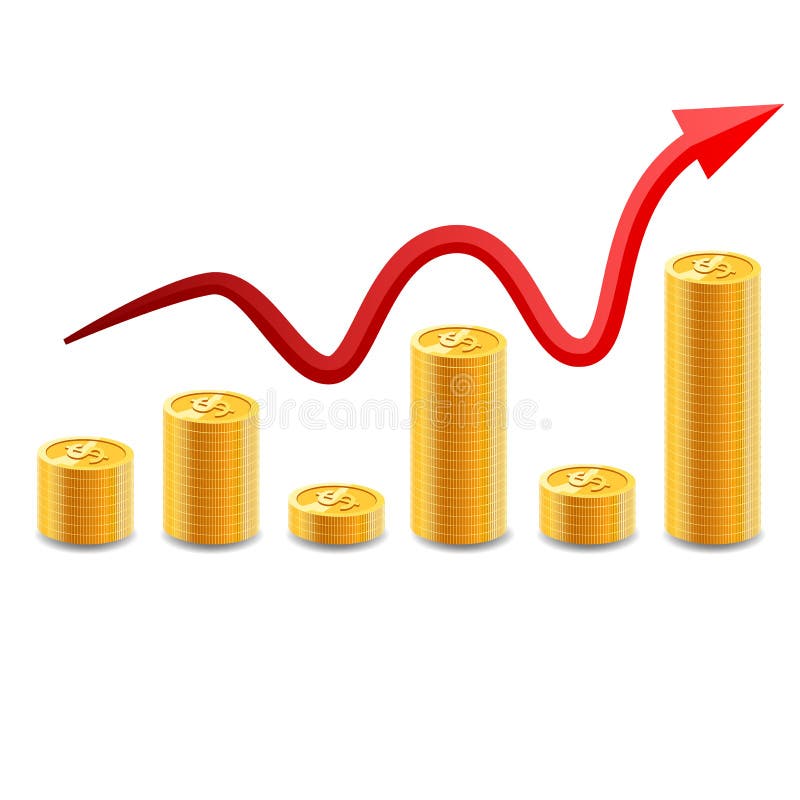
Free with trial Increasing piles of coins with going up graph. Concept for financial growth. illustration. Infographics financial growth decrease vectors Increasing piles of coins with going up graph.
Free with trial Continuous one line drawing of up and down arrows. Minimalist vector illustration of business growth graph symbol. Single line art icon representing increase and decrease trends. Infographics financial growth decrease vectors Continuous one line drawing of up and down arrows. Minimalist vector illustration of business growth graph symbol. Single line art
Free with trial Increasing piles of coins with going up graph. Concept for financial growth. illustration. Infographics financial growth decrease vectors Increasing piles of coins with going up graph.
Free with trial Timeline chart infographic template elements. Flat vector illustration of business development steps. Isolated infographics arrow symbols for web, internet, print, presentations, social networks. Infographics financial growth decrease vectors Timeline infographic vector template elements. Business development steps arrows chart. Timeline chart infographic template elements. Flat vector illustration of business development steps. Isolated infographics arrow symbols for web, internet, print, presentations, social networks.
Free with trial Stock Market Crash icon. Outline sign from economic crisis collection. Line Stock Market Crash icon for infographics, wed design and more. Infographics financial growth decrease vectors Stock Market Crash icon. Line element from economic crisis collection. Linear Stock Market Crash icon sign for web. Stock Market Crash icon. Outline sign from economic crisis collection. Line Stock Market Crash icon for infographics, wed design and more.
Free with trial Set line Project team base, Financial growth decrease, Pyramid chart infographics and Delivery tracking icon. Vector. Infographics financial growth decrease illustrations Set line Project team base, Financial growth decrease, Pyramid chart infographics and Delivery tracking icon. Vector
Free with trial Set line Financial growth decrease Arrow Pie chart infographic Many ways directional arrow Pyramid infographics and Graph chart diagram icon. Vector. Infographics financial growth decrease illustrations Set line Financial growth decrease, Arrow, Pie chart infographic, Many ways directional arrow, Pyramid infographics, and. Set line Financial growth decrease Arrow Pie chart infographic Many ways directional arrow Pyramid infographics and Graph chart diagram icon. Vector.
Free with trial Set line Pie chart infographic Pyramid infographics Light bulb Financial growth decrease Unknown search Arrow and Target icon. Vector. Infographics financial growth decrease vectors Set line Pie chart infographic, Pyramid infographics, Light bulb, Financial growth decrease, Unknown search, Arrow, and. Set line Pie chart infographic Pyramid infographics Light bulb Financial growth decrease Unknown search Arrow and Target icon. Vector.
Free with trial Set line Arrow Pie chart infographic Graph chart diagram Wrench and gear Pyramid infographics Financial growth decrease Flag and Factory icon. Vector. Infographics financial growth decrease vectors Set line Arrow, Pie chart infographic, Graph, chart, diagram, Wrench and gear, Pyramid infographics, Financial growth. Set line Arrow Pie chart infographic Graph chart diagram Wrench and gear Pyramid infographics Financial growth decrease Flag and Factory icon. Vector.
Free with trial A professional collection of 16 business and financial icons featuring various bar charts and line graphs. Perfect for UI dashboards, corporate presentations, and data-heavy infographics showing market growth or decline. Infographics financial growth decrease vectors Business Growth Bar Charts and Financial Trend Line Graph Vector Icons Set. A professional collection of 16 business and financial icons featuring various bar charts and line graphs. Perfect for UI dashboards, corporate presentations, and data-heavy infographics showing market growth or decline.
Free with trial A professional collection of 16 business and financial icons featuring various bar charts and line graphs. Perfect for UI dashboards, corporate presentations, and data-heavy infographics showing market growth or decline. Infographics financial growth decrease vectors Business Growth Bar Charts and Financial Trend Line Graph Vector Icons Set. A professional collection of 16 business and financial icons featuring various bar charts and line graphs. Perfect for UI dashboards, corporate presentations, and data-heavy infographics showing market growth or decline.
Free with trial Neon up and down arrows made of glowing particles, blue growth and pink decline indicators, abstract financial direction symbols for trading dashboards, stock market analytics and business infographics. Infographics financial growth decrease vectors Neon up and down arrows made of glowing particles, blue growth and pink decline indicators, abstract financial direction symbols
Free with trial A dynamic collection of hand-drawn financial and trend-related symbols rendered in a grunge, brush-stroke style. This illustration features various dollar signs, upward and downward arrows, a zig-zag chart line, checkmarks, and crosses. The black-on-white design conveys concepts of business growth, economic trends, profit, loss, success, and decision-making. Ideal for presentations, reports, infographics, or any design project requiring a raw, energetic visual representation of financial data and market fluctuations. Infographics financial growth decrease vectors Grunge Hand Drawn Financial Growth and Decline Symbols Set. A dynamic collection of hand-drawn financial and trend-related symbols rendered in a grunge, brush-stroke style. This illustration features various dollar signs, upward and downward arrows, a zig-zag chart line, checkmarks, and crosses. The black-on-white design conveys concepts of business growth, economic trends, profit, loss, success, and decision-making. Ideal for presentations, reports, infographics, or any design project requiring a raw, energetic visual representation of financial data and market fluctuations.
Free with trial A versatile collection of flat vector icons representing key concepts in finance, economics, and security. This comprehensive set includes symbols for market growth, decline, and trends, various currency representations like the Euro and Korean Won, and essential security elements such as open and closed padlocks. Designed with a clean, modern aesthetic, these icons are perfect for enhancing business presentations, financial reports, websites, mobile applications, and infographics, effectively illustrating concepts like investment, market analysis, currency exchange, and data protection. Infographics financial growth decrease vectors Financial and Security Vector Icon Set. A versatile collection of flat vector icons representing key concepts in finance, economics, and security. This comprehensive set includes symbols for market growth, decline, and trends, various currency representations like the Euro and Korean Won, and essential security elements such as open and closed padlocks. Designed with a clean, modern aesthetic, these icons are perfect for enhancing business presentations, financial reports, websites, mobile applications, and infographics, effectively illustrating concepts like investment, market analysis, currency exchange, and data protection.
Free with trial An isolated vector illustration featuring two prominent, stylized arrows on a clean white background. One arrow, colored in shades of red and pink, points diagonally upwards and to the right, symbolizing growth, increase, or positive trends. The other arrow, rendered in blue and cyan tones, points diagonally downwards and to the left, representing decline, decrease, or negative movement. Both arrows have a modern, slightly textured or sketchy appearance, making them ideal for infographics, business presentations, financial reports, or conceptual designs illustrating contrasting directions, market changes, or comparative data. Infographics financial growth decrease illustrations Growth and Decline Arrows with Sketchy Style. An isolated vector illustration featuring two prominent, stylized arrows on a clean white background. One arrow, colored in shades of red and pink, points diagonally upwards and to the right, symbolizing growth, increase, or positive trends. The other arrow, rendered in blue and cyan tones, points diagonally downwards and to the left, representing decline, decrease, or negative movement. Both arrows have a modern, slightly textured or sketchy appearance, making them ideal for infographics, business presentations, financial reports, or conceptual designs illustrating contrasting directions, market changes, or comparative data.
Free with trial This illustration features a collection of five distinct icons representing various financial concepts. From left to right, it shows a Bitcoin symbol with an upward trending graph, an envelope overflowing with cash, a hand holding a gold coin, a calculator with a downward arrow and stacked coins labeled 'Cost Management', and a magnifying glass over a market analysis graph. The icons are stylized with a clean, flat design and vibrant colors, making them ideal for presentations, infographics, and financial content. Infographics financial growth decrease vectors Financial Concepts Icons: Bitcoin Growth, Cash Envelope, Investment, Cost Management, Market Analysis. This illustration features a collection of five distinct icons representing various financial concepts. From left to right, it shows a Bitcoin symbol with an upward trending graph, an envelope overflowing with cash, a hand holding a gold coin, a calculator with a downward arrow and stacked coins labeled 'Cost Management', and a magnifying glass over a market analysis graph. The icons are stylized with a clean, flat design and vibrant colors, making them ideal for presentations, infographics, and financial content.
Free with trial A conceptual vector illustration depicting the duality of business performance. On a modern teal background, two reports are shown side-by-side. One features a rising red graph symbolizing growth, profit, and success, while the other displays a descending graph representing decline, loss, and failure. This flat design graphic is ideal for financial analysis, market trend comparisons, business presentations, and infographics illustrating opposite outcomes or strategic choices. The long shadow effect adds a contemporary feel to the design. Infographics financial growth decrease vectors Growth and Decline Business Charts Comparison. A conceptual vector illustration depicting the duality of business performance. On a modern teal background, two reports are shown side-by-side. One features a rising red graph symbolizing growth, profit, and success, while the other displays a descending graph representing decline, loss, and failure. This flat design graphic is ideal for financial analysis, market trend comparisons, business presentations, and infographics illustrating opposite outcomes or strategic choices. The long shadow effect adds a contemporary feel to the design.
Free with trial A comprehensive vector icon set featuring essential symbols for business, finance, time management, and status indicators. The collection includes icons representing growth, trends, success, failure, deadlines, time tracking, and financial assets like coin stacks and currency. Designed in a clean, flat style, these versatile pictograms are ideal for web interfaces, mobile applications, presentations, infographics, and various digital projects requiring clear visual communication of progress, results, and financial concepts. Perfect for illustrating reports, dashboards, or user feedback. Infographics financial growth decrease vectors Business, Time, and Financial Status Vector Icons Set. A comprehensive vector icon set featuring essential symbols for business, finance, time management, and status indicators. The collection includes icons representing growth, trends, success, failure, deadlines, time tracking, and financial assets like coin stacks and currency. Designed in a clean, flat style, these versatile pictograms are ideal for web interfaces, mobile applications, presentations, infographics, and various digital projects requiring clear visual communication of progress, results, and financial concepts. Perfect for illustrating reports, dashboards, or user feedback.
Free with trial A clean, minimalist 3D rendering of a declining bar chart in a monochromatic pastel pink color scheme. The bars are arranged in descending order, clearly illustrating a concept of decrease, loss, or a downward trend. This abstract and modern graphic is perfect for business and financial presentations, reports, or infographics about recession, economic downturn, sales reduction, or negative growth. The soft lighting and ample copy space make it a versatile background for various data visualization and corporate concepts. Infographics financial growth decrease illustrations Minimalist Pink 3D Bar Chart Showing a Downward Trend. A clean, minimalist 3D rendering of a declining bar chart in a monochromatic pastel pink color scheme. The bars are arranged in descending order, clearly illustrating a concept of decrease, loss, or a downward trend. This abstract and modern graphic is perfect for business and financial presentations, reports, or infographics about recession, economic downturn, sales reduction, or negative growth. The soft lighting and ample copy space make it a versatile background for various data visualization and corporate concepts.
Free with trial Collection of various business and financial chart icons in a modern, flat style, set against a dark blue background. Perfect for infographics, presentations, and websites requiring data visualization elements. Infographics financial growth decrease illustrations Business and Financial Icons Set on Dark Blue Background for Design Elements. Collection of various business and financial chart icons in a modern, flat style, set against a dark blue background. Perfect for infographics, presentations, and websites requiring data visualization elements
Free with trial Business analytics, data visualization, market research, financial reports, and growth strategies are symbolized in this image. Elegant empty space crafted for branding, ads, and product presentations. Suitable for marketing campaigns and creative displays. . Generative AI. Infographics financial growth decrease illustrations Colorful Data Charts and Graphs on White Background Business analytics data visualization market research financial reports. Business analytics, data visualization, market research, financial reports, and growth strategies are symbolized in this image. Elegant empty space crafted for branding, ads, and product presentations. Suitable for marketing campaigns and creative displays. . Generative AI
Free with trial A collection of hand-drawn, black and white icons representing growth, decline, and financial concepts. The set includes upward and downward arrows, percentage symbols, and a bar graph illustrating trends. The simple line art style makes these icons versatile for various applications, including presentations, infographics, and website design. They convey concepts of progress, success, loss, and market fluctuations. Infographics financial growth decrease illustrations Growth and Decline Icons Set. A collection of hand-drawn, black and white icons representing growth, decline, and financial concepts. The set includes upward and downward arrows, percentage symbols, and a bar graph illustrating trends. The simple line art style makes these icons versatile for various applications, including presentations, infographics, and website design. They convey concepts of progress, success, loss, and market fluctuations.
Free with trial A modern flat design icon representing financial data analysis and market trends. This vector illustration features a combination of a green bar chart and a dark grey line graph, showing fluctuations in performance. An upward arrow indicates initial growth, followed by a volatile trend line symbolizing concepts like market instability, economic changes, profit and loss, or business analytics. This versatile graphic is perfect for infographics, financial reports, presentations, websites, and applications related to business, finance, statistics, and economics. Isolated on a white background for easy use. Infographics financial growth decrease vectors Financial Market Fluctuation Graph Icon. A modern flat design icon representing financial data analysis and market trends. This vector illustration features a combination of a green bar chart and a dark grey line graph, showing fluctuations in performance. An upward arrow indicates initial growth, followed by a volatile trend line symbolizing concepts like market instability, economic changes, profit and loss, or business analytics. This versatile graphic is perfect for infographics, financial reports, presentations, websites, and applications related to business, finance, statistics, and economics. Isolated on a white background for easy use.
Free with trial This minimalist vector illustration features two identical line graphs, presented in contrasting black and white themes. The left graph displays a black line on a white background, while the right shows a white line on a black background. Both graphs depict a clear downward trend with jagged fluctuations, symbolizing decline, loss, or negative growth over time. This versatile icon set is ideal for illustrating concepts such as economic downturns, financial losses, market crashes, business failures, or any data showing a significant decrease. Perfect for presentations, reports, infographics, and web design. Infographics financial growth decrease vectors Declining Line Graph Icon Set - Black and White. This minimalist vector illustration features two identical line graphs, presented in contrasting black and white themes. The left graph displays a black line on a white background, while the right shows a white line on a black background. Both graphs depict a clear downward trend with jagged fluctuations, symbolizing decline, loss, or negative growth over time. This versatile icon set is ideal for illustrating concepts such as economic downturns, financial losses, market crashes, business failures, or any data showing a significant decrease. Perfect for presentations, reports, infographics, and web design.
Free with trial A clean and modern set of financial icons, perfect for illustrating business concepts. The image features icons representing profit growth, expense management, tax documents, and investment summaries. The illustrations use a simple, flat design with a limited color palette, making them versatile for various applications. Ideal for presentations, websites, infographics, and financial reports. The set highlights key financial aspects in an easily understandable visual format. Infographics financial growth decrease illustrations Financial Icons Set: Profit, Expenses, Tax, and Investment Analysis. A clean and modern set of financial icons, perfect for illustrating business concepts. The image features icons representing profit growth, expense management, tax documents, and investment summaries. The illustrations use a simple, flat design with a limited color palette, making them versatile for various applications. Ideal for presentations, websites, infographics, and financial reports. The set highlights key financial aspects in an easily understandable visual format.
Free with trial A professional vector set of business chart icons showing both growth and decline trends. Includes bar charts and line graphs with upward and downward arrows, representing profit, loss, performance rise, and financial downfall. Perfect for business presentations, reports, websites, infographics, and more. Fully editable EPS file for scalable design use. Infographics financial growth decrease vectors . A professional vector set of business chart icons showing both growth and decline trends. Includes bar charts and line graphs with upward and downward arrows, representing profit, loss, performance rise, and financial downfall. Perfect for business presentations, reports, websites, infographics, and more. Fully editable EPS file for scalable design use.
Free with trial A comprehensive set of vector line icons depicting bull and bear market trends. This collection features various combinations of bull and bear silhouettes integrated with financial charts, including rising and falling line graphs and bar graphs. Each icon clearly symbolizes either a bullish market (growth, upward trend) or a bearish market (decline, downward trend). Ideal for financial websites, trading applications, investment presentations, economic reports, infographics, and educational materials illustrating stock market dynamics and investment strategies. Infographics financial growth decrease vectors Bull and Bear Market Stock Trading Line Icons Set. A comprehensive set of vector line icons depicting bull and bear market trends. This collection features various combinations of bull and bear silhouettes integrated with financial charts, including rising and falling line graphs and bar graphs. Each icon clearly symbolizes either a bullish market (growth, upward trend) or a bearish market (decline, downward trend). Ideal for financial websites, trading applications, investment presentations, economic reports, infographics, and educational materials illustrating stock market dynamics and investment strategies.
Free with trial A simple and clean line art icon of a graph, isolated on a white background. This vector illustration features a line chart with axes, showing a fluctuating trend with distinct data points. The minimalist design makes it perfect for various applications related to business, finance, and data analysis. Ideal for use in presentations, infographics, websites, mobile apps, and user interfaces to represent concepts like statistics, growth, market trends, performance reports, and financial analytics. A versatile symbol for progress and data visualization. Infographics financial growth decrease illustrations Analytics Line Graph Vector Icon. A simple and clean line art icon of a graph, isolated on a white background. This vector illustration features a line chart with axes, showing a fluctuating trend with distinct data points. The minimalist design makes it perfect for various applications related to business, finance, and data analysis. Ideal for use in presentations, infographics, websites, mobile apps, and user interfaces to represent concepts like statistics, growth, market trends, performance reports, and financial analytics. A versatile symbol for progress and data visualization.
Free with trial A comprehensive vector icon set featuring essential symbols for business, finance, and data analysis. This collection includes various arrows for indicating growth and decline, wavy lines representing market trends, checkmarks for success or approval, X marks for errors or rejection, stopwatches for time management and efficiency, and stacks of coins with dollar signs for financial concepts. Ideal for presentations, infographics, web design, and reports to visually communicate progress, status, and economic indicators. Infographics financial growth decrease vectors Business, Finance, and Data Analytics Vector Icon Set. A comprehensive vector icon set featuring essential symbols for business, finance, and data analysis. This collection includes various arrows for indicating growth and decline, wavy lines representing market trends, checkmarks for success or approval, X marks for errors or rejection, stopwatches for time management and efficiency, and stacks of coins with dollar signs for financial concepts. Ideal for presentations, infographics, web design, and reports to visually communicate progress, status, and economic indicators.
Free with trial A vibrant, hand-drawn doodle illustration centered around a large percentage sign. This creative sketch features various financial and business icons, including bar graphs, pie charts, stacks of coins, dollar signs, and arrows indicating growth and decline. The colorful, cartoonish style makes it perfect for illustrating concepts like interest rates, economic trends, business analytics, and financial reports. Ideal for use in presentations, infographics, websites, and educational materials, this vector art is isolated on a white background for versatile application. Infographics financial growth decrease illustrations Finance and Economy Doodle Illustration. A vibrant, hand-drawn doodle illustration centered around a large percentage sign. This creative sketch features various financial and business icons, including bar graphs, pie charts, stacks of coins, dollar signs, and arrows indicating growth and decline. The colorful, cartoonish style makes it perfect for illustrating concepts like interest rates, economic trends, business analytics, and financial reports. Ideal for use in presentations, infographics, websites, and educational materials, this vector art is isolated on a white background for versatile application.
Free with trial A clean and minimalist black outline icon of a percentage symbol, isolated on a pure white background. This versatile graphic represents discounts, sales, interest rates, financial calculations, and statistical data. Ideal for web design, mobile applications, business presentations, marketing materials, infographics, and educational content. Its simple, modern aesthetic makes it perfect for conveying concepts of proportion, growth, and change in a clear and concise manner. Infographics financial growth decrease illustrations Minimalist Percentage Symbol Outline Icon. A clean and minimalist black outline icon of a percentage symbol, isolated on a pure white background. This versatile graphic represents discounts, sales, interest rates, financial calculations, and statistical data. Ideal for web design, mobile applications, business presentations, marketing materials, infographics, and educational content. Its simple, modern aesthetic makes it perfect for conveying concepts of proportion, growth, and change in a clear and concise manner.
Free with trial A conceptual vector illustration depicting a severe economic downturn. The image features a grey bar chart with progressively shorter bars, symbolizing declining profits or performance. A bold red arrow points sharply downwards, representing a crash or significant loss, alongside a blue line graph also showing a negative trend. This graphic is ideal for illustrating concepts such as financial crisis, recession, stock market crash, business failure, bankruptcy, and negative growth. Perfect for financial reports, business presentations, news articles, and economic analysis infographics. Infographics financial growth decrease illustrations Economic Downturn and Financial Crisis Graph. A conceptual vector illustration depicting a severe economic downturn. The image features a grey bar chart with progressively shorter bars, symbolizing declining profits or performance. A bold red arrow points sharply downwards, representing a crash or significant loss, alongside a blue line graph also showing a negative trend. This graphic is ideal for illustrating concepts such as financial crisis, recession, stock market crash, business failure, bankruptcy, and negative growth. Perfect for financial reports, business presentations, news articles, and economic analysis infographics.
Free with trial Bar chart representation of data increase growth and finance. Data analysis. Infographics financial growth decrease vectors Bar chart representation of data increase growth and finance. Data analysis
Free with trial This image features a minimalist and modern vector icon of a jagged downward trending line graph, sharply declining from left to right, symbolizing financial loss, economic downturn, or market decline, set against a clean and uncluttered white background suitable for use in presentations, reports, infographics, or digital media to visually communicate negative trends or decreasing performance. Infographics financial growth decrease illustrations Sharp downward trending line graph icon isolated on white background representing financial loss or market decline vector. This image features a minimalist and modern vector icon of a jagged downward trending line graph, sharply declining from left to right, symbolizing financial loss, economic downturn, or market decline, set against a clean and uncluttered white background suitable for use in presentations, reports, infographics, or digital media to visually communicate negative trends or decreasing performance
Free with trial A comprehensive collection of hand-drawn business and data visualization icons. This doodle-style set features a variety of essential elements, including different types of arrows, bar graphs, line charts, and pie charts. The sketchy, black and white illustrations are perfect for infographics, presentations, financial reports, and marketing materials. Each icon is isolated on a white background, representing concepts like growth, statistics, process flow, and direction. This versatile vector set is ideal for adding a creative, hand-made touch to any project related to analytics, finance, or strategy. Infographics financial growth decrease illustrations Hand Drawn Business and Finance Doodle Icon Set. A comprehensive collection of hand-drawn business and data visualization icons. This doodle-style set features a variety of essential elements, including different types of arrows, bar graphs, line charts, and pie charts. The sketchy, black and white illustrations are perfect for infographics, presentations, financial reports, and marketing materials. Each icon is isolated on a white background, representing concepts like growth, statistics, process flow, and direction. This versatile vector set is ideal for adding a creative, hand-made touch to any project related to analytics, finance, or strategy.
Free with trial A minimalist, black and white vector icon representing a bar chart or graph. The icon features a series of vertical bars of varying heights, set against a base of horizontal lines. This clean and modern design is ideal for representing data, statistics, progress, growth, or financial information in digital and print media. Its simple aesthetic makes it versatile for use in presentations, websites, apps, and infographics. Infographics financial growth decrease vectors Abstract Bar Chart Icon. A minimalist, black and white vector icon representing a bar chart or graph. The icon features a series of vertical bars of varying heights, set against a base of horizontal lines. This clean and modern design is ideal for representing data, statistics, progress, growth, or financial information in digital and print media. Its simple aesthetic makes it versatile for use in presentations, websites, apps, and infographics.
Free with trial A clean and modern vector illustration of a line graph, isolated on a white background. This flat design icon features two distinct lines, one blue and one brown, plotting various data points to show trends and comparisons over time. It's a versatile graphic representing concepts like data analysis, business analytics, financial statistics, market research, and performance tracking. Ideal for use in presentations, infographics, websites, business reports, and marketing materials to visualize progress, growth, or economic fluctuations. Infographics financial growth decrease vectors Data Analysis Line Graph Icon. A clean and modern vector illustration of a line graph, isolated on a white background. This flat design icon features two distinct lines, one blue and one brown, plotting various data points to show trends and comparisons over time. It's a versatile graphic representing concepts like data analysis, business analytics, financial statistics, market research, and performance tracking. Ideal for use in presentations, infographics, websites, business reports, and marketing materials to visualize progress, growth, or economic fluctuations.
Free with trial A comprehensive collection of 16 black glyph icons on a clean white background, representing a wide range of concepts from business and technology to daily life and abstract ideas. This versatile set includes symbols for financial growth, strategic thinking, mobile alerts, religious symbols, and more. Ideal for web design, mobile applications, infographics, presentations, and any project requiring clear, minimalist, and modern visual communication. Perfect for conveying diverse messages efficiently. Infographics financial growth decrease vectors Diverse Universal Glyph Icons Set. A comprehensive collection of 16 black glyph icons on a clean white background, representing a wide range of concepts from business and technology to daily life and abstract ideas. This versatile set includes symbols for financial growth, strategic thinking, mobile alerts, religious symbols, and more. Ideal for web design, mobile applications, infographics, presentations, and any project requiring clear, minimalist, and modern visual communication. Perfect for conveying diverse messages efficiently.
Free with trial A clean, minimalist vector illustration of a bar chart featuring three distinct columns. The columns are colored in vibrant orange, teal, and yellow, representing different data points or categories. The chart is set against a white background with a dark blue axis line, making it ideal for presentations, reports, and infographics focused on data visualization, business growth, or financial analysis. Infographics financial growth decrease vectors Simple Bar Chart with Three Columns. A clean, minimalist vector illustration of a bar chart featuring three distinct columns. The columns are colored in vibrant orange, teal, and yellow, representing different data points or categories. The chart is set against a white background with a dark blue axis line, making it ideal for presentations, reports, and infographics focused on data visualization, business growth, or financial analysis.
Free with trial A minimalist black line graph icon on a clean white background, clearly illustrating a downward trend. The zigzagging line culminates in a sharp arrow pointing downwards, symbolizing decline, decrease, or negative performance. This versatile vector illustration is ideal for representing financial losses, economic downturns, sales drops, market crashes, or any data indicating a negative trajectory. Perfect for business reports, presentations, websites, apps, and infographics requiring a clear visual indicator of reduction or poor results. Infographics financial growth decrease vectors Downward Trend Graph with Arrow Icon. A minimalist black line graph icon on a clean white background, clearly illustrating a downward trend. The zigzagging line culminates in a sharp arrow pointing downwards, symbolizing decline, decrease, or negative performance. This versatile vector illustration is ideal for representing financial losses, economic downturns, sales drops, market crashes, or any data indicating a negative trajectory. Perfect for business reports, presentations, websites, apps, and infographics requiring a clear visual indicator of reduction or poor results.
Free with trial Hand-drawn financial charts and graphs displayed on a transparent glass board, perfect for business presentations. Infographics financial growth decrease illustrations Glass Board with Hand-Drawn Financial Charts and Graphs. Hand-drawn financial charts and graphs displayed on a transparent glass board, perfect for business presentations
Free with trial This vibrant vector illustration showcases a collection of red and orange gradient arrows, all pointing downwards. The set includes both straight and dynamically curved arrows, effectively symbolizing various forms of decline, decrease, or negative trends. Perfect for use in business presentations, financial reports, infographics, or any design requiring a clear visual representation of falling statistics, market drops, recession, loss, or a general downward movement. The clean, modern flat design ensures versatility and impact. Infographics financial growth decrease vectors Downward Trend Red Gradient Arrows Vector Set. This vibrant vector illustration showcases a collection of red and orange gradient arrows, all pointing downwards. The set includes both straight and dynamically curved arrows, effectively symbolizing various forms of decline, decrease, or negative trends. Perfect for use in business presentations, financial reports, infographics, or any design requiring a clear visual representation of falling statistics, market drops, recession, loss, or a general downward movement. The clean, modern flat design ensures versatility and impact.
Free with trial A colorful, hand-drawn illustration depicting a large percentage symbol surrounded by various financial and statistical icons. This doodle-style artwork includes bar graphs, pie charts, stacks of coins, dollar signs, and arrows indicating growth and decline. The sketch effectively visualizes concepts like interest rates, economic trends, business analytics, investment returns, and market data. Isolated on a white background, this versatile image is perfect for presentations, infographics, financial reports, and educational materials related to business, finance, and statistics. Infographics financial growth decrease illustrations Hand Drawn Finance and Percentage Concept Illustration. A colorful, hand-drawn illustration depicting a large percentage symbol surrounded by various financial and statistical icons. This doodle-style artwork includes bar graphs, pie charts, stacks of coins, dollar signs, and arrows indicating growth and decline. The sketch effectively visualizes concepts like interest rates, economic trends, business analytics, investment returns, and market data. Isolated on a white background, this versatile image is perfect for presentations, infographics, financial reports, and educational materials related to business, finance, and statistics.
Free with trial A minimalist black bar chart icon isolated on a clean white background. This simple graphic features three vertical bars of different heights resting on a horizontal axis, visually representing data, statistics, and comparative information. Ideal for illustrating business performance, financial reports, market trends, analytics, or any concept related to growth, decline, and quantitative analysis in presentations, websites, applications, and infographics. Its clean, flat design makes it versatile for various digital and print media. Infographics financial growth decrease vectors Minimalist Bar Chart Icon for Data Analysis and Statistics. A minimalist black bar chart icon isolated on a clean white background. This simple graphic features. A minimalist black bar chart icon isolated on a clean white background. This simple graphic features three vertical bars of different heights resting on a horizontal axis, visually representing data, statistics, and comparative information. Ideal for illustrating business performance, financial reports, market trends, analytics, or any concept related to growth, decline, and quantitative analysis in presentations, websites, applications, and infographics. Its clean, flat design makes it versatile for various digital and print media.
Free with trial A businessman in a suit uses a magnifying glass to show cost reduction with graphs and financial data visuals. Infographics financial growth decrease illustrations Businessman demonstrating cost reduction with data and graphs for financial analysis purpose image. A businessman in a suit uses a magnifying glass to show cost reduction with graphs and financial data visuals.
Free with trial Minimalist vector icons illustrating financial growth, savings, ice cream treat, and energy efficiency. Ideal for business presentations, infographics, and educational materials on economics or sustainability. Infographics financial growth decrease vectors Flat design icons for financial trends and energy consumption concepts. Minimalist vector icons illustrating financial growth, savings, ice cream treat, and energy efficiency. Ideal for business presentations, infographics, and educational materials on economics or sustainability
Free with trial Stylized graphics depict market trends with up and down arrows. Flat design with simple shapes for business and financial presentations. Infographics financial growth decrease vectors Stylized infographics illustrating growth and decline with upward and downward arrows on black background. Stylized graphics depict market trends with up and down arrows. Flat design with simple shapes for business and financial presentations.
Free with trial These clean, isolated upward and downward green and red arrows are ideal for illustrating various data visualization concepts. Perfect for presentations, reports, infographics, and marketing materials, they effectively communicate growth and decline trends in business, finance, or any field requiring visual representation of progress. The simple, modern design ensures the focus remains on the. Infographics financial growth decrease illustrations Simple Green and Red Arrows Isolated Vector Graphics for Visualizing Growth and Decline Trends in Business Data. These clean, isolated upward and downward green and red arrows are ideal for illustrating various data visualization concepts. Perfect for presentations, reports, infographics, and marketing materials, they effectively communicate growth and decline trends in business, finance, or any field requiring visual representation of progress. The simple, modern design ensures the focus remains on the
Free with trial A stylized illustration depicts a bar chart with blue bars of varying heights against a dark blue grid background. A prominent red and yellow arrow, symbolizing a downward trend, dramatically descends across the chart. This graphic represents financial decline, market crash, economic recession, or negative growth. Its clean, vector-style design makes it suitable for presentations, reports, and articles on business, finance, and economics. Infographics financial growth decrease illustrations Declining Bar Chart with Red Arrow. A stylized illustration depicts a bar chart with blue bars of varying heights against a dark blue grid background. A prominent red and yellow arrow, symbolizing a downward trend, dramatically descends across the chart. This graphic represents financial decline, market crash, economic recession, or negative growth. Its clean, vector-style design makes it suitable for presentations, reports, and articles on business, finance, and economics.
Free with trial Vector icon of a downward arrow or falling graph, symbolizing financial decline, loss trends, market crash, and negative economic performance. Ideal for finance apps, investment platforms, business reports, stock market analysis, and economic infographics. Clean, impactful, and scalable for both digital and print use. Infographics financial growth decrease vectors Financial Decline Trend Loss Graph Icon. Vector icon of a downward arrow or falling graph, symbolizing financial decline, loss trends, market crash, and negative economic performance. Ideal for finance apps, investment platforms, business reports, stock market analysis, and economic infographics. Clean, impactful, and scalable for both digital and print use.
Free with trial 3D rendering of a dynamic presentation stand showcasing financial data. Colorful, geometric shapes and infographics present market statistics, including percentages, dollar amounts, and bar graphs. Stacks of coins and various data elements are displayed on a dark blue platform with orange accents. Suitable for illustrating financial reports, market analysis, investment strategies, or business presentations. Infographics financial growth decrease illustrations Modern Financial Data Visualization Display. 3D rendering of a dynamic presentation stand showcasing financial data. Colorful, geometric shapes and infographics present market statistics, including percentages, dollar amounts, and bar graphs. Stacks of coins and various data elements are displayed on a dark blue platform with orange accents. Suitable for illustrating financial reports, market analysis, investment strategies, or business presentations.
Free with trial A clean, minimalist bar chart illustration set against a solid green background. The chart features three white vertical bars of different heights, representing data points or progress over time. A simple white grid and axes are visible, indicating a clear visual representation of statistics. This versatile graphic is ideal for conveying concepts of business growth, financial analysis, market trends, statistical reporting, or educational content in a modern, easy-to-understand format. Perfect for presentations, infographics, websites, and applications. Infographics financial growth decrease vectors Minimalist Bar Chart Icon on Green Background. A clean, minimalist bar chart illustration set against a solid green background. The chart features three white vertical bars of different heights, representing data points or progress over time. A simple white grid and axes are visible, indicating a clear visual representation of statistics. This versatile graphic is ideal for conveying concepts of business growth, financial analysis, market trends, statistical reporting, or educational content in a modern, easy-to-understand format. Perfect for presentations, infographics, websites, and applications.
Free with trial A vibrant collection of hand-drawn business charts and graphs, rendered in shades of blue with a sketch-like aesthetic. The set includes various types of visualizations like bar charts, line graphs, pie charts, and donut charts, representing data, growth, and analysis. This versatile illustration is perfect for presentations, reports, infographics, and any project requiring a visual representation of financial or statistical information with a creative, hand-crafted feel. Infographics financial growth decrease illustrations Hand-Drawn Business Charts and Graphs Collection. A vibrant collection of hand-drawn business charts and graphs, rendered in shades of blue with a sketch-like aesthetic. The set includes various types of visualizations like bar charts, line graphs, pie charts, and donut charts, representing data, growth, and analysis. This versatile illustration is perfect for presentations, reports, infographics, and any project requiring a visual representation of financial or statistical information with a creative, hand-crafted feel.
Free with trial The image depicts a financial graph with a downward trend, represented by red and blue neon lines against a dark, textured concrete wall and floor. the graph starts high on the left and sharply declines towards the lower right, ending with a prominent red arrow pointing downwards. a spotlight from above illuminates the graph, casting shadows and highlighting the rough texture of the concrete, creating a dramatic and somber mood. the overall composition conveys a sense of economic downturn or financial loss. Infographics financial growth decrease illustrations Descending financial graph on dark concrete wall. the image depicts a financial graph with a downward trend, represented by red and blue neon lines against a dark, textured concrete wall and floor. the graph starts high on the left and sharply declines towards the lower right, ending with a prominent red arrow pointing downwards. a spotlight from above illuminates the graph, casting shadows and highlighting the rough texture of the concrete, creating a dramatic and somber mood. the overall composition conveys a sense of economic downturn or financial loss.
Free with trial A clean and simple vector illustration of a bar chart isolated on a white background. This minimalist graphic features three vertical bars in varying shades of blue, representing data, statistics, or progress. Ideal for business reports, financial presentations, infographics, websites, and educational materials. The flat design symbolizes concepts like growth, analysis, market research, and performance comparison, offering a modern and clear way to visualize information. Ample copy space is available. Infographics financial growth decrease illustrations Simple Blue Bar Chart Vector Icon for Business Data. A clean and simple vector illustration of a bar chart isolated on a white background. This minimalist graphic features three vertical bars in varying shades of blue, representing data, statistics, or progress. Ideal for business reports, financial presentations, infographics, websites, and educational materials. The flat design symbolizes concepts like growth, analysis, market research, and performance comparison, offering a modern and clear way to visualize information. Ample copy space is available.
Free with trial A simple line drawing of a decreasing chart with an arrow pointing downwards, depicting negative growth or decline. Useful for presentations, infographics, and reports. Infographics financial growth decrease vectors Minimalist Line Style Decreasing Chart Arrow Down Financial Graphic Element. A simple line drawing of a decreasing chart with an arrow pointing downwards, depicting negative growth or decline. Useful for presentations, infographics, and reports.
Free with trial 3D infographics analyze trade deficits? impact on imports, exports, and economy. Infographics financial growth decrease illustrations Analyzing economic effects of trade deficits with 3D infographics on imports and exports. 3D infographics analyze trade deficits? impact on imports, exports, and economy
Free with trial Declining Bar Chart with Downward Arrow Representing Economic Downturn and Financial Loss. Infographics financial growth decrease vectors Declining Bar Chart with Downward Arrow Representing Economic Downturn and Financial Loss
Free with trial Minimalist vector illustration showing a black diagram with a downward arrow symbolizing economic decline, financial loss, recession, or negative business performance. Clean and modern design isolated on a white background, ideal for business presentations, financial reports, infographics, websites, mobile apps, and marketing materials related to economics, finance, investment, and analytics. Infographics financial growth decrease vectors . Minimalist vector illustration showing a black diagram with a downward arrow symbolizing economic decline, financial loss, recession, or negative business performance. Clean and modern design isolated on a white background, ideal for business presentations, financial reports, infographics, websites, mobile apps, and marketing materials related to economics, finance, investment, and analytics.
Free with trial A minimalist, black and white vector illustration depicting a financial graph with a clear downward trend. The graph features a jagged line representing fluctuating data, leading into a bold, thick arrow pointing downwards and to the right. This icon symbolizes decline, loss, recession, or negative performance in various contexts, such as business, economics, or stock markets. Its clean design makes it versatile for presentations, websites, and infographics. Infographics financial growth decrease vectors Downward Trend Graph with Arrow Icon. A minimalist, black and white vector illustration depicting a financial graph with a clear downward trend. The graph features a jagged line representing fluctuating data, leading into a bold, thick arrow pointing downwards and to the right. This icon symbolizes decline, loss, recession, or negative performance in various contexts, such as business, economics, or stock markets. Its clean design makes it versatile for presentations, websites, and infographics.
Free with trial Vibrant vector illustration featuring business data charts and graphs, including bar graphs, line graphs, pie charts, and a roller coaster metaphor for market trends. This eye-catching design is perfect for presentations, infographics, and financial reports. Infographics financial growth decrease illustrations Business Data Charts Graphs Vector Illustration, Statistics. Vibrant vector illustration featuring business data charts and graphs, including bar graphs, line graphs, pie charts, and a roller coaster metaphor for market trends. This eye-catching design is perfect for presentations, infographics, and financial reports.
Free with trial A clean, minimalist icon representing the stock market. The image features a bull and a bear, symbolizing market trends, with a rising green arrow indicating an upward trend. The design is enclosed in a circular frame, suitable for financial reports, investment presentations, or business infographics. The simple line art style makes it versatile for various applications. Infographics financial growth decrease illustrations Stock Market Bull and Bear Trend Icon. A clean, minimalist icon representing the stock market. The image features a bull and a bear, symbolizing market trends, with a rising green arrow indicating an upward trend. The design is enclosed in a circular frame, suitable for financial reports, investment presentations, or business infographics. The simple line art style makes it versatile for various applications.
Free with trial A 3D golden bar chart is arranged in a descending sequence, illustrating a downward trend. The bars are polished and reflective, casting subtle shadows on the pure white background. This visual represents a decline in data or financial performance. Infographics financial growth decrease illustrations Golden Bar Chart Showing Downward Trend on White Background graph metallic. A 3D golden bar chart is arranged in a descending sequence, illustrating a downward trend. The bars are polished and reflective, casting subtle shadows on the pure white background. This visual represents a decline in data or financial performance
Free with trial Up and down directional arrows in vector format for versatile use. Perfect for business infographics and data visualization. EPS 10. Infographics financial growth decrease vectors Up and down directional arrows in vector format for versatile use. Perfect for business infographics and data visualization.
Free with trial A vibrant collection of hand-drawn business charts and graphs, rendered in blue tones. The set includes various types of visualizations like bar charts, line graphs, and a pie chart, all with a sketchy, illustrative style. These visuals are ideal for presentations, reports, and infographics related to finance, data analysis, growth, and business performance. Infographics financial growth decrease illustrations Hand-Drawn Business Charts and Graphs Collection. A vibrant collection of hand-drawn business charts and graphs, rendered in blue tones. The set includes various types of visualizations like bar charts, line graphs, and a pie chart, all with a sketchy, illustrative style. These visuals are ideal for presentations, reports, and infographics related to finance, data analysis, growth, and business performance.
Free with trial A minimalist black icon depicting a business data chart. It features a bar graph with multiple vertical bars, overlaid by two distinct line graphs. One line graph shows an upward trend with data points, symbolizing growth and success, while the other illustrates a downward trend, representing decline or loss. This versatile vector illustration is ideal for conveying concepts related to financial analysis, market trends, business performance, statistics, and economic fluctuations. Perfect for web interfaces, presentations, reports, and infographics. Infographics financial growth decrease vectors Business Data Analysis Chart Icon with Trends. A minimalist black icon depicting a business data chart. It features a bar graph with multiple vertical bars, overlaid by two distinct line graphs. One line graph shows an upward trend with data points, symbolizing growth and success, while the other illustrates a downward trend, representing decline or loss. This versatile vector illustration is ideal for conveying concepts related to financial analysis, market trends, business performance, statistics, and economic fluctuations. Perfect for web interfaces, presentations, reports, and infographics.
Free with trial A vibrant 3D bar chart icon isolated on a clean white background. This minimalist data visualization features five colorful bars in a soft, pastel palette of yellow, pink, and purple, arranged in descending order. The clean, modern render is perfect for illustrating concepts like business statistics, financial reports, market analysis, and performance metrics. An ideal graphic element for presentations, infographics, websites, and educational materials, symbolizing data, comparison, and analytics in a visually appealing way. 3D illustration. Infographics financial growth decrease illustrations 3D Colorful Bar Chart for Business and Data Analysis. A vibrant 3D bar chart icon isolated on a clean white background. This minimalist data visualization features five colorful bars in a soft, pastel palette of yellow, pink, and purple, arranged in descending order. The clean, modern render is perfect for illustrating concepts like business statistics, financial reports, market analysis, and performance metrics. An ideal graphic element for presentations, infographics, websites, and educational materials, symbolizing data, comparison, and analytics in a visually appealing way. 3D illustration.
Free with trial A simple line style icon of a bar chart representing growth, data, or statistics. This graphic element is perfect for use in presentations, infographics, web design, and user interfaces. Infographics financial growth decrease vectors Simple Line Style Bar Chart Graphic Outline Display Graph Icon. A simple line style icon of a bar chart representing growth, data, or statistics. This graphic element is perfect for use in presentations, infographics, web design, and user interfaces.
Free with trial Financial concept image featuring a blue bar chart with a red downward arrow, illustrating decline, recession, or loss over time. Ideal for presentations, reports, infographics, economic forecasts, and business documentation. Clean, clear, and professional visual, created ai. Infographics financial growth decrease illustrations Business bar chart showing financial decline with downward arrow. Financial concept image featuring a blue bar chart with a red downward arrow, illustrating decline, recession, or loss over time. Ideal for presentations, reports, infographics, economic forecasts, and business documentation. Clean, clear, and professional visual, created ai.
Free with trial Colorful isometric bar chart showing business data and growth with bars of different height, colored blue, yellow and green. Isolated on a transparent background, perfect for business presentations or infographics. Infographics financial growth decrease vectors Colorful business chart illustration on transparent background AI Generated. Colorful isometric bar chart showing business data and growth with bars of different height, colored blue, yellow and green. Isolated on a transparent background, perfect for business presentations or infographics.
Free with trial This 3D render shows a calculator with a colorful bar chart made of cubes illustrating growth and success in business and finance. Perfect for presentations and infographics. Infographics financial growth decrease illustrations Colorful 3D Calculator with Growing Bar Chart Cubes for Business and Finance. This 3D render shows a calculator with a colorful bar chart made of cubes illustrating growth and success in business and finance. Perfect for presentations and infographics.
Free with trial Modern timeline candles are moving down with no resistance. 12 month financial statistics graph with business calendar Fear of down markets and down trends. Infographics financial growth decrease vectors Modern timeline candles are moving down with no resistance
Free with trial Doodle Graph icon. Blue pen hand drawn infographic symbol on a notepaper piece. Line art style graphic design element. Web button with shadow. Decline, save on expences concept. Infographics financial growth decrease vectors Doodle Graph icon
Free with trial A crisp, minimalist black percentage sign icon enclosed within a bold black circle, set against a clean white background. This flat vector illustration represents concepts such as discounts, sales, interest rates, statistics, and proportions. Its simple, modern design makes it highly versatile for various applications, including web and app interfaces, marketing materials, financial reports, e-commerce promotions, and infographics. Ideal for conveying numerical data, special offers, or mathematical concepts with clarity and impact. Infographics financial growth decrease illustrations Percentage Sign Icon in Circle. A crisp, minimalist black percentage sign icon enclosed within a bold black circle, set against a clean white background. This flat vector illustration represents concepts such as discounts, sales, interest rates, statistics, and proportions. Its simple, modern design makes it highly versatile for various applications, including web and app interfaces, marketing materials, financial reports, e-commerce promotions, and infographics. Ideal for conveying numerical data, special offers, or mathematical concepts with clarity and impact.
Free with trial Simple line graph illustrating data points and trends. Ideal for presentations, reports, and infographics related to business analysis, market research, or financial reporting. Infographics financial growth decrease vectors Simple Line Graph, Data Visualization, Business Chart. Simple line graph illustrating data points and trends. Ideal for presentations, reports, and infographics related to business analysis, market research, or financial reporting.