Free with trial A 3D rendered bar graph in descending order shows decline or trend, rendered in pastel shades of blue, green, and purple. Infographics financial growth decrease vectors Colorful descending bar graph illustration, 3D render, on transparent background. A 3D rendered bar graph in descending order shows decline or trend, rendered in pastel shades of blue, green, and purple.
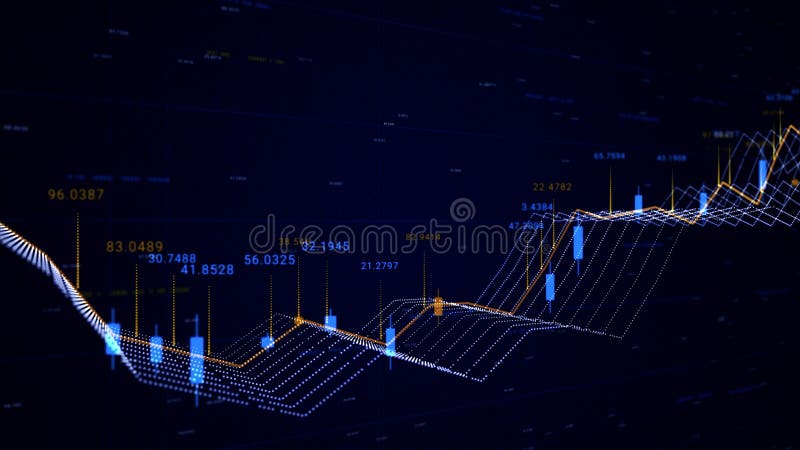
Free with trial Business data of the currency rate chart and economics decrease and growth. Infographics with world statistics, global data showing analytical information. Infographics financial growth decrease illustrations Business data of the currency rate chart and economics decrease and growth. Animation. Infographics with world. Business data of the currency rate chart and economics decrease and growth. Infographics with world statistics, global data showing analytical information.
Free with trial Bitcoin and chart Bearish icon decrease, background money, raster template. Infographics financial growth decrease vectors Bitcoin and chart Bearish icon decrease, background money, raster
Free with trial This is an detailed collection of minimalist line icons representing various business graphs and data trends. Infographics financial growth decrease vectors Professional business graph and data visualization line icon set for reports. This is an ai generated detailed collection of minimalist line icons representing. This is an detailed collection of minimalist line icons representing various business graphs and data trends
Free with trial Set of chart icons with dollar sign in even silhouette on a white background. The graph shows downward and upward trends. Vector. Infographics financial growth decrease vectors Set of graphic icons with dollar. Set of chart icons with dollar sign in even silhouette on a white background. The graph shows downward and upward trends. Vector
Free with trial Isometric graph with dollar sign. The graph shows a downward trend. Vector. Infographics financial growth decrease vectors Isometric graphic icon with dollar. Isometric graph with dollar sign. The graph shows a downward trend. Vector
Free with trial Icon of a splash of poured liquid on the surface. Icon of flowing drop, wave, splash, splash of nature isolated on white background. Dripping liquid. Water spill. A drop of rain and a drop of sweat. Infographics financial growth decrease vectors A large splash of spilled liquid on the surface. Icon of a splash of poured liquid on the surface. Icon of flowing drop, wave, splash, splash of nature isolated on white background. Dripping liquid. Water spill. A drop of rain and a drop of sweat
Free with trial Businessman analyzing data on large display screen,This image was created using AI. Infographics financial growth decrease illustrations Businessman analyzing data on large display screen
Free with trial A red background with red lines on it. The red lines are in different sizes and are arranged in a way that creates a sense of movement. The image conveys a feeling of energy and excitement. Infographics financial growth decrease vectors A red background with red lines on it
Free with trial Simple bar graph showing downward trend with arrow, decline in progress. Infographics financial growth decrease vectors Simple bar graph showing downward trend with arrow, decline in progress
Free with trial Vibrant 12-slice pie chart with distinct colored segments labeled with numbers in black cursive font. Gray wall background highlights rich colors and bold numbers. Infographics financial growth decrease illustrations Vibrant 12-slice pie chart with distinct colored segments, labeled with numbers in black cursive font. Gray wall background. Vibrant 12-slice pie chart with distinct colored segments labeled with numbers in black cursive font. Gray wall background highlights rich colors and bold numbers.
Free with trial Set Location, Financial growth decrease and Pyramid chart infographics icon. Vector. Infographics financial growth decrease vectors Set Location, Financial growth decrease and Pyramid chart infographics icon. Vector
Free with trial Set Financial growth decrease, Arrow, Pie chart infographic and Pyramid infographics on wooden background. Vector. Infographics financial growth decrease illustrations Set Financial growth decrease, Arrow, Pie chart infographic and Pyramid infographics on wooden background. Vector
Free with trial Set Pyramid chart infographics, Pie, Hierarchy organogram and Financial growth decrease icon. Vector. Infographics financial growth decrease vectors Set Pyramid chart infographics, Pie, Hierarchy organogram and Financial growth decrease icon. Vector
Free with trial Set Financial growth decrease, Pyramid chart infographics, Arrow, Wrench and gear, Factory and icon. Vector. Infographics financial growth decrease vectors Set Financial growth decrease, Pyramid chart infographics, Arrow, Wrench and gear, Factory and icon. Vector
Free with trial Set Digital speed meter, Financial growth decrease, Wrench and gear and Pyramid chart infographics icon. Vector. Infographics financial growth decrease vectors Set Digital speed meter, Financial growth decrease, Wrench and gear and Pyramid chart infographics icon. Vector
Free with trial Set line Location Pyramid chart infographics Financial growth decrease Arrow Clock Pie and Wrench and gear icon. Vector. Infographics financial growth decrease vectors Set line Location, Pyramid chart infographics, Financial growth, decrease, Arrow, Clock, Pie and Wrench and gear icon
Free with trial Set line Shopping bag with Sale, Financial growth decrease, Pyramid chart infographics and Pie. Color circle button. Vector. Infographics financial growth decrease vectors Set line Shopping bag with Sale, Financial growth decrease, Pyramid chart infographics and Pie. Color circle button
Free with trial Set line Flag, Financial growth decrease, Pyramid chart infographics and Light bulb icon. Vector. Infographics financial growth decrease illustrations Set line Flag, Financial growth decrease, Pyramid chart infographics and Light bulb icon. Vector
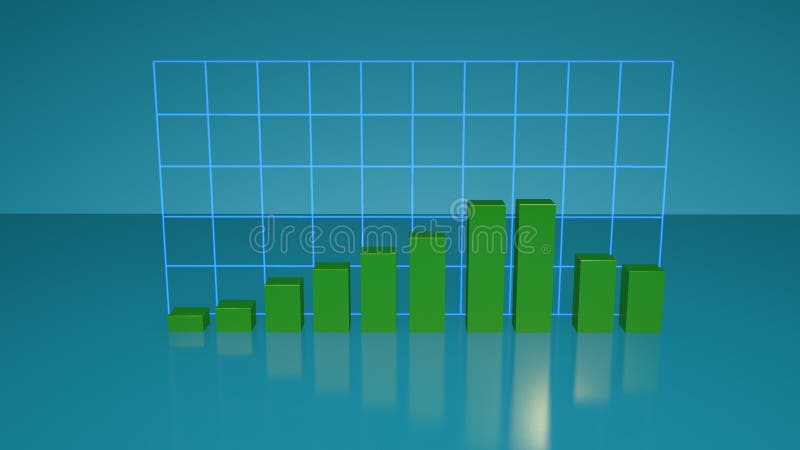
Free with trial Business growth up and down infographics | business graph going down | 3d graph chart decrease infographics - 4k desktop background. Infographics financial growth decrease illustrations Business growth up and down infographics | business graph going down | 3d graph chart decrease infographics. Business growth up and down infographics | business graph going down | 3d graph chart decrease infographics - 4k desktop background
Free with trial Business growth up and down infographics | business graph going down | 3d graph chart decrease infographics - 4k desktop background. Infographics financial growth decrease illustrations Business growth up and down infographics | business graph going down | 3d graph chart decrease infographics. Business growth up and down infographics | business graph going down | 3d graph chart decrease infographics - 4k desktop background
Free with trial Business growth up and down infographics | business graph going down | 3d graph chart decrease infographics - 4k desktop background. Infographics financial growth decrease illustrations Business growth up and down infographics | business graph going down | 3d graph chart decrease infographics. Business growth up and down infographics | business graph going down | 3d graph chart decrease infographics - 4k desktop background
Free with trial Set line Target Pyramid chart infographics Financial growth decrease Arrow Hierarchy organogram and Percent up arrow icon. Vector. Infographics financial growth decrease illustrations Set line Target, Pyramid chart infographics, Financial growth decrease, Arrow, Hierarchy organogram and Percent up arrow
Free with trial Business growth up and down infographics | business graph going down | 3d graph chart decrease infographics - 4k desktop background. Infographics financial growth decrease illustrations Business growth up and down infographics | business graph going down | 3d graph chart decrease infographics. Business growth up and down infographics | business graph going down | 3d graph chart decrease infographics - 4k desktop background
Free with trial Set line Pyramid chart infographics, Clock, Location and Financial growth decrease icon. Vector. Infographics financial growth decrease illustrations Set line Pyramid chart infographics, Clock, Location and Financial growth decrease icon. Vector
Free with trial Badge red arrow on computer monitor. Infographics concept for presentation or financial report. Increase and decrease of indicators in graphic diagram. Infographics financial growth decrease illustrations Badge red arrow on computer monitor. Infographics concept for presentation or financial report. Increase and decrease
Free with trial Set Pyramid chart infographics Shopping bag with Sale Percent up arrow Financial growth decrease Graph chart diagram Clock Dollar symbol and Pie icon. Vector. Infographics financial growth decrease illustrations Set Pyramid chart infographics, Shopping bag with Sale, Percent up arrow, Financial growth decrease, Graph, chart. Set Pyramid chart infographics Shopping bag with Sale Percent up arrow Financial growth decrease Graph chart diagram Clock Dollar symbol and Pie icon. Vector.
Free with trial Set Factory Financial growth decrease Pyramid chart infographics Graph chart diagram Arrow Pie Digital speed meter and increase icon. Vector. Infographics financial growth decrease illustrations Set Factory, Financial growth decrease, Pyramid chart infographics, Graph, chart, diagram, Arrow, Pie, Digital speed. Set Factory Financial growth decrease Pyramid chart infographics Graph chart diagram Arrow Pie Digital speed meter and increase icon. Vector.
Free with trial Set Financial growth decrease Pie chart infographic Graph chart diagram Location Pyramid infographics and icon. Vector. Infographics financial growth decrease vectors Set Financial growth decrease, Pie chart infographic, Graph, chart, diagram, Location, Pyramid infographics, and icon
Free with trial Set Many ways directional arrow Financial growth decrease Project team base Arrow and Pyramid chart infographics icon. Vector. Infographics financial growth decrease vectors Set Many ways directional arrow, Financial growth decrease, Project team base, Arrow, and Pyramid chart infographics
Free with trial Set line Financial growth decrease Many ways directional arrow Pyramid chart infographics Delivery tracking Arrow Graph chart diagram Intersection point and icon. Vector. Infographics financial growth decrease vectors Set line Financial growth decrease, Many ways directional arrow, Pyramid chart infographics, Delivery tracking, Arrow. Set line Financial growth decrease Many ways directional arrow Pyramid chart infographics Delivery tracking Arrow Graph chart diagram Intersection point and icon. Vector.
Free with trial Set line Pie chart infographic Dollar symbol Financial growth increase Arrow Pyramid infographics Clock and decrease icon. Vector. Infographics financial growth decrease vectors Set line Pie chart infographic, Dollar symbol, Financial growth increase, Arrow, Pyramid infographics, Clock and. Set line Pie chart infographic Dollar symbol Financial growth increase Arrow Pyramid infographics Clock and decrease icon. Vector.
Free with trial Set line Financial growth decrease Graph chart diagram Digital speed meter Pyramid infographics Arrow and icon. Vector. Infographics financial growth decrease vectors Set line Financial growth decrease, Graph, chart, diagram, Digital speed meter, Pyramid infographics, Arrow and icon
Free with trial Set line Pie chart infographic Financial growth decrease Project team base Factory Arrow Pyramid infographics Hierarchy organogram and icon. Vector. Infographics financial growth decrease vectors Set line Pie chart infographic, Financial growth decrease, Project team base, Factory, Arrow, Pyramid infographics. Set line Pie chart infographic Financial growth decrease Project team base Factory Arrow Pyramid infographics Hierarchy organogram and icon. Vector.
Free with trial Business growth up and down infographics | business graph going down | 3d graph chart decrease infographics - 4k desktop background. Infographics financial growth decrease illustrations Business growth up and down infographics | business graph going down | 3d graph chart decrease infographics. Business growth up and down infographics | business graph going down | 3d graph chart decrease infographics - 4k desktop background
Free with trial Business growth up and down infographics | business graph going down | 3d graph chart decrease infographics - 4k desktop background. Infographics financial growth decrease illustrations Business growth up and down infographics | business graph going down | 3d graph chart decrease infographics. Business growth up and down infographics | business graph going down | 3d graph chart decrease infographics - 4k desktop background
Free with trial Set line Pyramid chart infographics Financial growth decrease Digital speed meter Dollar symbol Arrow Many ways directional arrow and icon. Vector. Infographics financial growth decrease vectors Set line Pyramid chart infographics, Financial growth, decrease, Digital speed meter, Dollar symbol, Arrow, Many ways. Set line Pyramid chart infographics Financial growth decrease Digital speed meter Dollar symbol Arrow Many ways directional arrow and icon. Vector.
Free with trial Set line Arrow Clock Pie chart infographic Shopping bag with Sale Financial growth decrease Pyramid infographics and Infographic element icon. Vector. Infographics financial growth decrease vectors Set line Arrow, Clock, Pie chart infographic, Shopping bag with Sale, Financial growth decrease, Pyramid infographics. Set line Arrow Clock Pie chart infographic Shopping bag with Sale Financial growth decrease Pyramid infographics and Infographic element icon. Vector.
Free with trial Set Pyramid chart infographics Dollar symbol Arrow Wrench and gear Financial growth increase Shopping bag with Sale Target and decrease icon. Vector. Infographics financial growth decrease vectors Set Pyramid chart infographics, Dollar symbol, Arrow, Wrench and gear, Financial growth increase, Shopping bag with Sale. Set Pyramid chart infographics Dollar symbol Arrow Wrench and gear Financial growth increase Shopping bag with Sale Target and decrease icon. Vector.
Free with trial Set Digital speed meter Pie chart infographic Pyramid infographics Financial growth decrease Mountains with flag and Arrow icon. Vector. Infographics financial growth decrease vectors Set Digital speed meter, Pie chart infographic, Pyramid infographics, Financial growth decrease, Mountains with flag. Set Digital speed meter Pie chart infographic Pyramid infographics Financial growth decrease Mountains with flag and Arrow icon. Vector.
Free with trial Set line Arrow Flag Clock Financial growth decrease Pyramid chart infographics Graph chart diagram and Intersection point icon. Vector. Infographics financial growth decrease illustrations Set line Arrow, Flag, Clock, Financial growth decrease, Pyramid chart infographics, Graph, chart, diagram and. Set line Arrow Flag Clock Financial growth decrease Pyramid chart infographics Graph chart diagram and Intersection point icon. Vector.
Free with trial Set line Arrow Flag Clock Financial growth decrease Pyramid chart infographics Graph chart diagram and Intersection point icon. Vector. Infographics financial growth decrease vectors Set line Arrow, Flag, Clock, Financial growth decrease, Pyramid chart infographics, Graph, chart, diagram and. Set line Arrow Flag Clock Financial growth decrease Pyramid chart infographics Graph chart diagram and Intersection point icon. Vector.
Free with trial Vector badge red arrow on computer monitor. Infographics concept for presentation or financial report. Increase and decrease of indicators in graphic diagram. Infographics financial growth decrease vectors Vector badge red arrow on computer monitor. Infographics concept for presentation or financial report. Increase and
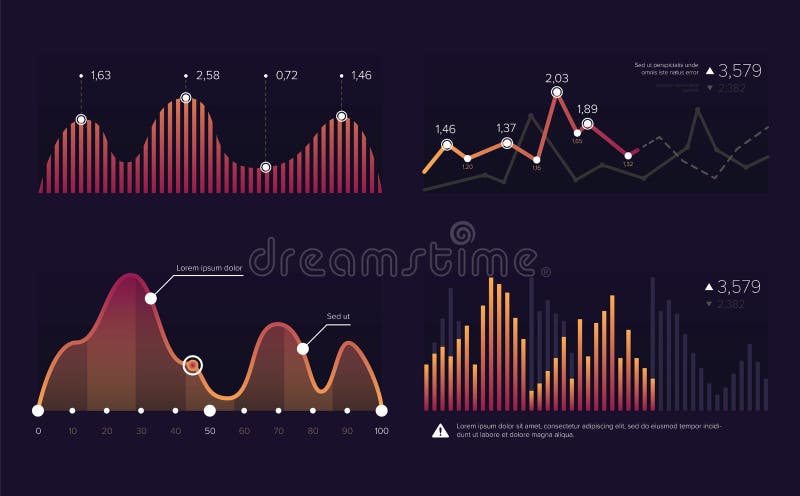
Free with trial Image charts and diagrams for presentation or financial report. Infographics concept. Increase and decrease of indicators in graphic diagram. Colorful illustration illustration. Infographics financial growth decrease illustrations Image charts and diagrams for presentation or financial report. Infographics concept.Increase and decrease of
Free with trial Set line Many ways directional arrow Digital speed meter Shopping bag with Sale Financial growth decrease Graph chart diagram Pyramid infographics Intersection point and Arrow icon. Vector. Infographics financial growth decrease illustrations Set line Many ways directional arrow, Digital speed meter, Shopping bag with Sale, Financial growth decrease, Graph. Set line Many ways directional arrow Digital speed meter Shopping bag with Sale Financial growth decrease Graph chart diagram Pyramid infographics Intersection point and Arrow icon. Vector.
Free with trial Set line Many ways directional arrow Digital speed meter Shopping bag with Sale Financial growth decrease Graph chart diagram Pyramid infographics Intersection point and Arrow icon. Vector. Infographics financial growth decrease vectors Set line Many ways directional arrow, Digital speed meter, Shopping bag with Sale, Financial growth decrease, Graph. Set line Many ways directional arrow Digital speed meter Shopping bag with Sale Financial growth decrease Graph chart diagram Pyramid infographics Intersection point and Arrow icon. Vector.
Free with trial Set line Flag Project team base Mountains with flag Pie chart infographic Arrow Financial growth decrease Wrench and gear and Pyramid infographics icon. Vector. Infographics financial growth decrease illustrations Set line Flag, Project team base, Mountains with flag, Pie chart infographic, Arrow, Financial growth decrease, Wrench. Set line Flag Project team base Mountains with flag Pie chart infographic Arrow Financial growth decrease Wrench and gear and Pyramid infographics icon. Vector.
Free with trial Set line Flag Graph chart diagram Delivery tracking Pyramid infographics Financial growth Project team base and decrease icon. Vector. Infographics financial growth decrease vectors Set line Flag, Graph, chart, diagram, Delivery tracking, Pyramid infographics, Financial growth, Project team base and. Set line Flag Graph chart diagram Delivery tracking Pyramid infographics Financial growth Project team base and decrease icon. Vector.
Free with trial Set Financial growth decrease Hierarchy organogram chart Old hourglass with sand Delivery tracking Graph diagram Pyramid infographics Target and Many ways directional arrow icon. Vector. Infographics financial growth decrease vectors Set Financial growth decrease, Hierarchy organogram chart, Old hourglass with sand, Delivery tracking, Graph, diagram. Set Financial growth decrease Hierarchy organogram chart Old hourglass with sand Delivery tracking Graph diagram Pyramid infographics Target and Many ways directional arrow icon. Vector.
Free with trial Set Flag Arrow Old hourglass with sand Unknown search Financial growth decrease Pie chart infographic and Pyramid infographics icon. Vector. Infographics financial growth decrease illustrations Set Flag, Arrow, Old hourglass with sand, Unknown search, Financial growth decrease, Pie chart infographic and Pyramid. Set Flag Arrow Old hourglass with sand Unknown search Financial growth decrease Pie chart infographic and Pyramid infographics icon. Vector.
Free with trial Increase Growth and Decrease Reduction Curve Chart. Business Finance Chart and Graph Infographic Solid Glyph Vector Illustration Icon Set. Infographics financial growth decrease vectors Increase Growth and Decrease Reduction Curve Chart. Business Finance Chart and Graph Infographic Solid Glyph Vector Illustration
Free with trial Increase Growth and Decrease Reduction Curve Chart. Business Finance Chart and Graph Infographic Sticker Vector Illustration Icon Set. Infographics financial growth decrease vectors Increase Growth and Decrease Reduction Curve Chart. Business Finance Chart and Graph Infographic Sticker Vector Illustration Icon
Free with trial Infographics business graphics charts arrow. Financial analysis data graphs and diagram, marketing statistic modern business presentation elements vector investment progress icon set. Infographics financial growth decrease vectors Infographics arrow, Arrow Business, Financial analysis data graphic object elemeent arrow profit. Infographics business graphics charts arrow. Financial analysis data graphs and diagram, marketing statistic modern business presentation elements vector investment progress icon set.
Free with trial Set line Factory Clock Arrow Graph chart diagram Pyramid infographics Many ways directional arrow Financial growth decrease and Pie icon. Vector. Infographics financial growth decrease vectors Set line Factory, Clock, Arrow, Graph, chart, diagram, Pyramid infographics, Many ways directional arrow, Financial. Set line Factory Clock Arrow Graph chart diagram Pyramid infographics Many ways directional arrow Financial growth decrease and Pie icon. Vector.
Free with trial Graph of growth up and falling down icon, infographics, sticker, poster. sketch hand drawn doodle style. vector minimalism monochrome. business, goal, report, success, failure. Infographics financial growth decrease illustrations Graph of growth up and falling down icon, infographics, sticker, poster. sketch hand drawn doodle style. vector minimalism
Free with trial Graph of growth up and falling down icon, infographics, sticker, poster. sketch hand drawn doodle style. minimalism monochrome. business, goal, report, success, failure. Infographics financial growth decrease illustrations Graph of growth up and falling down icon, infographics, sticker, poster. sketch hand drawn doodle style. minimalism
Free with trial Business data of the currency rate chart and economics decrease and growth. Infographics with world statistics, global data showing analytical information. Infographics financial growth decrease illustrations Business data of the currency rate chart and economics decrease and growth. Animation. Infographics with world. Business data of the currency rate chart and economics decrease and growth. Infographics with world statistics, global data showing analytical information.
Free with trial Agent, 24 hours and Payment received signs. Infographics timeline. Growth chart, Diagram graph and Web report line icons set. Diagram graph, Presentation chart, Business person. Time. Vector. Infographics financial growth decrease vectors Growth chart, Diagram graph and Web report icons set. Agent, 24 hours and Payment received signs. Vector. Agent, 24 hours and Payment received signs. Infographics timeline. Growth chart, Diagram graph and Web report line icons set. Diagram graph, Presentation chart, Business person. Time. Vector
Free with trial Concept of financial crisis or economic impact, graphic of colourful dominos as business infographics. Infographics financial growth decrease vectors DominosBusiness. concept of financial crisis or economic impact, graphic of colourful dominos as business infographics
Free with trial Blue stock market or financial chart with a declining trend. On a white background - vector. Infographics financial growth decrease vectors Blue stock market or financial chart with a declining trend. On a white background, vector
Free with trial Bitcoin and chart bull run icon growth, cryptocurrency background money, raster template. Infographics financial growth decrease vectors Bitcoin and chart bull run icon growth, cryptocurrency background money blank. Bitcoin and chart bull run icon growth, cryptocurrency background money, raster template
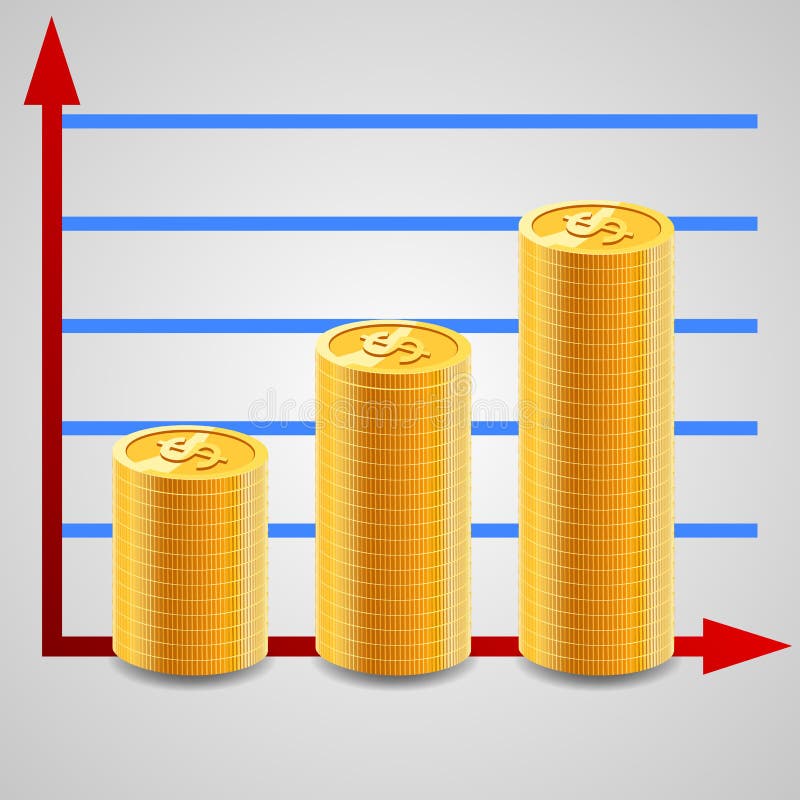
Free with trial Increasing piles of coins with going up graph. Concept for financial growth. illustration. Infographics financial growth decrease vectors Increasing piles of coins with going up graph.
Free with trial Decrease 3d rendering isometric icon uploading. Infographics financial growth decrease vectors Decrease 3d rendering isometric icon. Decrease 3d rendering isometric icon uploading.
Free with trial Vector business, statistical, or economic infographic icon of random percentage increase and decrease. Glass columns in red color isolated on a white background. Infographics financial growth decrease vectors Infographic illustration of histogram. Seven glass columns with red liquid characterizing percentage increase or decrease. Vector business, statistical, or economic infographic icon of random percentage increase and decrease. Glass columns in red color isolated on a white background.
Free with trial Dot plot, Air balloon and Pyramid chart icons simple set. Infographic timeline. Financial documents sign. Presentation graph, Sky travelling, Report analysis. Check docs. Education set. Vector. Infographics financial growth decrease vectors Dot plot, Air balloon and Pyramid chart icons set. Financial documents sign. Vector. Dot plot, Air balloon and Pyramid chart icons simple set. Infographic timeline. Financial documents sign. Presentation graph, Sky travelling, Report analysis. Check docs. Education set. Vector
Free with trial Face id, Financial diagram and Chemistry lab line icons set. Infographic timeline. Augmented reality, Face verified and Pyramid chart signs. Vector. Infographics financial growth decrease vectors Face id, Financial diagram and Chemistry lab icons set. Vector. Face id, Financial diagram and Chemistry lab line icons set. Infographic timeline. Augmented reality, Face verified and Pyramid chart signs. Vector
Free with trial Loan percent, Report document and Graph laptop icons simple set. Infographic timeline. Hot loan sign. Discount, Growth chart, Mobile report. Discount offer. Finance set. Cycle infographic. Vector. Infographics financial growth decrease vectors Loan percent, Report document and Graph laptop icons set. Hot loan sign. Discount, Growth chart, Mobile report. Vector. Loan percent, Report document and Graph laptop icons simple set. Infographic timeline. Hot loan sign. Discount, Growth chart, Mobile report. Discount offer. Finance set. Cycle infographic. Vector
Free with trial Wallet, Pie chart and Report timer icons simple set. Infographic timeline. Histogram sign. Affordability, 3d graph, Growth chart. Economic trend. Finance set. Cycle infographic. Vector. Infographics financial growth decrease vectors Wallet, Pie chart and Report timer icons set. Histogram sign. Affordability, 3d graph, Growth chart. Vector. Wallet, Pie chart and Report timer icons simple set. Infographic timeline. Histogram sign. Affordability, 3d graph, Growth chart. Economic trend. Finance set. Cycle infographic. Vector
Free with trial Confirmed, Love mail and Growth chart icons simple set. Infographic timeline. Graph chart sign. Accepted message, Valentines letter, Upper arrows. Growth report. Education set. Vector. Infographics financial growth decrease vectors Confirmed, Love mail and Growth chart icons set. Graph chart sign. Vector. Confirmed, Love mail and Growth chart icons simple set. Infographic timeline. Graph chart sign. Accepted message, Valentines letter, Upper arrows. Growth report. Education set. Vector
Free with trial Columns arrows graph. infographic for marketing design. Financial concept. Vector illustration. stock image. EPS 10. Infographics financial growth decrease vectors Columns arrows graph. infographic for marketing design. Financial concept. Vector illustration. stock image.
Free with trial Currency, Growth chart and Pie chart line icons set. Infographic timeline. Loan percent, Payment methods and Update data signs. Euro and usd, Upper arrows, Presentation graph. Piggy bank. Vector. Infographics financial growth decrease vectors Currency, Growth chart and Pie chart icons set. Loan percent, Payment methods and Update data signs. Vector. Currency, Growth chart and Pie chart line icons set. Infographic timeline. Loan percent, Payment methods and Update data signs. Euro and usd, Upper arrows, Presentation graph. Piggy bank. Vector
Free with trial Calendar, Report diagram and Presentation board icons simple set. Infographic timeline. Smartphone statistics sign. Event reminder, Financial market, Growth chart. Mobile business. Vector. Infographics financial growth decrease vectors Calendar, Report diagram and Presentation board icons set. Smartphone statistics sign. Vector. Calendar, Report diagram and Presentation board icons simple set. Infographic timeline. Smartphone statistics sign. Event reminder, Financial market, Growth chart. Mobile business. Vector
Free with trial Calculator target, Report document and Financial diagram icons simple set. Infographic timeline. Creative painting sign. Audit, Growth chart, Candlestick chart. Graphic art. Education set. Vector. Infographics financial growth decrease vectors Calculator target, Report document and Financial diagram icons set. Creative painting sign. Vector. Calculator target, Report document and Financial diagram icons simple set. Infographic timeline. Creative painting sign. Audit, Growth chart, Candlestick chart. Graphic art. Education set. Vector
Free with trial Help, cash out, debt, finance, loan Infographics Template for Website and Presentation. Line Blue icon infographic style vector illustration. Vector EPS10 Abstract Template background. Infographics financial growth decrease vectors Help, cash out, debt, finance, loan Infographics Template for Website and Presentation. Line Blue icon infographic style vector
Free with trial Modern timeline candles are moving down with no resistance. 12 month financial statistics graph with business calendar Fear of down markets and down trends. Infographics financial growth decrease vectors Modern timeline candles are moving down with no resistance
Free with trial Report document, Flight sale and Line chart icons simple set. Infographic timeline. Bitcoin sign. Growth chart, Travel discount, Financial graph. Cryptocurrency coin. Finance set. Vector. Infographics financial growth decrease vectors Report document, Flight sale and Line chart icons set. Bitcoin sign. Vector. Report document, Flight sale and Line chart icons simple set. Infographic timeline. Bitcoin sign. Growth chart, Travel discount, Financial graph. Cryptocurrency coin. Finance set. Vector
Free with trial Vector business or statistical yellow icon of two glass columns with max column – growth and min column – reduction. Vector statistical illustration is isolated on a white background. Infographics financial growth decrease vectors Infographic illustration of histogram. Two glass columns with yellow liquid characterizing percentage maximum and minimum. Vector business or statistical yellow icon of two glass columns with max column – growth and min column – reduction. Vector statistical illustration is isolated on a white background.
Free with trial Hot loan, Download arrow and Usd coins signs. Infographic timeline. Web traffic, Loan percent and Line chart line icons set. Website window, Discount, Financial graph. Discount offer. Vector. Infographics financial growth decrease vectors Web traffic, Loan percent and Line chart icons set. Hot loan, Download arrow and Usd coins signs. Vector. Hot loan, Download arrow and Usd coins signs. Infographic timeline. Web traffic, Loan percent and Line chart line icons set. Website window, Discount, Financial graph. Discount offer. Vector
Free with trial Increase Cost icon. Simple line element symbol for templates, web design and infographics. Infographics financial growth decrease vectors Increase Cost icon. Line simple icon for templates, web design and infographics. Increase Cost icon. Simple line element symbol for templates, web design and infographics.
Free with trial Vector icon of percentage increase and decrease. Glass columns in blue color isolated on white. Infographics financial growth decrease vectors Vector statistical illustration of histogram. Glass columns with blue liquid characterizing the normal distribution or Gaussian di. Vector icon of percentage increase and decrease. Glass columns in blue color isolated on white.