Free with trial An abstract red financial graph dramatically illustrates an economic downturn or stock market volatility against a rugged, textured wall. This powerful graphic symbolizes financial crisis, loss, and recession with a prominent downward trend. Perfect for illustrating concepts of risk, falling stock, and bearish markets, this image is ideal for financial reports, business presentations, and articles. Investment decrease illustrations Abstract red financial graph depicting economic downturn or stock market volatility on a textured wall. An abstract red financial graph dramatically illustrates. An abstract red financial graph dramatically illustrates an economic downturn or stock market volatility against a rugged, textured wall. This powerful graphic symbolizes financial crisis, loss, and recession with a prominent downward trend. Perfect for illustrating concepts of risk, falling stock, and bearish markets, this image is ideal for financial reports, business presentations, and articles
Free with trial Businesswoman pushing cracked financial bar chart for economy recession and bankruptcy concept illustration clip art. Investment decrease vectors Businesswoman Pushing Cracked Financial Bar Chart for Economy Recession and Bankruptcy Concept Illustration. Clip art. Businesswoman pushing cracked financial bar chart for economy recession and bankruptcy concept illustration clip art
Free with trial Percentage arrow up and down line icon. Percentage arrow with percent sign. Design concept for banking, credit, interest rate, finance and money sphere. Investment decrease vectors Percentage arrow up and down line icon. Percentage arrow with percent sign.Vector illustration. Percentage arrow up and down line icon. Percentage arrow with. Percentage arrow up and down line icon. Percentage arrow with percent sign. Design concept for banking, credit, interest rate, finance and money sphere
Free with trial Depreciation, businessman disappeared as the value of the dollar decreased and the coins dissolved. Investment decrease vectors Depreciation, businessman disappeared as the value of the dollar decreased and the coins dissolved.
Free with trial A close-up of a laptop with a glowing red keyboard, showcasing a downward-trending data chart on the screen, evoking themes of market downturn and analytical insight. Investment decrease illustrations Red financial graph displayed on laptop screen with red backlit keyboard indicating stock market decline or data analysis in. A close-up of a laptop with a. A close-up of a laptop with a glowing red keyboard, showcasing a downward-trending data chart on the screen, evoking themes of market downturn and analytical insight
Free with trial House in supermarket trolley and green arrow down. Falling housing prices concept. Unprofitability of investments and price fall in the real estate market. Lowering demand, construction rates and tren. Investment decrease illustrations House in supermarket trolley and green arrow down. Falling housing prices concept. Unprofitability of investments and price fall. In the real estate market. House in supermarket trolley and green arrow down. Falling housing prices concept. Unprofitability of investments and price fall in the real estate market. Lowering demand, construction rates and tren
Free with trial This image features a conceptual bar graph, illustrating contrasting trends of growth and decline in business performance, ideal for data analysis presentations. Investment decrease illustrations Growth and Decline: Conceptual Bar Graph Illustrating Positive and Negative Trends in Business Performance Data Visualization. This image features a conceptual. This image features a conceptual bar graph, illustrating contrasting trends of growth and decline in business performance, ideal for data analysis presentations
Free with trial This image features colorful 3D bar graphs representing both growth and decline trends, ideal for business analytics and financial performance visualizations. Investment decrease illustrations Colorful 3D Bar Graphs Displaying Growth and Decline Trends in Business Analytics and Financial Performance on a Clean White. This image features colorful 3D bar. This image features colorful 3D bar graphs representing both growth and decline trends, ideal for business analytics and financial performance visualizations
Free with trial Golden bear statue on wall street in financial district - bear market recession concept. Generative AI. Investment decrease illustrations Golden bear statue on wall street in financial district - bear market recession concept. Generative AI
Free with trial The image of the percentage signs in a three-dimensional 3D style. Vector illustration. Investment decrease vectors The image of the percentage signs in a three-dimensional 3D style. Vector illustration
Free with trial A 3D rendered figure slumped over a declining stock market graph representing financial hardship and economic downturn. Investment decrease illustrations Depressed Figure Examining a Declining Stock Market Graph Financial Crisis Concept. A 3D rendered figure slumped over a declining stock market graph representing. A 3D rendered figure slumped over a declining stock market graph representing financial hardship and economic downturn
Free with trial This abstract data visualization features smooth blue waves representing trends and fluctuations, ideal for business reports, finance presentations, and analytical insights. Investment decrease illustrations Abstract Blue Data Visualization Depicting Trends and Fluctuations in Graphical Format for Business and Finance Presentations. This abstract data visualization. This abstract data visualization features smooth blue waves representing trends and fluctuations, ideal for business reports, finance presentations, and analytical insights
Free with trial Stock market icons. Set of 15 stock market trendy minimal icons. Bear, Bull, market analysis, Stock Exchange icon. Design signs for web page, mobile app, packaging design. Vector illustration. Investment decrease vectors Stock market icons set. Stock market icons. Set of 15 stock market trendy minimal icons. Bear, Bull, market analysis, Stock Exchange icon. Design signs for web. Stock market icons. Set of 15 stock market trendy minimal icons. Bear, Bull, market analysis, Stock Exchange icon. Design signs for web page, mobile app, packaging design. Vector illustration.
Free with trial A 3D rendered figure slumped over a declining stock market graph representing financial hardship and economic downturn. Investment decrease illustrations Depressed Figure Examining a Declining Stock Market Graph Financial Crisis Concept. A 3D rendered figure slumped over a declining stock market graph representing. A 3D rendered figure slumped over a declining stock market graph representing financial hardship and economic downturn
Free with trial Falling red arrow illustrating financial downturn on dark grid stock market economic crisis graph Vector illustration for high-quality printing. Investment decrease illustrations Falling red arrow illustrating financial downturn on dark grid , stock market, economic crisis, graph. Falling red arrow illustrating financial downturn on dark. Falling red arrow illustrating financial downturn on dark grid stock market economic crisis graph Vector illustration for high-quality printing
Free with trial Stylized illustration of houses with a large orange downward arrow, suggesting a decline in the real estate market. Generative AI. Investment decrease illustrations Stylized illustration of houses with a large orange downward arrow, suggesting a decline in the real estate market. Generative AI
Free with trial Financial Market Data, Red Stock Chart Lines over a Cityscape at Night, Business and Finance Concept, Generated by AI. Investment decrease illustrations Financial Market Data, Red Stock Chart Lines over a Cityscape at Night, Business and Finance Concept. Generated by AI
Free with trial A layered arrangement of dark wooden blocks displaying decreasing red and tan bars, with a downward arrow illustrating a downturn in financial or market performance. Investment decrease illustrations Stacked black wooden cubes with red and tan descending bar charts and downward arrow symbolizing financial or business decline. A layered arrangement of dark. A layered arrangement of dark wooden blocks displaying decreasing red and tan bars, with a downward arrow illustrating a downturn in financial or market performance
Free with trial Data analytics descending line graphic outline icon in white and black colors. data analytics descending line graphic flat vector icon from business collection for web, mobile apps and ui. Investment decrease vectors Data analytics descending line graphic outline icon in white and black colors. data analytics descending line graphic flat vector. Icon from business collection. data analytics descending line graphic outline icon in white and black colors. data analytics descending line graphic flat vector icon from business collection for web, mobile apps and ui.
Free with trial Vector illustration of a graph with a downward arrow, representing decline or negative growth. Investment decrease vectors Professional Graph with Arrow Down Outline Icon Vector Illustration. Vector illustration of a graph with a downward arrow, representing decline or negative. Vector illustration of a graph with a downward arrow, representing decline or negative growth.
Free with trial Red COST label on circular tag rests on wooden surface, chalkboard background. Generative AI. Investment decrease illustrations Red COST label on circular tag rests on wooden surface, chalkboard background. Generative AI
Free with trial Illustration of a businessman falling along a downward red arrow symbolizing economic recession. Represents financial loss, business downturn, and market challenges with bold graphic style and dynamic colors. Investment decrease illustrations Abstract businessman falling with red downward trend arrow. Illustration of a businessman falling along a downward red arrow symbolizing economic recession. Illustration of a businessman falling along a downward red arrow symbolizing economic recession. Represents financial loss, business downturn, and market challenges with bold graphic style and dynamic colors
Free with trial Red arrow going down stock with dollar coin on white background. Bankruptcy, financial market crash icon for your web site design, logo, app, UI. graph chart downtrend symbol. chart going down sign. Investment decrease vectors Red arrow going down stock with dollar coin on white background. Bankruptcy, financial market crash icon for your web site. Design, logo, app, UI. graph chart. Red arrow going down stock with dollar coin on white background. Bankruptcy, financial market crash icon for your web site design, logo, app, UI. graph chart downtrend symbol.chart going down sign.
Free with trial Bar graph descends on blue background 3d render. Visualizes negative trend, economic downfall, failure, crisis, statistics, market analysis, budget deficit, bankruptcy. Perfect for marketing finance. Investment decrease illustrations Bar graph descends on blue background 3d render. Visualizes negative trend, economic downfall, failure, crisis, statistics, market. Analysis, budget deficit. Bar graph descends on blue background 3d render. Visualizes negative trend, economic downfall, failure, crisis, statistics, market analysis, budget deficit, bankruptcy. Perfect for marketing finance
Free with trial Dramatic illustration of red percent sign engulfed in flames on dark, textured background. Fiery symbol represents hot deals, significant discounts, urgent sales promotions in finance. Investment decrease illustrations Dramatic illustration of red percent sign engulfed in flames on dark, textured background. Fiery symbol represents hot deals,. Significant discounts, urgent. Dramatic illustration of red percent sign engulfed in flames on dark, textured background. Fiery symbol represents hot deals, significant discounts, urgent sales promotions in finance.
Free with trial Housing recession concept. Wooden houses floating in water market decline, real estate crisis, financial instability. Bubble effect. Property value decrease, economic downturn, mortgage. Investment decrease illustrations Housing recession concept. Wooden houses floating in water market decline, real estate crisis, financial instability. Bubble. Effect. Property value decrease. Housing recession concept. Wooden houses floating in water market decline, real estate crisis, financial instability. Bubble effect. Property value decrease, economic downturn, mortgage.
Free with trial Business and financial concept. Bar graph with upper and lower arrows to show low cost and high quality on black background. Investment decrease vectors Business and financial concept. Bar graph with upper and lower arrow to show low cost and high quality on black background. Business and financial concept. Bar. Business and financial concept. Bar graph with upper and lower arrows to show low cost and high quality on black background
Free with trial This vibrant bar graph showcases varying heights for data visualization, perfect for representing trends in finance or business analysis against a clean white background. Investment decrease illustrations Colorful Bar Graph with Varying Heights Representing Data Trends and Insights in a Minimalist Art Style on White Background. This vibrant bar graph showcases. This vibrant bar graph showcases varying heights for data visualization, perfect for representing trends in finance or business analysis against a clean white background
Free with trial Red arrow pointing down overlaying globe icon showing global economic crisis. Red arrow trending down against blue globe icon representing global economic crisis. Investment decrease vectors Red arrow pointing down overlaying globe icon showing global economic crisis. Red arrow trending down against blue globe icon representing global economic crisis
Free with trial Icon of a house with arrows indicating value adjustment. Investment decrease vectors Icon of a house with arrows indicating value adjustment.
Free with trial Futuristic Orb Displaying Percentage Symbol with Glowing Network Connections, Modern Finance Concept Design with Sleek Base. AI generated. Investment decrease illustrations Futuristic Orb Displaying Percentage Symbol with Glowing Network Connections, Modern Finance Concept Design with Sleek Base. AI generated
Free with trial Vector illustration stack coin arrow downup trend. Vector illustration stacked coins and arrow trending down, decreasing statistical graphic concept. Investment decrease vectors Vector illustration stack coin arrow downup trend. Vector illustration stacked coins and arrow trending down, decreasing statistical graphic concept
Free with trial Dynamic stock market chart illuminates dark trading room reflects financial volatility. Red line graph shows fluctuations. Trader analyzes data on multiple screens. Global financial. Investment decrease illustrations Dynamic stock market chart illuminates dark trading room, reflects financial volatility. Red line graph shows fluctuations. Dynamic stock market chart. Dynamic stock market chart illuminates dark trading room reflects financial volatility. Red line graph shows fluctuations. Trader analyzes data on multiple screens. Global financial.
Free with trial Growth and decline. Business chart icon. Profit loss symbol. Vector illustration. EPS 10. Investment decrease vectors Growth and decline. Business chart icon. Profit loss symbol. Vector illustration. EPS 10
Free with trial Percentage sign with downward red and white arrows, financial decline,. Economic downturn, minimalist design, dark background, 3D render, market crash. Investment decrease illustrations Percentage sign with downward red and white arrows, financial decline,. Economic downturn, minimalist design, dark background, 3D render, market crash
Free with trial Percentage sign with downward red and white arrows, financial decline,. Economic downturn, minimalist design, dark background, 3D render, market crash. Investment decrease illustrations Percentage sign with downward red and white arrows, financial decline,. Economic downturn, minimalist design, dark background, 3D render, market crash
Free with trial Percentage sign with downward red and white arrows, financial decline,. Economic downturn, minimalist design, dark background, 3D render, market crash. Investment decrease illustrations Percentage sign with downward red and white arrows, financial decline,. Economic downturn, minimalist design, dark background, 3D render, market crash
Free with trial Percentage sign with downward red and white arrows, financial decline,. Economic downturn, minimalist design, dark background, 3D render, market crash. Investment decrease illustrations Percentage sign with downward red and white arrows, financial decline,. Economic downturn, minimalist design, dark background, 3D render, market crash
Free with trial Up and down percent outline icon on circle line. Lower and higher price arrow sign symbol. Vector. Investment decrease vectors Up and down percent outline icon on circle line. Lower and higher price arrow sign symbol. Vector
Free with trial The "Vector Dollar Up Icon Symbol" is a graphical representation designed to indicate an increase or upward trend related to financial aspects, specifically involving currency or value. Investment decrease vectors Vector Dollar Up Icon Symbol. The 'Vector Dollar Up Icon Symbol' is a graphical representation designed to indicate an increase or upward trend related to. The "Vector Dollar Up Icon Symbol" is a graphical representation designed to indicate an increase or upward trend related to financial aspects, specifically involving currency or value.
Free with trial A chart with a red arrow pointing downward, isolated on a white background, representing financial decline or a negative trend. Investment decrease illustrations Decreasing chart with red arrow isolated on white background. A chart with a red arrow pointing downward, isolated on a white background, representing financial. A chart with a red arrow pointing downward, isolated on a white background, representing financial decline or a negative trend
Free with trial Miniature shopping cart with red upward trending arrow declining retail sales, negative economic trends. Conceptual image represents falling consumer spending, market downturn financial. Investment decrease illustrations Miniature shopping cart with red upward trending arrow declining retail sales, negative economic trends. Conceptual image. Represents falling consumer spending. Miniature shopping cart with red upward trending arrow declining retail sales, negative economic trends. Conceptual image represents falling consumer spending, market downturn financial.
Free with trial 3D collage trend artwork composite poster of young man run hand hold hammer attack broke coins bankruptcy investor inflation economy forex. Investment decrease illustrations 3D collage trend artwork composite poster of young man run hand hold hammer attack broke coins bankruptcy investor. Inflation economy forex
Free with trial Sad businesswoman on stock index chart falling and investor finance loss banner. Stressed business woman on exchange market trading decreasing data fall down graph. Bankruptcy concept. Eps. Investment decrease vectors Sad businesswoman on stock index chart falling and investor finance loss banner. Stressed business woman on exchange. Market trading decreasing data fall down. Sad businesswoman on stock index chart falling and investor finance loss banner. Stressed business woman on exchange market trading decreasing data fall down graph. Bankruptcy concept. Eps
Free with trial Upward and downward arrow icon set on black circle. Up and down illustration. Investment decrease vectors Upward and downward arrow icon set on black circle. Up and down illustration
Free with trial Economic crisis and recession. Board 2026 with a downward arrow and money with piggy bank. Bankruptcy and financial crisis. Analysis and analytics. Capital outflow, GDP and Forecasting. Investment decrease illustrations Economic crisis and recession. Board 2026 with a downward arrow and money with piggy bank. Bankruptcy and financial crisis. Analysis and analytics. Capital
Free with trial Set line Drop in crude oil price, Tearing money banknote, Global economic crisis and Money bag. Business infographic template. Vector. Investment decrease vectors Set line Drop in crude oil price, Tearing money banknote, Global economic crisis and Money bag. Business infographic. Template. Vector
Free with trial Three-dimensional white percent sign isolated on vibrant red background. Clean, modern icon represents finance, business, sales, discounts, special offers. Perfect for marketing. Investment decrease illustrations Three-dimensional white percent sign isolated on vibrant red background. Clean, modern icon represents finance, business, sales,. Discounts, special offers. Three-dimensional white percent sign isolated on vibrant red background. Clean, modern icon represents finance, business, sales, discounts, special offers. Perfect for marketing.
Free with trial Trend composite sketch template 3D photo collage of salary trade dollars economy young lady burnout arrow down bank credit card inflation. Investment decrease illustrations Trend composite sketch template 3D photo collage of salary trade dollars economy young lady burnout arrow down bank. Credit card inflation
Free with trial Up and down arrow icon set. Upward and downward concept. Upward and downward illustration concept. Investment decrease vectors Up and down arrow icon set. Upward and downward concept. Up and down arrow icon set. Upward and downward illustration concept
Free with trial Uptrend and downtrend arrow line icon on square line. Statistic sign symbol. Illustration. Investment decrease vectors Uptrend and downtrend arrow line icon on square line. Statistic sign symbol. Illustration
Free with trial Description: This abstract image depicts a financial stock market trading chart with a gold arrow pointing downwards on a blue background. The downtrend of the arrow symbolizes a decrease in stock prices or market performance. The contrasting colors and geometric shapes convey a sense of complexity and volatility in the financial market. This image can be used to represent concepts such as market analysis, investment strategies, and economic trends. Investment decrease illustrations Abstract Financial Stock Market Trading Chart with Gold Arrow Downtrend on Blue Background. Description: This abstract image depicts a financial stock market. Description: This abstract image depicts a financial stock market trading chart with a gold arrow pointing downwards on a blue background. The downtrend of the arrow symbolizes a decrease in stock prices or market performance. The contrasting colors and geometric shapes convey a sense of complexity and volatility in the financial market. This image can be used to represent concepts such as market analysis, investment strategies, and economic trends.
Free with trial Glowing red financial chart with percentage symbols, stock market decline concept. Glowing red financial chart with percentage. Investment decrease illustrations Glowing red financial chart with percentage symbols, stock market decline concept. Glowing red financial chart with percentage
Free with trial Dollar arrow growth and decline icon. USD up and down sign symbol. Investment decrease vectors Dollar arrow growth and decline icon. USD up and down sign symbol. Dollar arrow growth and decline icon vector. USD up and down sign symbol
Free with trial A laptop screen showing a stock market crash with a declining red graph, symbolizing financial loss and economic downturn - generated AI. Investment decrease illustrations Stock market crash displayed on laptop screen with red graph. A laptop screen showing a stock market crash with a declining red graph, symbolizing financial loss. A laptop screen showing a stock market crash with a declining red graph, symbolizing financial loss and economic downturn - generated AI
Free with trial Graph going Up and Down with green and red arrows vector. Blue chart bar vector illustration concept of sales bar chart symbol icon with arrow moving down and sales bar chart with arrow moving up. Investment decrease vectors Graph going Up and Down with green and red arrows vector. Blue chart bar vector illustration concept of sales bar chart symbol. Graph going Up and Down with. Graph going Up and Down with green and red arrows vector. Blue chart bar vector illustration concept of sales bar chart symbol icon with arrow moving down and sales bar chart with arrow moving up.
Free with trial The cost of living crisis is significantly impacting households across the globe, with energy bills and home heating costs soaring to unprecedented levels. This escalating financial strain is a major concern for homeowners, forcing them to re-evaluate their budgets and explore ways to manage their household expenses. Rising fuel prices, exacerbated by global economic factors and climate change. Investment decrease illustrations Navigating the Cost of Living Crisis Rising Energy Bills and Home Heating Challenges for Homeowners. The cost of living crisis is significantly impacting. The cost of living crisis is significantly impacting households across the globe, with energy bills and home heating costs soaring to unprecedented levels. This escalating financial strain is a major concern for homeowners, forcing them to re-evaluate their budgets and explore ways to manage their household expenses. Rising fuel prices, exacerbated by global economic factors and climate change
Free with trial Price tag with arrow going up, Inflation and recession concept. Inflation and recession conceptual image, price tag with arrow going up. Investment decrease illustrations Price tag with arrow going up, Inflation and recession concept. Inflation and recession conceptual image, price tag with arrow going up
Free with trial A red declining stock market graph overlays a city skyline, symbolizing economic downturn and financial instability. Investment decrease illustrations A red declining stock market graph overlays a city skyline, symbolizing economic downturn and financial instability.
Free with trial Sharp downward sloping line graph red arrow pointing down analytics plunge Suitable for digital platforms. Investment decrease illustrations Sharp downward sloping line graph, red arrow pointing down, analytics, plunge. Sharp downward sloping line graph red arrow pointing down analytics plunge. Sharp downward sloping line graph red arrow pointing down analytics plunge Suitable for digital platforms
Free with trial Visual depicting a rate cut. Scissors slice a red percentage sign against a teal background, symbolizing savings, deals, and discounts. Investment decrease illustrations Rate Cut: Scissors Slicing a Red Percentage Sign on Teal - Savings, Deals & Discounts Visual. Visual depicting a rate cut. Scissors slice a red percentage sign. Visual depicting a rate cut. Scissors slice a red percentage sign against a teal background, symbolizing savings, deals, and discounts
Free with trial The Red Bear on Mother Board for Business concept 3d Rendering. Investment decrease illustrations The Red Bear on Mother Board for Business concept 3d Rendering. Red Bear on Mother Board for Business concept 3d Rendering
Free with trial The Red Bear on Mother Board for Business concept 3d Rendering. Investment decrease illustrations The Red Bear on Mother Board for Business concept 3d Rendering. Red Bear on Mother Board for Business concept 3d Rendering
Free with trial The global energy market is a dynamic and complex system, heavily influenced by factors ranging from geopolitical events to technological advancements. This compelling visualization showcases the fluctuating price of a barrel of crude oil over time, revealing the dramatic boom and bust cycles characteristic of the industry. Observe the peaks and valleys, the periods of sustained growth, and the. Investment decrease illustrations Visualizing Crude Oil Price Volatility A Deep Dive into the Boom and Bust Cycles of the Global Energy. The global energy market is a dynamic and complex system. The global energy market is a dynamic and complex system, heavily influenced by factors ranging from geopolitical events to technological advancements. This compelling visualization showcases the fluctuating price of a barrel of crude oil over time, revealing the dramatic boom and bust cycles characteristic of the industry. Observe the peaks and valleys, the periods of sustained growth, and the
Free with trial A Vector Dollar Up Icon Symbol represents an increase in value, price, or positive movement in financial markets, often associated with economic growth or profit. This symbol is commonly used in financial contexts to indicate a rise in currency value or favorable trends. Investment decrease vectors Vector Dollar Up Icon Symbol. A Vector Dollar Up Icon Symbol represents an increase in value, price, or positive movement in financial markets, often associated. A Vector Dollar Up Icon Symbol represents an increase in value, price, or positive movement in financial markets, often associated with economic growth or profit. This symbol is commonly used in financial contexts to indicate a rise in currency value or favorable trends.
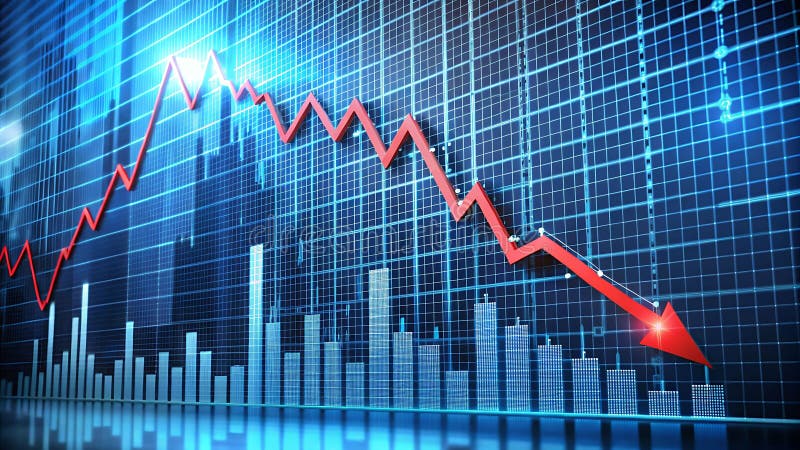
Free with trial Generative ai, The image shows a blue grid with a red arrow pointing downward, indicating a decline, against a blue background, highlighting the concept of a downward trend. Investment decrease illustrations The image is a stock market chart showing a red arrow pointing down on a blue grid background with blue bar graphs. The arrow is. Generative ai, The image shows. generative ai, The image shows a blue grid with a red arrow pointing downward, indicating a decline, against a blue background, highlighting the concept of a downward trend
Free with trial Red world map with a declining line graph showing financial crisis and economic recession globally. Generative AI. Investment decrease illustrations Red world map with a declining line graph showing financial crisis and economic recession globally. Generative AI
Free with trial The Red Bear on Mother Board for Business concept 3d Rendering. Investment decrease illustrations The Red Bear on Mother Board for Business concept 3d Rendering. Red Bear on Mother Board for Business concept 3d Rendering
Free with trial This conceptual 3D illustration depicts a dollar bill being severed with scissors, a powerful visual metaphor for financial reduction and cost-cutting strategies. The image utilizes a crisp cartoon style and features a realistic dollar bill prominently displayed against a clean white background. This imagery effectively communicates concepts of budget cuts, decreasing spending, and addressing. Investment decrease illustrations Conceptual illustration of a dollar bill cut with scissors representing financial reduction or cost cutting strategies. This conceptual 3D illustration depicts a. This conceptual 3D illustration depicts a dollar bill being severed with scissors, a powerful visual metaphor for financial reduction and cost-cutting strategies. The image utilizes a crisp cartoon style and features a realistic dollar bill prominently displayed against a clean white background. This imagery effectively communicates concepts of budget cuts, decreasing spending, and addressing
Free with trial A polished gold crest featuring a bold red arrow pointing downward, representing safeguarding assets amidst economic challenges or market downturns. Investment decrease illustrations Golden shield with a red downward arrow symbolizing financial decline or market protection against falling stock prices and. A polished gold crest featuring a. A polished gold crest featuring a bold red arrow pointing downward, representing safeguarding assets amidst economic challenges or market downturns
Free with trial Neon pink percent sign symbol illuminated with bright light. Three-dimensional object in clear acrylic casing. Abstract concept for business, finance, sales, discounts. Great for. Investment decrease illustrations Neon pink percent sign symbol illuminated with bright light. Three-dimensional object in clear acrylic casing. Abstract concept. For business, finance, sales
Free with trial Watercolor illustration of business growth. Orange bar, pie charts on aged paper show data analysis, market trends, financial progress. Visuals represent success, planning strategic. Investment decrease illustrations Watercolor illustration of business growth. Orange bar, pie charts on aged paper show data analysis, market trends, financial. Progress. Visuals represent. Watercolor illustration of business growth. Orange bar, pie charts on aged paper show data analysis, market trends, financial progress. Visuals represent success, planning strategic.
Free with trial Reduction chart icon set depicting data reduction symbols, ideal for business analytics and performance visuals. Investment decrease vectors Reduction chart icon set depicting data reduction symbols.Vector illustration. Reduction chart icon set depicting data reduction symbols, ideal for business. Reduction chart icon set depicting data reduction symbols, ideal for business analytics and performance visuals
Free with trial Red arrow plunges downward, financial charts graphs blurred background. Sharp decline percentage market value. Crisis, economic downturn, recession, business losses falling market. Investment decrease illustrations Red arrow plunges downward, financial charts graphs blurred background. Sharp decline percentage market value. Crisis, economic. Downturn, recession, business
Free with trial A bear market depression, brown bear in market. stock going down graph background. Investment decrease illustrations Bear market depression, brown bear in market. stock going down graph background. A bear market depression, brown bear in market. stock going down graph. A bear market depression, brown bear in market. stock going down graph background
Free with trial A bear market depression, brown bear in market. stock going down graph background. Investment decrease illustrations Bear market depression, brown bear in market. stock going down graph background. A bear market depression, brown bear in market. stock going down graph. A bear market depression, brown bear in market. stock going down graph background
Free with trial A bear market depression, brown bear in market. stock going down graph background. Investment decrease illustrations Bear market depression, brown bear in market. stock going down graph background. A bear market depression, brown bear in market. stock going down graph. A bear market depression, brown bear in market. stock going down graph background
Free with trial A bear market depression, brown bear in market. stock going down graph background. Investment decrease illustrations Bear market depression, brown bear in market. stock going down graph background. A bear market depression, brown bear in market. stock going down graph. A bear market depression, brown bear in market. stock going down graph background
Free with trial Luxury concrete inscription tax free on grey podium, soft light, front view smooth background, 3d rendering. Investment decrease illustrations Luxury concrete inscription tax free on grey podium, soft light, smooth background, 3d rendering. Luxury concrete inscription tax free on grey podium, soft light. Luxury concrete inscription tax free on grey podium, soft light, front view smooth background, 3d rendering
Free with trial The Red Bear on Mother Board for Business concept 3d Rendering. Investment decrease illustrations The Red Bear on Mother Board for Business concept 3d Rendering. Red Bear on Mother Board for Business concept 3d Rendering
 Sign in