Free with trial Costs optimization thin line icon set. Costs optimization icon set on white background. Eps 10 stock vector. Investment decrease vectors Costs optimization thin line icon set. Costs optimization icon set on white background. Eps 10 stock vector
Free with trial Red arrow points down on office window glass visualizing business recession impact. Downward trend, decayed finance state, crisis risk, loss. Financial crash economy bankruptcy. Damage. Investment decrease illustrations Red arrow points down on office window glass visualizing business recession impact. Downward trend, decayed finance state, crisis. Risk, loss. Financial crash. Red arrow points down on office window glass visualizing business recession impact. Downward trend, decayed finance state, crisis risk, loss. Financial crash economy bankruptcy. Damage.
Free with trial Costs optimization thin line icon set. Costs optimization icon set on white background. Eps 10 stock vector. Investment decrease vectors Costs optimization thin line icon set. Costs optimization icon set on white background. Eps 10 stock vector
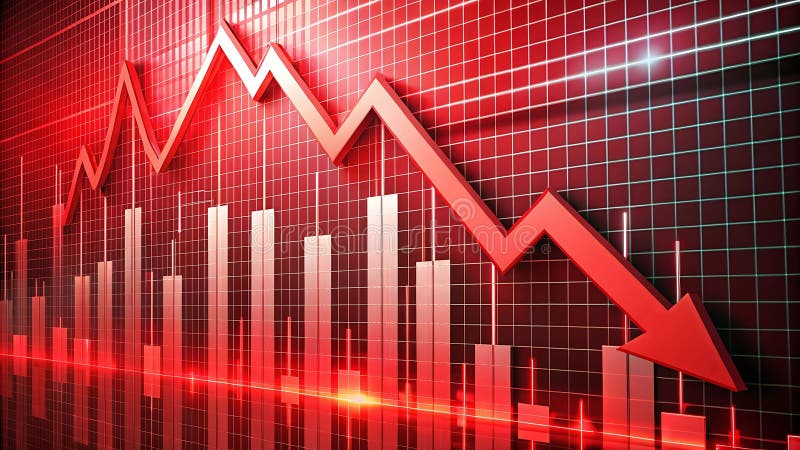
Free with trial Generative ai, The image shows a red bar graph and a red arrow pointing down on a red grid background, illustrating a significant downward trend. Investment decrease illustrations The image shows a red and white arrow pointing down in front of a red grid background with a series of 3D red bars depicting. Generative ai, The image shows a. generative ai, The image shows a red bar graph and a red arrow pointing down on a red grid background, illustrating a significant downward trend
Free with trial Upward and downward arrow icon set in generic design. Up and down direction sign symbol. Concept. Investment decrease vectors Upward and downward arrow icon set in generic design. Up and down direction sign symbol. Concept
Free with trial Uptrend and downtrend arrow icon on circle line. Zigzag arrows up and down illustration concept. Investment decrease vectors Uptrend and downtrend arrow icon on circle line. Zigzag arrows up and down concept. Uptrend and downtrend arrow icon on circle line. Zigzag arrows up and down. Uptrend and downtrend arrow icon on circle line. Zigzag arrows up and down illustration concept
Free with trial Bitcoin cryptocurrency price chart with green arrow down. Downward trend financial loss graph on exchange market. Digital virtual money crypto business finance. Investment decrease illustrations Bitcoin cryptocurrency price chart with green arrow down. Downward trend financial loss graph on exchange market. Digital virtual. Money crypto business finance
Free with trial Bar Chart With Downward Arrow Solid Icon. Economic Decline, Financial Loss, And Market Downturn Silhouette Symbol. Business Analysis. Isolated Vector Illustration. Investment decrease vectors Bar Chart With Downward Arrow Solid Icon. Economic Decline, Financial Loss, And Market Downturn Silhouette Symbol. Business Analysis. Isolated Vector
Free with trial A miniature wooden house sits atop a foundation of stacked coins, symbolizing property value. A downward sloping graph intersects the scene, visually representing a declining market trend in real estate. The background is a soft, out-of-focus green, suggesting an outdoor setting, with a warm light filtering through. This evokes concepts of financial loss and housing market challenges. Investment decrease illustrations Falling Home Prices Wooden House, Stacked Coins, and Downward Graph Illustrating Real Estate Market Decline. A miniature wooden house sits atop a foundation of. A miniature wooden house sits atop a foundation of stacked coins, symbolizing property value. A downward sloping graph intersects the scene, visually representing a declining market trend in real estate. The background is a soft, out-of-focus green, suggesting an outdoor setting, with a warm light filtering through. This evokes concepts of financial loss and housing market challenges
Free with trial The visual displays a clean and minimalist bar chart, illustrating a notable decrease in financial performance over a recent quarter, with a focus on dark blue tones to enhance impact. Investment decrease illustrations Minimalist financial bar chart showing significant decline in earnings over the past quarter. The visual displays a clean and minimalist bar chart, illustrating. The visual displays a clean and minimalist bar chart, illustrating a notable decrease in financial performance over a recent quarter, with a focus on dark blue tones to enhance impact.
Free with trial Overlayed with a falling financial graph in red and blue colors, two hands type on a laptop. AI generated. Investment decrease illustrations Overlayed with a falling financial graph in red and blue colors, two hands type on a laptop. AI generated
Free with trial A vibrant watercolor painting of a colorful tree alongside a bar graph showing fluctuating growth, symbolizing nature, growth, change, resilience, and potential. Elegant empty space crafted for branding, ads, and product presentations. Suitable for marketing campaigns and creative displays. . Generative AI. Investment decrease illustrations Watercolor Tree and Growth Chart A vibrant watercolor painting of a colorful tree alongside a bar graph showing fluctuating. A vibrant watercolor painting of a. A vibrant watercolor painting of a colorful tree alongside a bar graph showing fluctuating growth, symbolizing nature, growth, change, resilience, and potential. Elegant empty space crafted for branding, ads, and product presentations. Suitable for marketing campaigns and creative displays. . Generative AI
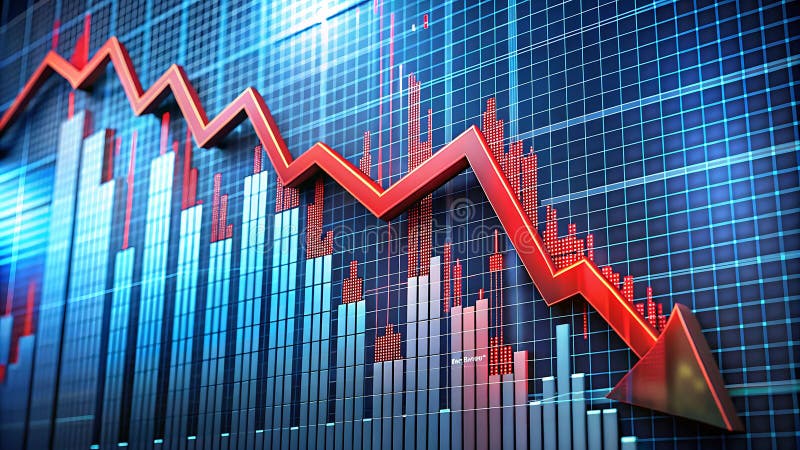
Free with trial Generative ai, The image shows a bar chart with a red arrow pointing down, indicating a downward trend in a financial market. The glowing blue bars represent rising values, while the red arrow signifies a drop in value,. Investment decrease illustrations The image shows a blue and red graph with a red arrow pointing downwards, illustrating a decline in a company stock price. Generative ai, The image shows a bar. generative ai, The image shows a bar chart with a red arrow pointing down, indicating a downward trend in a financial market. The glowing blue bars represent rising values, while the red arrow signifies a drop in value,
Free with trial Concept of economic collapse by falling graph, chart, highlighting global recession fueled by inflation, stock market crash, financial crisis, falling income, GDP decline, capital reduction. Investment decrease illustrations Concept of economic collapse by falling graph, chart, highlighting global recession fueled by inflation, stock market crash,. Financial crisis, falling income. Concept of economic collapse by falling graph, chart, highlighting global recession fueled by inflation, stock market crash, financial crisis, falling income, GDP decline, capital reduction
Free with trial Concept of economic collapse by falling graph, chart, highlighting global recession fueled by inflation, stock market crash, financial crisis, falling income, GDP decline, capital reduction. Investment decrease illustrations Concept of economic collapse by falling graph, chart, highlighting global recession fueled by inflation, stock market crash,. Financial crisis, falling income. Concept of economic collapse by falling graph, chart, highlighting global recession fueled by inflation, stock market crash, financial crisis, falling income, GDP decline, capital reduction
Free with trial Golden Symbol Of Gold Percentage Or Business Tax Rate With Discount Rate, Illustration On A Golden Background. Rendered Image. Golden Symbol Of Gold Percentage. Investment decrease illustrations Golden Symbol Of Gold Percentage Or Business Tax Rate With Discount Rate, Illustration On A Golden Background. Rendered Image. Golden Symbol Of Gold Percentage
Free with trial Recession concept. Falling market. The trading broker is horrified at the falling market. Financial graph down. Vector illustration isometric design. Investment decrease vectors Recession concept. Falling market. The trading broker is horrified at the falling market. Financial graph down. Vector illustration isometric design
Free with trial Revenue Decline line icon. Universal creative premium symbol. Vector sign icon logo template. Vector illustration. Universal creative. Investment decrease vectors Revenue Decline line icon. Universal creative premium symbol. Vector sign icon logo template. Vector illustration. Revenue Decline line icon. Universal creative
Free with trial Interest rate cuts diminish savings investment returns. Visualized impact on yields potential losses. Investment decrease illustrations Interest Rate Cuts: Impact on Savings & Investments - Visual Representation of Decreasing Returns. Interest rate cuts diminish savings investment returns. Interest rate cuts diminish savings investment returns. Visualized impact on yields potential losses
Free with trial Financial Capability Month Financial chart with 3d bar graph and line plot illustrating market trends. Financial chart with 3d bar graph and line plot. Investment decrease illustrations Financial Capability Month Financial chart with 3d bar graph and line plot illustrating market trends. Financial chart with 3d bar graph and line plot
Free with trial This image showcases a shiny gold percentage symbol against a clean white background. It represents financial concepts, special offers, and marketing strategies effectively. Investment decrease illustrations Gold Percentage Symbol on a White Background for Financial and Marketing Concepts, Special Offers, Discounts and Promotions. This image showcases a shiny gold. This image showcases a shiny gold percentage symbol against a clean white background. It represents financial concepts, special offers, and marketing strategies effectively
Free with trial Bear market stock exchange fall concept - golden bear statue on wall street in financial district during golden hour. Investment decrease illustrations Bear market stock exchange fall concept - golden bear statue on wall street in financial district. During golden hour
Free with trial The Red arrow Down on Business background 3d rendering. Investment decrease illustrations The Red arrow Down on Business background 3d rendering. Red arrow Down on Business background 3d rendering
Free with trial Close up of a stack of Bitcoin coins on a stock market chart showing a downward trend Illustrates cryptocurrency market volatility. Investment decrease illustrations Bitcoin Cryptocurrency Digital Currency Close Up Stack on Stock Market Chart Showing Decline. Close up of a stack of Bitcoin coins on a stock market chart. Close up of a stack of Bitcoin coins on a stock market chart showing a downward trend Illustrates cryptocurrency market volatility
Free with trial Generative ai, The image is of a red arrow pointing down, superimposed on a blue and red bar graph, symbolizing a downward trend, potentially indicating a financial or economic decline. Investment decrease illustrations A large red arrow points downwards over a gridded financial chart showing a sharp decline in value, with the bars of the chart. Generative ai, The image is of a. generative ai, The image is of a red arrow pointing down, superimposed on a blue and red bar graph, symbolizing a downward trend, potentially indicating a financial or economic decline
Free with trial Generative ai, The image shows a red tiled wall with a white arrow pointing down and a red bar graph that is decreasing in height. The background is a red tiled wall with white lines, and the floor is a red shiny surface with the reflection of the g. Investment decrease illustrations The image shows a red bar graph with a white arrow pointing downwards, representing a declining trend. The graph is set against a. Generative ai, The image shows. generative ai, The image shows a red tiled wall with a white arrow pointing down and a red bar graph that is decreasing in height. The background is a red tiled wall with white lines, and the floor is a red shiny surface with the reflection of the g
Free with trial A crane lifts a shipping container with a falling graph shadow behind it, symbolizing economic downturn, market decline, and global trade issues. a visual representation of financial crisis. Investment decrease illustrations Usa china international trade war shipping container crane with falling graph shadow representing economic downturn and market ... A crane lifts a shipping. a crane lifts a shipping container with a falling graph shadow behind it, symbolizing economic downturn, market decline, and global trade issues. a visual representation of financial crisis
Free with trial A symbolic image of a cracked piggy bankg, sitting on a broken, concrete-like surface. In the background, an aged financial chart shows stock market fluctuations. This conceptual image represents economic instability, financial insecurity, inflation, or recession. Ideal for illustrating the fragility of savings and fiscal challenges. Investment decrease illustrations Cracked piggy bank on broken ground, symbolizing fragile economy and financial instability. A symbolic image of a cracked piggy bankg, sitting on a broken. A symbolic image of a cracked piggy bankg, sitting on a broken, concrete-like surface. In the background, an aged financial chart shows stock market fluctuations. This conceptual image represents economic instability, financial insecurity, inflation, or recession. Ideal for illustrating the fragility of savings and fiscal challenges.
Free with trial A symbolic image of a cracked piggy bankg, sitting on a broken, concrete-like surface. In the background, an aged financial chart shows stock market fluctuations. This conceptual image represents economic instability, financial insecurity, inflation, or recession. Ideal for illustrating the fragility of savings and fiscal challenges. Investment decrease illustrations Cracked piggy bank on broken ground, symbolizing fragile economy and financial instability. A symbolic image of a cracked piggy bankg, sitting on a broken. A symbolic image of a cracked piggy bankg, sitting on a broken, concrete-like surface. In the background, an aged financial chart shows stock market fluctuations. This conceptual image represents economic instability, financial insecurity, inflation, or recession. Ideal for illustrating the fragility of savings and fiscal challenges.
Free with trial A symbolic image of a cracked piggy bankg, sitting on a broken, concrete-like surface. In the background, an aged financial chart shows stock market fluctuations. This conceptual image represents economic instability, financial insecurity, inflation, or recession. Ideal for illustrating the fragility of savings and fiscal challenges. Investment decrease illustrations Cracked piggy bank on broken ground, symbolizing fragile economy and financial instability. A symbolic image of a cracked piggy bankg, sitting on a broken. A symbolic image of a cracked piggy bankg, sitting on a broken, concrete-like surface. In the background, an aged financial chart shows stock market fluctuations. This conceptual image represents economic instability, financial insecurity, inflation, or recession. Ideal for illustrating the fragility of savings and fiscal challenges.
Free with trial A symbolic image of a cracked piggy bankg, sitting on a broken, concrete-like surface. In the background, an aged financial chart shows stock market fluctuations. This conceptual image represents economic instability, financial insecurity, inflation, or recession. Ideal for illustrating the fragility of savings and fiscal challenges. Investment decrease illustrations Cracked piggy bank on broken ground, symbolizing fragile economy and financial instability. A symbolic image of a cracked piggy bankg, sitting on a broken. A symbolic image of a cracked piggy bankg, sitting on a broken, concrete-like surface. In the background, an aged financial chart shows stock market fluctuations. This conceptual image represents economic instability, financial insecurity, inflation, or recession. Ideal for illustrating the fragility of savings and fiscal challenges.
Free with trial A symbolic image of a cracked piggy bankg, sitting on a broken, concrete-like surface. In the background, an aged financial chart shows stock market fluctuations. This conceptual image represents economic instability, financial insecurity, inflation, or recession. Ideal for illustrating the fragility of savings and fiscal challenges. Investment decrease illustrations Cracked piggy bank on broken ground, symbolizing fragile economy and financial instability. A symbolic image of a cracked piggy bankg, sitting on a broken. A symbolic image of a cracked piggy bankg, sitting on a broken, concrete-like surface. In the background, an aged financial chart shows stock market fluctuations. This conceptual image represents economic instability, financial insecurity, inflation, or recession. Ideal for illustrating the fragility of savings and fiscal challenges.
Free with trial Close up of a stack of Bitcoin coins on a stock market chart showing a downward trend Illustrates cryptocurrency market volatility. Investment decrease illustrations Bitcoin Cryptocurrency Digital Currency Close Up Stack on Stock Market Chart Showing Decline. Close up of a stack of Bitcoin coins on a stock market chart. Close up of a stack of Bitcoin coins on a stock market chart showing a downward trend Illustrates cryptocurrency market volatility
Free with trial Bar Chart With Downward Trend Line Icon. Financial Decline, Economic Recession, And Market Analysis Outline Symbol. Business Performance Tracking. Editable Stroke. Isolated Vector Illustration. Investment decrease vectors Bar Chart With Downward Trend Line Icon. Financial Decline, Economic Recession, And Market Analysis Outline Symbol. Business Performance Tracking. Editable
Free with trial A 3D illustration of a miniature house model is shown on a seesaw with a dollar sign, counterbalanced by piles of coins. And a downward pointing arrow. AI. Investment decrease illustrations A 3D illustration of a miniature house model is shown on a seesaw with a dollar sign, counterbalanced by piles of coins. And a downward pointing arrow. AI
Free with trial Euro coin stack with a red arrow going down, illustrating the concept of euro depreciation. Investment decrease illustrations Red arrow going down over euro coins stack illustrating economic crisis. Euro coin stack with a red arrow going down, illustrating the concept of euro. Euro coin stack with a red arrow going down, illustrating the concept of euro depreciation
Free with trial Up and down arrow icon set in generic design. Upward and downward sign symbol. Illustration. Investment decrease vectors Up and down arrow icon set in generic design. Upward and downward sign symbol. Illustration
Free with trial Bar Chart With Downward Trend Line Solid Icon. Financial Decline, Economic Downturn, And Market Analysis Silhouette Symbol. Business Performance Tracking. Isolated Vector Illustration. Investment decrease vectors Bar Chart With Downward Trend Line Solid Icon. Financial Decline, Economic Downturn, And Market Analysis Silhouette. Symbol. Business Performance Tracking. Bar Chart With Downward Trend Line Solid Icon. Financial Decline, Economic Downturn, And Market Analysis Silhouette Symbol. Business Performance Tracking. Isolated Vector Illustration.
Free with trial The "Vector Dollar Up and Down Icon Symbol" is a graphical representation designed to indicate fluctuations in financial value, showing both increases and decreases. Investment decrease vectors Vector Dollar Up And Down Icon Symbol. The 'Vector Dollar Up and Down Icon Symbol' is a graphical representation designed to indicate fluctuations in financial. The "Vector Dollar Up and Down Icon Symbol" is a graphical representation designed to indicate fluctuations in financial value, showing both increases and decreases.
Free with trial The "Vector Dollar Up and Down Icon Symbol" is a graphical representation used to indicate fluctuations in financial value, showing both increases and decreases. Investment decrease vectors Vector Dollar Up And Down Icon Symbol. The 'Vector Dollar Up and Down Icon Symbol' is a graphical representation used to indicate fluctuations in financial value. The "Vector Dollar Up and Down Icon Symbol" is a graphical representation used to indicate fluctuations in financial value, showing both increases and decreases.
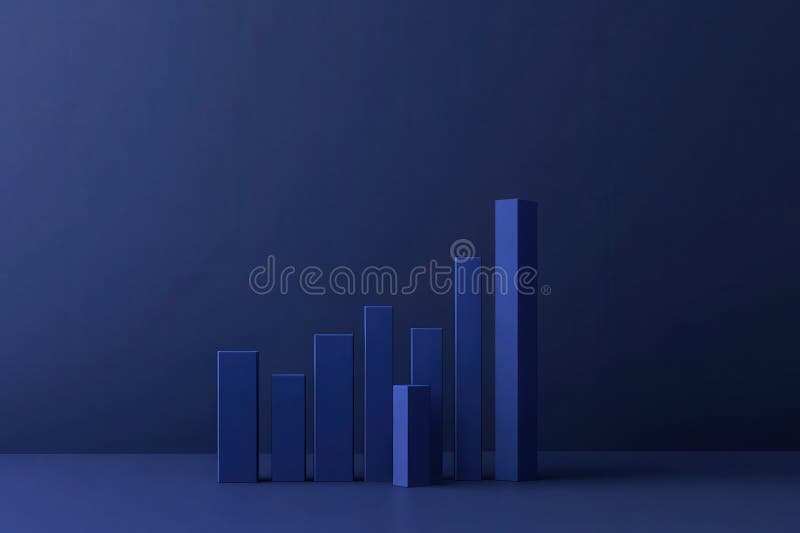
Free with trial Vibrant bar chart visualization with dark background displaying data trends ,Generative ai. Investment decrease illustrations Colorful bar chart on dark background, data visualization for business performance analysis and trend insights. Vibrant bar chart visualization with dark. Vibrant bar chart visualization with dark background displaying data trends ,Generative ai
Free with trial The red futuristic with neon lights background. Hi-tech backdrop. Generative AI. Investment decrease illustrations The red futuristic with a neon lights background. Hi-tech backdrop. Generative AI. The red futuristic with neon lights background. Hi-tech backdrop. Generative. The red futuristic with neon lights background. Hi-tech backdrop. Generative AI
Free with trial Global economic slowdown, businessman is using a slow snail to represent the gradual growth of GDP in the world economy. Investment decrease vectors Global economic slowdown, businessman is using a slow snail to represent the gradual growth of GDP in the world economy.
Free with trial Cost reduction, Businessman cutting high expenses with scissors to allow profits to increase. Investment decrease vectors Cost reduction, Businessman cutting high expenses with scissors to allow profits to increase.
Free with trial Decreasing stocks bars graphic outline icon in white and black colors. decreasing stocks bars graphic flat vector icon from business collection for web, mobile apps and ui. Investment decrease vectors Decreasing stocks bars graphic outline icon in white and black colors. decreasing stocks bars graphic flat vector icon from. Business collection for web, mobile
Free with trial Illustration of Declining Real Estate Market Showing Falling House Prices and Home Prices Fall. This image is generated using AI tool. Investment decrease illustrations Illustration of Declining Real Estate Market Showing Falling House Prices and Home Prices Fall. This image is generated using AI tool
Free with trial Illustration of Declining Real Estate Market Showing Falling House Prices and Home Prices Fall. This image is generated using AI tool. Investment decrease illustrations Illustration of Declining Real Estate Market Showing Falling House Prices and Home Prices Fall. This image is generated using AI tool
Free with trial Illustration of Declining Real Estate Market Showing Falling House Prices and Home Prices Fall. This image is generated using AI tool. Investment decrease illustrations Illustration of Declining Real Estate Market Showing Falling House Prices and Home Prices Fall. This image is generated using AI tool
Free with trial Illustration of Declining Real Estate Market Showing Falling House Prices and Home Prices Fall. This image is generated using AI tool. Investment decrease illustrations Illustration of Declining Real Estate Market Showing Falling House Prices and Home Prices Fall. This image is generated using AI tool
Free with trial Inflation and recession conceptual image, price tag with arrow going up over shopping basket. Investment decrease illustrations Price tag with arrow going up over shopping basket, Inflation and recession concept. Inflation and recession conceptual image, price tag with arrow going up over. Inflation and recession conceptual image, price tag with arrow going up over shopping basket
Free with trial Economic critical crisis concept. The bar graph on red world map background. Recession financial, cryptocurrency, gold, and the stock market. Losing money and cash. Bearish. Investment decrease vectors Economic critical crisis concept. The bar graph on red world map background. Recession financial, cryptocurrency, gold, and the. Stock market. Losing money and
Free with trial Green up and red down 3d arrow graph showing rising, descending trend, business result, profit or loss symbol symbol. Business arrow, goals concept. 3d world money symbols. Financial growth vector isolated. Investment decrease vectors Green up and red down 3d arrow graph showing rising, descending trend, business result, profit. world money symbols. Green up and red down 3d arrow graph. Green up and red down 3d arrow graph showing rising, descending trend, business result, profit or loss symbol symbol. Business arrow, goals concept. 3d world money symbols. Financial growth vector isolated
Free with trial Green up and red down 3d arrow graph showing rising, descending trend, business result, profit or loss symbol symbol. Business arrow, goals concept. 3d world money symbols. Financial growth vector isolated. Investment decrease vectors Green up and red down 3d arrow graph showing rising, descending trend, business result, profit. world money symbols. Green up and red down 3d arrow graph. Green up and red down 3d arrow graph showing rising, descending trend, business result, profit or loss symbol symbol. Business arrow, goals concept. 3d world money symbols. Financial growth vector isolated
Free with trial Green up and red down 3d arrow graph showing rising, descending trend, business result, profit or loss symbol symbol. Business arrow, goals concept. 3d world money symbols. Financial growth vector isolated. Investment decrease vectors Green up and red down 3d arrow graph showing rising, descending trend, business result, profit. world money symbols. Green up and red down 3d arrow graph. Green up and red down 3d arrow graph showing rising, descending trend, business result, profit or loss symbol symbol. Business arrow, goals concept. 3d world money symbols. Financial growth vector isolated
Free with trial Green up and red down 3d arrow graph showing rising, descending trend, business result, profit or loss symbol symbol. Business arrow, goals concept. 3d world money symbols. Financial growth vector isolated. Investment decrease vectors Green up and red down 3d arrow graph showing rising, descending trend, business result, profit. world money symbols. Green up and red down 3d arrow graph. Green up and red down 3d arrow graph showing rising, descending trend, business result, profit or loss symbol symbol. Business arrow, goals concept. 3d world money symbols. Financial growth vector isolated
Free with trial Green up and red down 3d arrow graph showing rising, descending trend, business result, profit or loss symbol symbol. Business arrow, goals concept. 3d world money symbols. Financial growth vector isolated. Investment decrease vectors Green up and red down 3d arrow graph showing rising, descending trend, business result, profit. world money symbols. Green up and red down 3d arrow graph. Green up and red down 3d arrow graph showing rising, descending trend, business result, profit or loss symbol symbol. Business arrow, goals concept. 3d world money symbols. Financial growth vector isolated
Free with trial Green up and red down 3d arrow graph showing rising, descending trend, business result, profit or loss symbol symbol. Business arrow, goals concept. 3d world money symbols. Financial growth vector isolated. Investment decrease vectors Green up and red down 3d arrow graph showing rising, descending trend, business result, profit. world money symbols. Green up and red down 3d arrow graph. Green up and red down 3d arrow graph showing rising, descending trend, business result, profit or loss symbol symbol. Business arrow, goals concept. 3d world money symbols. Financial growth vector isolated
Free with trial Green up and red down 3d arrow graph showing rising, descending trend, business result, profit or loss symbol symbol. Business arrow, goals concept. 3d world money symbols. Financial growth vector isolated. Investment decrease vectors Green up and red down 3d arrow graph showing rising, descending trend, business result, profit. world money symbols. Green up and red down 3d arrow graph. Green up and red down 3d arrow graph showing rising, descending trend, business result, profit or loss symbol symbol. Business arrow, goals concept. 3d world money symbols. Financial growth vector isolated
Free with trial Green up and red down 3d arrow graph showing rising, descending trend, business result, profit or loss symbol symbol. Business arrow, goals concept. 3d world money symbols. Financial growth vector isolated. Investment decrease vectors Green up and red down 3d arrow graph showing rising, descending trend, business result, profit. world money symbols. Green up and red down 3d arrow graph. Green up and red down 3d arrow graph showing rising, descending trend, business result, profit or loss symbol symbol. Business arrow, goals concept. 3d world money symbols. Financial growth vector isolated
Free with trial Downward Trend, Stock Market Crash or Economic Crisis. Conceptual Background, Red and Black, Generated by AI. Investment decrease illustrations Downward Trend, Stock Market Crash or Economic Crisis. Conceptual Background, Red and Black. Generated by AI
Free with trial This image features red and green arrows pointing downwards, symbolizing a decline or negative trend in markets, finance, or business. It represents loss and reduction. Investment decrease vectors Vector art of a visual representation of downward trends with red and green arrows indicating decline isolated on white background. This image features red and. This image features red and green arrows pointing downwards, symbolizing a decline or negative trend in markets, finance, or business. It represents loss and reduction
Free with trial Wooden blocks with dollar signs and gears illustrate a downward trend in business profits A hand-drawn black graph emphasizes the decline in financial performance perfect for illustrating economic downturn or financial loss concepts. Investment decrease illustrations Declining Business Profits Wooden Blocks Showing Dollar Signs and Gears with a Falling Graph AI generated. Wooden blocks with dollar signs and gears illustrate. Wooden blocks with dollar signs and gears illustrate a downward trend in business profits A hand-drawn black graph emphasizes the decline in financial performance perfect for illustrating economic downturn or financial loss concepts
Free with trial Generative ai, The image is a red stock market chart with a large red arrow pointing down. The chart is on a red and black grid. It shows a sharp decline in a stock price. This suggests that there is a recession or downturn in the economy. Investment decrease illustrations The image is a red graph with a large red arrow pointing downwards, signifying a decline in an economic or market trend, on a red. Generative ai, The image is a. generative ai, The image is a red stock market chart with a large red arrow pointing down. The chart is on a red and black grid. It shows a sharp decline in a stock price. This suggests that there is a recession or downturn in the economy
Free with trial Businessman has been crushed by a huge coin with the Dollar symbol,. Investment decrease vectors Businessman has been crushed by a huge coin with the Dollar symbol,. Businessman has been crushed by a huge coin with the Dollar symbol
Free with trial Cost reduction. Cost increase icon. Price reduced, discount icon. Low total cost icon vector image. Vector illustration isolated on background. Investment decrease vectors Cost reduction. Cost increase icon. Price reduced, discount icon. Low total cost icon vector image. Vector illustration isolated. On background
Free with trial Cost reduction. Cost increase icon. Price reduced, discount icon. Low total cost icon vector image. Vector illustration isolated on background. Investment decrease vectors Cost reduction. Cost increase icon. Price reduced, discount icon. Low total cost icon vector image. Vector illustration isolated. On background
Free with trial Cost reduction. Cost increase icon. Price reduced, discount icon. Low total cost icon vector image. Vector illustration isolated on background. Investment decrease vectors Cost reduction. Cost increase icon. Price reduced, discount icon. Low total cost icon vector image. Vector illustration isolated. On background
Free with trial Cost reduction. Cost increase icon. Price reduced, discount icon. Low total cost icon vector image. Vector illustration isolated on background. Investment decrease vectors Cost reduction. Cost increase icon. Price reduced, discount icon. Low total cost icon vector image. Vector illustration isolated. On background
Free with trial Bitcoin coins with red arrow down and with green growth arrow. Falling and growing price of cryptocurrency, concept. 3D rendering. Isolated on white background. Investment decrease illustrations Bitcoin coins with red arrow down and with green growth arrow. Falling and growing price of cryptocurrency, concept. 3D rendering. Isolated on white background
Free with trial Bar Chart Growth And Decline Line And Solid Icon Set. Financial Performance, Economic Trends, Business Analysis Symbol Collection. Data Visualization And Market Trends. Isolated Vector Illustration. Investment decrease vectors Bar Chart Growth And Decline Line And Solid Icon Set. Financial Performance, Economic Trends, Business Analysis Symbol. Collection. Data Visualization And. Bar Chart Growth And Decline Line And Solid Icon Set. Financial Performance, Economic Trends, Business Analysis Symbol Collection. Data Visualization And Market Trends. Isolated Vector Illustration.
Free with trial Downward Trending Graph On Stock Market Display With Red Data Points And A Fiery Red Glow, Generated by AI. Investment decrease illustrations Downward Trending Graph On Stock Market Display With Red Data Points And A Fiery Red Glow. Generated by AI
Free with trial Grey line Global economic crisis news icon isolated seamless pattern on white background. World finance crisis. Vector. Investment decrease illustrations Grey line Global economic crisis news icon isolated seamless pattern on white background. World finance crisis. Vector.
Free with trial A Vector Dollar Up and Down Icon Symbol represents the fluctuation or volatility of financial markets, typically indicating both rising and falling trends in currency value, stock prices, or overall economic performance. This symbol is useful for portraying financial dynamics in reports, apps, and dashboards. Investment decrease vectors Vector Dollar Up And Down Icon Symbol. A Vector Dollar Up and Down Icon Symbol represents the fluctuation or volatility of financial markets, typically. A Vector Dollar Up and Down Icon Symbol represents the fluctuation or volatility of financial markets, typically indicating both rising and falling trends in currency value, stock prices, or overall economic performance. This symbol is useful for portraying financial dynamics in reports, apps, and dashboards.
Free with trial A Vector Dollar Up and Down Icon Symbol is a visual representation of financial fluctuation, typically used to indicate changes in value, stock prices, or currency rates. Investment decrease vectors Vector Dollar Up And Down Icon Symbol. A Vector Dollar Up and Down Icon Symbol is a visual representation of financial fluctuation, typically used to indicate. A Vector Dollar Up and Down Icon Symbol is a visual representation of financial fluctuation, typically used to indicate changes in value, stock prices, or currency rates.
Free with trial Hand interacting with a projected bar chart on a wall, exploring data visualization ,Generative ai. Investment decrease illustrations Data visualization, hand engages with interactive bar chart projected on wall, exploring trends and insights. Hand interacting with a projected bar chart on a. Hand interacting with a projected bar chart on a wall, exploring data visualization ,Generative ai
Free with trial Sustainable green energy wind turbines. Generative AI. Investment decrease illustrations Sustainable green energy wind turbines. Generative AI
Free with trial The image depicts a vector graphic illustrating the concept of an economic recession, characterized by a stack of coins and a downward arrow symbolizing financial loss and market decline. This representation conveys themes of negativity associated with economic downturns, impacting savings and investments. The graphic is rendered in a black and white design, emphasizing its serious tone. Created with AI, it serves as a visual warning about the risks involved in financial decisions during a recession. Investment decrease vectors Economic Recession Vector Graphic with Coin Stack and Downward Arrow. The image depicts a vector graphic illustrating the concept of an economic recession. The image depicts a vector graphic illustrating the concept of an economic recession, characterized by a stack of coins and a downward arrow symbolizing financial loss and market decline. This representation conveys themes of negativity associated with economic downturns, impacting savings and investments. The graphic is rendered in a black and white design, emphasizing its serious tone. Created with AI, it serves as a visual warning about the risks involved in financial decisions during a recession.
Free with trial Decreasing Bar Chart With Downward Arrow Line Icon. Financial Decline, Economic Downturn, And Business Loss Outline Symbol. Market Analysis. Editable Stroke. Isolated Vector Illustration. Investment decrease vectors Decreasing Bar Chart With Downward Arrow Line Icon. Financial Decline, Economic Downturn, And Business Loss Outline. Symbol. Market Analysis. Editable Stroke. Decreasing Bar Chart With Downward Arrow Line Icon. Financial Decline, Economic Downturn, And Business Loss Outline Symbol. Market Analysis. Editable Stroke. Isolated Vector Illustration.
Free with trial Visualizing market downturn, financial decline, and recession with a blue abstract illustration. Analyzing business trends and economic shifts. Investment decrease illustrations Glass Chart: Market Downturn, Financial Decline, Recession Visualization, Blue Abstract Illustration, Business Trends, Economic. Visualizing market downturn. Visualizing market downturn, financial decline, and recession with a blue abstract illustration. Analyzing business trends and economic shifts
Free with trial 3D rendering illustrating a sharp decline in interest rates and economic downturn. A falling graph and decreasing coin stacks depict financial instability. Investment decrease illustrations Financial Crisis: Interest Rates Plummet, Economic Downturn Shown by Falling Graph and Diminishing Coin Stacks. 3D rendering illustrating a sharp decline in. 3D rendering illustrating a sharp decline in interest rates and economic downturn. A falling graph and decreasing coin stacks depict financial instability
 Sign in