Free with trial Red wooden arrow pointing down on yellow background. Business, market decline or economic. Challenges concept. Flat lay. Top view. Close-up. Investment decrease illustrations Red wooden arrow pointing down on yellow background. Business, market decline or economic. Challenges concept. Flat lay. Top view. Close-up
Free with trial Red wooden arrow pointing down on yellow background. Business, market decline or economic. Challenges concept. Flat lay. Top view. Close-up. Investment decrease illustrations Red wooden arrow pointing down on yellow background. Business, market decline or economic. Challenges concept. Flat lay. Top view. Close-up
Free with trial A person analyzing stock market charts with a pointer. Vector art design using ai tool. Investment decrease vectors Stock Market Illustration Charts. A person analyzing stock market charts with a pointer. Vector art design using ai tool. A person analyzing stock market charts with a pointer. Vector art design using ai tool.
Free with trial A 3D rendered image featuring a metallic, stylized arrow plunging downwards into a textured surface. The arrow's design incorporates a slight curve, adding a dynamic element to the composition. The background is a gradient of light gray, creating a clean and focused visual. The image evokes concepts of direction, impact, and decision-making, suitable for various illustrative purposes. Investment decrease illustrations Downward Arrow Impact. A 3D rendered image featuring a metallic, stylized arrow plunging downwards into a textured surface. The arrow's design incorporates a. A 3D rendered image featuring a metallic, stylized arrow plunging downwards into a textured surface. The arrow's design incorporates a slight curve, adding a dynamic element to the composition. The background is a gradient of light gray, creating a clean and focused visual. The image evokes concepts of direction, impact, and decision-making, suitable for various illustrative purposes.
Free with trial Businessmen team pushing stack of banknotes to resist a red down arrow. Financial crisis and economic downturn. A minimal style of an effect of inflation, recession, bankruptcy, and financial failure. Investment decrease vectors Businessmen team pushing stack of banknotes to resist a red down arrow. Financial crisis and economic downturn. A minimal style of. An effect of inflation. Businessmen team pushing stack of banknotes to resist a red down arrow. Financial crisis and economic downturn. A minimal style of an effect of inflation, recession, bankruptcy, and financial failure
Free with trial Uptrend and downtrend arrow vector icon. Investment decrease illustrations Uptrend and downtrend arrow vector icon.
Free with trial Downturn red stock chart illustration selloff recession, volatility dip, crash slump downturn red stock chart. Investment decrease illustrations Downturn red stock chart. Illustration selloff recession, volatility dip, crash slump AI generated. downturn red stock chart illustration selloff recession, volatility dip, crash slump downturn red stock chart
Free with trial A 3D rendering shows a red arrow plummeting downwards, disintegrating into particles. This dramatic visualization, generated by AI, symbolizes market decline and financial instability. The image is perfect for illustrating economic downturns or similar concepts. Investment decrease illustrations Crumbling Market Trends. A 3D rendering shows a red arrow plummeting downwards, disintegrating into particles. This dramatic visualization, generated by AI. A 3D rendering shows a red arrow plummeting downwards, disintegrating into particles. This dramatic visualization, generated by AI, symbolizes market decline and financial instability. The image is perfect for illustrating economic downturns or similar concepts.
Free with trial A simple, flat design icon depicting a downward trend. The image features a red graph line descending from the top left to the bottom right, with an arrow indicating the direction. The graph is set against a clean white background, emphasizing the visual impact of the trend. This graphic is suitable for illustrating concepts such as financial decline, decreasing sales, or negative performance in business, economics, or data analysis. Investment decrease vectors Downward Trend Graph Icon. A simple, flat design icon depicting a downward trend. The image features a red graph line descending from the top left to the bottom. A simple, flat design icon depicting a downward trend. The image features a red graph line descending from the top left to the bottom right, with an arrow indicating the direction. The graph is set against a clean white background, emphasizing the visual impact of the trend. This graphic is suitable for illustrating concepts such as financial decline, decreasing sales, or negative performance in business, economics, or data analysis.
Free with trial Stabilizing the economy during a stock market downturn, financial improvement, finding a survival strategy during a crisis, solving problems of declining business value, man balancing on dollar coin. Investment decrease vectors Man balancing on dollar coin. Stabilizing the economy during a stock market downturn, financial improvement, finding a survival strategy during a crisis, solving. Stabilizing the economy during a stock market downturn, financial improvement, finding a survival strategy during a crisis, solving problems of declining business value, man balancing on dollar coin
Free with trial Financial and economic improvement during stock market crash, stabilizing value of foreign currency, rising incomes and wages, countering inflation, preserving savings, man protects euro from arrow. Investment decrease vectors Man protects euro from arrow. Financial and economic improvement during stock market crash, stabilizing value of foreign currency, rising incomes and wages. Financial and economic improvement during stock market crash, stabilizing value of foreign currency, rising incomes and wages, countering inflation, preserving savings, man protects euro from arrow
Free with trial This image shows a detailed close-up of a stock market graph depicting a significant decline. The red color emphasizes the negative trend, illustrating potential losses or economic downturn. This visualization was generated by AI for analysis and presentation purposes. Investment decrease illustrations Red Market Decline Graph. This image shows a detailed close-up of a stock market graph depicting a significant decline. The red color emphasizes the negative. This image shows a detailed close-up of a stock market graph depicting a significant decline. The red color emphasizes the negative trend, illustrating potential losses or economic downturn. This visualization was generated by AI for analysis and presentation purposes.
Free with trial Red downward arrow graph. Isolated on transparent background. Investment decrease illustrations Red downward arrow graph. Isolated on transparent background
Free with trial A business professional displays a digital graph of business growth trends. The graph showcases upward and downward fluctuations, representing the dynamic and complex nature of market analysis. The image is a visual representation of business growth and analysis using technology. The professional is likely studying data to make informed decisions for optimal performance and future growth. Investment decrease illustrations Business Growth Trend Analysis with Digital Graph. A business professional displays a digital graph of business growth trends. The graph showcases upward and. A business professional displays a digital graph of business growth trends. The graph showcases upward and downward fluctuations, representing the dynamic and complex nature of market analysis. The image is a visual representation of business growth and analysis using technology. The professional is likely studying data to make informed decisions for optimal performance and future growth
Free with trial Dollar Vector illustration on a transparent background. Premium quality symmbols. Line Color vector icons for concept and graphic design. Investment decrease illustrations Dollar coin money down business. Dollar Vector illustration on a transparent background. Premium quality symmbols. Line Color vector icons for concept and. Dollar Vector illustration on a transparent background. Premium quality symmbols. Line Color vector icons for concept and graphic design
Free with trial Bull Market related vector icon. Isolated on white background. Vector illustration. Investment decrease vectors Bull Market related vector icon. Isolated on white background. Vector illustration
Free with trial Decreasing bar graph in ice cube. 3d illustration. Investment decrease illustrations Decreasing bar graph in ice cube. 3d illustration
Free with trial A visually striking image capturing a bar chart, line graph, and pie chart meticulously drawn in the wet sand on a beach. The artwork is illuminated by the warm, golden light of a sunset, with gentle waves lapping at the shore. This represents concepts of financial growth, market analysis, and business success in a unique, natural setting. The image evokes themes of planning, progress, and the cyclical nature of markets. Investment decrease illustrations Financial Growth Chart and Pie Chart Drawn in Sand at Sunset. A visually striking image capturing a bar chart, line graph, and pie chart meticulously drawn in. A visually striking image capturing a bar chart, line graph, and pie chart meticulously drawn in the wet sand on a beach. The artwork is illuminated by the warm, golden light of a sunset, with gentle waves lapping at the shore. This represents concepts of financial growth, market analysis, and business success in a unique, natural setting. The image evokes themes of planning, progress, and the cyclical nature of markets.
Free with trial The impact of a global economic meltdown on small businesses. Generative AI. Investment decrease illustrations The impact of a global economic meltdown on small businesses. Generative AI
Free with trial This image depicts a domino effect illustrating a market crash, with a downward trend generated by AI. The falling dominos symbolize the cascading impact of economic instability, highlighting the fragility of financial systems and the potential for rapid decline. Investment decrease illustrations Domino Effect: Market Crash. This image depicts a domino effect illustrating a market crash, with a downward trend generated by AI. The falling dominos symbolize. This image depicts a domino effect illustrating a market crash, with a downward trend generated by AI. The falling dominos symbolize the cascading impact of economic instability, highlighting the fragility of financial systems and the potential for rapid decline.
Free with trial A visual representation of financial growth, featuring stacked coins and an upward trend graph symbolizing increasing wealth, Generative AI. Investment decrease illustrations Stack of coins with a red downward arrow, illustrating the effect of falling interest rates on savings. A visual representation of financial growth, featuring. A visual representation of financial growth, featuring stacked coins and an upward trend graph symbolizing increasing wealth, Generative AI.
Free with trial A simple graphic illustration of a bar chart. The chart features four bars of varying heights, indicating growth or progress. The design is clean and minimalist, making it suitable for a wide range of applications such as presentations, reports, and infographics. The black bars stand out against the white background, providing a clear visual representation of data. Investment decrease illustrations Bar Chart Icon. A simple graphic illustration of a bar chart. The chart features four bars of varying heights, indicating growth or progress. The design is clean. A simple graphic illustration of a bar chart. The chart features four bars of varying heights, indicating growth or progress. The design is clean and minimalist, making it suitable for a wide range of applications such as presentations, reports, and infographics. The black bars stand out against the white background, providing a clear visual representation of data.
Free with trial Conceptual image illustrating falling rent prices. A wooden house and the word 'RENT' constructed from blocks are shown falling from the sky, accompanied by scattered coins. A large red arrow points downwards, emphasizing the downward trend. In the background, a city skyline emerges from a sea of clouds, bathed in the warm light of a sunset or sunrise. This image can be used to represent economic downturns, housing market fluctuations, or financial challenges related to renting. Investment decrease illustrations Falling Rent Prices Concept. Conceptual image illustrating falling rent prices. A wooden house and the word 'RENT' constructed from blocks are shown falling from. Conceptual image illustrating falling rent prices. A wooden house and the word 'RENT' constructed from blocks are shown falling from the sky, accompanied by scattered coins. A large red arrow points downwards, emphasizing the downward trend. In the background, a city skyline emerges from a sea of clouds, bathed in the warm light of a sunset or sunrise. This image can be used to represent economic downturns, housing market fluctuations, or financial challenges related to renting.
Free with trial Colorful Searching for food in trash can on streets outdoors icon isolated on white background. Homelessness and poverty concept. Square button. 3D render illustration. Investment decrease illustrations Colorful Searching for food in trash can on streets outdoors icon isolated on white background. Homelessness and poverty. Concept. Square button. 3D render
Free with trial White wooden arrow pointing down on yellow background. Business, market decline or economic. Close-up. Investment decrease illustrations White wooden arrow pointing down on yellow background. Business, market decline or economic. Close-up
Free with trial White wooden arrow pointing down on yellow background. Business, market decline or economic. Close-up. Investment decrease illustrations White wooden arrow pointing down on yellow background. Business, market decline or economic. Close-up
Free with trial Financial crisis concept with digital blue glowing downward candlestick. On dark background with dots. 3D rendering. Investment decrease illustrations Financial crisis concept with digital blue glowing downward candlestick. On dark background with dots. 3D rendering
Free with trial A row of colorful wooden blocks, resembling a bar graph, sits on a dark wooden surface. The blocks are various heights and colors, creating a visually appealing and potentially symbolic representation of growth or data. Investment decrease illustrations Colorful Wooden Blocks Chart. A row of colorful wooden blocks, resembling a bar graph, sits on a dark wooden surface. The blocks are various heights and colors. A row of colorful wooden blocks, resembling a bar graph, sits on a dark wooden surface. The blocks are various heights and colors, creating a visually appealing and potentially symbolic representation of growth or data.
Free with trial INR currency on the display board with red arrow down, 3d rendering. Investment decrease illustrations INR currency on the display board with red arrow down. 3d rendering
Free with trial Arrow up and down icon vector. Investment decrease vectors Arrow up and down icon vector. Arrow up and down vector
Free with trial Trend to go down chart line icon, world sanction concept. Vector graphics. Dollar currency graph, market pressure sign on white background, outline style icon for mobile or web design. Investment decrease vectors Trend to go down chart line icon, world sanction concept. Vector graphics. Dollar currency graph, market pressure sign. On white background, outline style icon. Trend to go down chart line icon, world sanction concept. Vector graphics. Dollar currency graph, market pressure sign on white background, outline style icon for mobile or web design
Free with trial Trend to go down chart thin line icon, world sanction concept. Vector graphics. Dollar currency graph, market pressure sign on white background, outline style icon for mobile or web design. Investment decrease vectors Trend to go down chart thin line icon, world sanction concept. Vector graphics. Dollar currency graph, market pressure. Sign on white background, outline style. Trend to go down chart thin line icon, world sanction concept. Vector graphics. Dollar currency graph, market pressure sign on white background, outline style icon for mobile or web design
Free with trial This image depicts a dramatic stock market decline, visualized as a falling graph in intense orange and red hues, generated by AI. The dark background emphasizes the severity of the downturn, suggesting potential financial instability or market volatility. The bokeh effect adds a sense of depth and. Investment decrease illustrations AI-Generated Stock Market Dip. This image depicts a dramatic stock market decline, visualized as a falling graph in intense orange and red hues, generated by AI. This image depicts a dramatic stock market decline, visualized as a falling graph in intense orange and red hues, generated by AI. The dark background emphasizes the severity of the downturn, suggesting potential financial instability or market volatility. The bokeh effect adds a sense of depth and
Free with trial EUR currency on the display board with red arrow down, 3d rendering. Investment decrease illustrations EUR currency on the display board with red arrow down. 3d rendering
Free with trial This image shows a red arrow sinking into clear water, creating a splash. The arrow, generated by AI, symbolizes a downward trend or decline, perhaps in market values or other metrics. The high-quality rendering emphasizes the impact and visual appeal. Investment decrease illustrations Red Arrow Plunging into Water. This image shows a red arrow sinking into clear water, creating a splash. The arrow, generated by AI, symbolizes a downward trend. This image shows a red arrow sinking into clear water, creating a splash. The arrow, generated by AI, symbolizes a downward trend or decline, perhaps in market values or other metrics. The high-quality rendering emphasizes the impact and visual appeal.
Free with trial Concept of inflation. With icons in cogwheels. Investment decrease illustrations Concept of inflation. With icons in cogwheels
Free with trial The red futuristic with neon lights background for the economic crisis, bearish trend. Hi-tech backdrop. Generative AI. Investment decrease illustrations The red futuristic with neon lights background for the economic crisis, a bearish trend. Hi-tech backdrop. Generative AI. The red futuristic with neon lights. The red futuristic with neon lights background for the economic crisis, bearish trend. Hi-tech backdrop. Generative AI
Free with trial The red futuristic with neon lights background for the economic crisis, bearish trend. Hi-tech backdrop. Generative AI. Investment decrease illustrations The red futuristic with neon lights background for the economic crisis, a bearish trend. Hi-tech backdrop. Generative AI. The red futuristic with neon lights. The red futuristic with neon lights background for the economic crisis, bearish trend. Hi-tech backdrop. Generative AI
Free with trial The red futuristic with neon lights background for the economic crisis, bearish trend. Hi-tech backdrop. Generative AI. Investment decrease illustrations The red futuristic with neon lights background for the economic crisis, a bearish trend. Hi-tech backdrop. Generative AI. The red futuristic with neon lights. The red futuristic with neon lights background for the economic crisis, bearish trend. Hi-tech backdrop. Generative AI
Free with trial Concept of inflation. With icons on speech bubbles. Investment decrease illustrations Concept of inflation. With icons on speech bubbles
Free with trial Concept of inflation. With connected icons. Investment decrease illustrations Concept of inflation. With connected icons
Free with trial Concept of inflation. With icons on circles. Investment decrease illustrations Concept of inflation. With icons on circles
Free with trial Two words low cost or high cost. Choose low cost on stacked wooden cubes on the table. Business and finance concept. Investment decrease illustrations Two words low cost or high cost. Choose low cost on stacked wooden cubes on the table. Business and finance concept
Free with trial Range or Levels Breakout vector Candlestick Chart colored seamless pattern. Investment decrease vectors Range or Levels Breakout vector Candlestick Chart colored seamless pattern. Range or Levels Breakout vector Candlestick Chart concept colored seamless pattern
Free with trial Flipping of wooden blocks with arrow up and down. Business planning for target achievement. Measure of performance for a specific objective. 3d render. Investment decrease illustrations Flipping of wooden blocks with arrow up and down. Business planning for target achievement. Measure of performance for a specific objective. 3d render
Free with trial Flipping of wooden blocks with arrow up and down. Business planning for target achievement. Measure of performance for a specific objective. 3d render. Investment decrease illustrations Flipping of wooden blocks with arrow up and down. Business planning for target achievement. Measure of performance for a specific objective. 3d render
Free with trial Financial and economic improvement during stock market crash, stabilization of foreign currency, financial instruments to increase income, fight against inflation, woman holding umbrella over dollar. Investment decrease vectors Woman holding umbrella over dollar. Financial and economic improvement during stock market crash, stabilization of foreign currency, financial instruments to. Financial and economic improvement during stock market crash, stabilization of foreign currency, financial instruments to increase income, fight against inflation, woman holding umbrella over dollar
Free with trial Hold positions during downturn in market activity, look into future to plan further actions, search for strategy for company's operation during economic instability, man with umbrella on falling graph. Investment decrease vectors Man with umbrella on falling graph. Hold positions during downturn in market activity, look into future to plan further actions, search for strategy for company'. Hold positions during downturn in market activity, look into future to plan further actions, search for strategy for company's operation during economic instability, man with umbrella on falling graph
Free with trial A digital screen shows a sharp decline in stock market indices, indicated by a red arrow and graph. Numbers flash, reflecting significant losses. Investment decrease illustrations Stock Market Crash. A digital screen shows a sharp decline in stock market indices, indicated by a red arrow and graph. Numbers flash, reflecting significant. A digital screen shows a sharp decline in stock market indices, indicated by a red arrow and graph. Numbers flash, reflecting significant losses
Free with trial Up vs down balance on economic scale. Balance on scale. Business Concept. Vector stock illustration. Investment decrease vectors Up vs down balance on economic scale. Balance on scale. Business Concept. Vector stock illustration
Free with trial Big purple arrow pointing down near stack of coins. Concept of financial crisis with big arrow pointing down near a stack of coins. Investment decrease vectors Big purple arrow pointing down near stack of coins. Concept of financial crisis with big arrow pointing down near a stack of coins
Free with trial Red 3d arrow going down stock icon on white background. Bankruptcy, financial market crash icon for your web site design, logo, app, UI. graph chart downtrend symbol. chart going down sign. Investment decrease vectors Red 3d arrow going down stock icon on white background. Bankruptcy, financial market crash icon for your web site design. Red 3d arrow going down stock icon on. Red 3d arrow going down stock icon on white background. Bankruptcy, financial market crash icon for your web site design, logo, app, UI. graph chart downtrend symbol.chart going down sign.
Free with trial Man Facing Stock Market Downturn. A man holding his head while looking at a falling stock market chart AI generated. Investment decrease illustrations Man Facing Stock Market Downturn. A man holding his head while looking at a falling stock market chart AI generated
Free with trial Businessmen team pushing banknotes to resist a red down arrow. Financial crisis and economic downturn. A minimal style of an effect of inflation, recession, bankruptcy, and financial failure. Investment decrease vectors Businessmen team pushing banknotes to resist a red down arrow. Financial crisis and economic downturn. A minimal style of an. Effect of inflation, recession. Businessmen team pushing banknotes to resist a red down arrow. Financial crisis and economic downturn. A minimal style of an effect of inflation, recession, bankruptcy, and financial failure
Free with trial This illustration, generated by AI, depicts a hand adding a coin to a piggy bank, set against a backdrop of a zigzagging graph representing economic fluctuation. It visually communicates the importance of consistent saving even during challenging economic times. Investment decrease illustrations Saving Through Economic Downturn. This illustration, generated by AI, depicts a hand adding a coin to a piggy bank, set against a backdrop of a zigzagging graph. This illustration, generated by AI, depicts a hand adding a coin to a piggy bank, set against a backdrop of a zigzagging graph representing economic fluctuation. It visually communicates the importance of consistent saving even during challenging economic times.
Free with trial Dollar banknote showing money inflation icon. Simple vector icon representing the concept of rising inflation affecting the value of money. Investment decrease illustrations Dollar banknote showing money inflation icon. Simple vector icon representing the concept of rising inflation affecting the value of money
Free with trial A businessman in a suit interacts with a digital interface illustrating the relationship between quality and cost. The image features a visual representation of increasing quality and decreasing cost, with checkmarks indicating positive outcomes. This concept is ideal for illustrating business strategies, efficiency, and financial planning. The scene includes a clipboard with charts, adding a professional context. Investment decrease illustrations Quality vs. Cost: Business Concept. A businessman in a suit interacts with a digital interface illustrating the relationship between quality and cost. The image. A businessman in a suit interacts with a digital interface illustrating the relationship between quality and cost. The image features a visual representation of increasing quality and decreasing cost, with checkmarks indicating positive outcomes. This concept is ideal for illustrating business strategies, efficiency, and financial planning. The scene includes a clipboard with charts, adding a professional context.
Free with trial Mountain Path Decline Arrow Icon. A symbolic illustration representing a journey's downturn or a business decline. Investment decrease vectors Mountain Path Decline Arrow Icon. A symbolic illustration representing a journey's downturn or a business decline
Free with trial USD dollar value decline and devaluation. Bar graph made of holes in yellow paper is revealing us dollar banknotes of decreasing values. 3d render. Investment decrease illustrations Us dollar decreasing value concept with bar graph on yellow background. USD dollar value decline and devaluation. Bar graph made of holes in yellow paper is. USD dollar value decline and devaluation. Bar graph made of holes in yellow paper is revealing us dollar banknotes of decreasing values. 3d render
Free with trial A clean, minimalist 3D render of a blue bar chart with a blue trend line connecting circular data points. The bars vary in height, illustrating growth and fluctuations. The background is a bright, clean white, emphasizing the chart's elements. This graphic is ideal for representing financial data, business growth, market trends, statistics, and performance analysis in a modern and professional style. Investment decrease illustrations 3D Blue Bar Chart with Trend Line. A clean, minimalist 3D render of a blue bar chart with a blue trend line connecting circular data points. The bars vary in. A clean, minimalist 3D render of a blue bar chart with a blue trend line connecting circular data points. The bars vary in height, illustrating growth and fluctuations. The background is a bright, clean white, emphasizing the chart's elements. This graphic is ideal for representing financial data, business growth, market trends, statistics, and performance analysis in a modern and professional style.
Free with trial This image depicts a white pillar with a red downward trending arrow, generated by AI. It symbolizes economic decline, market instability, or a negative trend in a specific industry. The clean, minimalist style emphasizes the severity of the drop. Investment decrease illustrations Falling Market Trend. This image depicts a white pillar with a red downward trending arrow, generated by AI. It symbolizes economic decline, market instability. This image depicts a white pillar with a red downward trending arrow, generated by AI. It symbolizes economic decline, market instability, or a negative trend in a specific industry. The clean, minimalist style emphasizes the severity of the drop.
Free with trial Open notebook displaying sales data with charts, graphs, and the word sales highlighted, illuminated by a desk lamp, symbolizing business analysis and strategy. Investment decrease illustrations Sales report with charts and graphs illuminated by desk lamp. Open notebook displaying sales data with charts, graphs, and the word sales highlighted. Open notebook displaying sales data with charts, graphs, and the word sales highlighted, illuminated by a desk lamp, symbolizing business analysis and strategy
Free with trial Save Big Bold Text Graphic Design. A bold graphic design featuring the words Save Big in a stylized font, ideal for promotional materials. Investment decrease illustrations Save Big Bold Text Graphic Design. A bold graphic design featuring the words Save Big in a stylized font, ideal for promotional materials
Free with trial Bull market icon. Simple bull market icon for social media, app, and web design. Vector illustration. Investment decrease vectors Bull Market Icon. Simple for social media, app, and web design. Vector illustration. Bull market icon. Simple bull market icon for social media, app, and web design. Vector illustration.
Free with trial Bear market icon. Simple bear market icon for social media, app, and web design. Vector illustration. Investment decrease vectors Bear Market Icon. Simple for social media, app, and web design. Vector illustration. Bear market icon. Simple bear market icon for social media, app, and web design. Vector illustration.
Free with trial Bull market icon. Simple bull market icon for social media, app, and web design. Vector illustration. Investment decrease vectors Bull Market Icon. Simple for social media, app, and web design. Vector illustration. Bull market icon. Simple bull market icon for social media, app, and web design. Vector illustration.
Free with trial Create a set of 16 vector icons related to finance and business. The style should be simple line art with a minimalist approach. Use a color palette of red and off-white/beige. The icons should include: shopping cart with upward arrow, various bar graphs (increasing and decreasing), piggy bank with coin, upward trending arrows, coins stack with upward arrow, dollar sign with gear, dollar sign in gear, calculator, bank building (classical style), torn dollar bill, credit card, cash money, and currency exchange (dollar and euro). Ensure clean lines and consistent spacing between icons. Investment decrease vectors Finance Icons: Vector Line Art Set. Create a set of 16 vector icons related to finance and business. The style should be simple line art with a minimalist. Create a set of 16 vector icons related to finance and business. The style should be simple line art with a minimalist approach. Use a color palette of red and off-white/beige. The icons should include: shopping cart with upward arrow, various bar graphs (increasing and decreasing), piggy bank with coin, upward trending arrows, coins stack with upward arrow, dollar sign with gear, dollar sign in gear, calculator, bank building (classical style), torn dollar bill, credit card, cash money, and currency exchange (dollar and euro). Ensure clean lines and consistent spacing between icons.
Free with trial Finance stock market crisis and chart arrow down red background. vector illustration fantastic technology. Investment decrease vectors Finance stock market crisis and chart arrow down red background. Vector illustration fantastic technology
Free with trial Download line icon. Neumorphic, Orange gradient, 3d pin buttons. Down arrow sign. Discount symbol. Line icons. Neumorphic buttons with outline signs. Vector. Investment decrease illustrations Download line icon. Down arrow sign. Line icons. Vector. Download line icon. Neumorphic, Orange gradient, 3d pin buttons. Down arrow sign. Discount symbol. Line. Download line icon. Neumorphic, Orange gradient, 3d pin buttons. Down arrow sign. Discount symbol. Line icons. Neumorphic buttons with outline signs. Vector
Free with trial Regression logo concept featuring a downward trending arrow. Logo concept featuring a downward trending arrow representing regression. Investment decrease vectors Regression logo concept featuring a downward trending arrow. Logo concept featuring a downward trending arrow representing regression
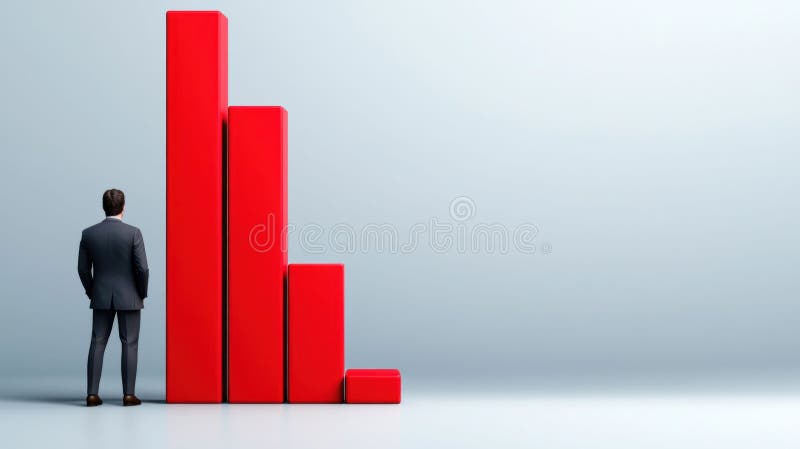
Free with trial Businessman Analyzing Declining Red Bar Chart. High quality illustration AI generated. Investment decrease illustrations Businessman Analyzing Declining Red Bar Chart. High quality illustration AI generated
Free with trial A stylized illustration depicts a bar chart with blue bars of varying heights against a dark blue grid background. A prominent red and yellow arrow, symbolizing a downward trend, dramatically descends across the chart. This graphic represents financial decline, market crash, economic recession, or negative growth. Its clean, vector-style design makes it suitable for presentations, reports, and articles on business, finance, and economics. Investment decrease illustrations Declining Bar Chart with Red Arrow. A stylized illustration depicts a bar chart with blue bars of varying heights against a dark blue grid background. A. A stylized illustration depicts a bar chart with blue bars of varying heights against a dark blue grid background. A prominent red and yellow arrow, symbolizing a downward trend, dramatically descends across the chart. This graphic represents financial decline, market crash, economic recession, or negative growth. Its clean, vector-style design makes it suitable for presentations, reports, and articles on business, finance, and economics.
Free with trial A simple, flat design graphic illustrating a downward trend in a graph. A stylized person with flames above their head is positioned below the declining line graph, symbolizing stress, loss, or a negative impact. Suitable for presentations, articles, or social media posts related to business performance, market analysis, personal development, or any situation involving a downward trend. The flat design makes it versatile and easily adaptable for various uses. Investment decrease vectors Declining Graph with Stressed Person. A simple, flat design graphic illustrating a downward trend in a graph. A stylized person with flames above their head is. A simple, flat design graphic illustrating a downward trend in a graph. A stylized person with flames above their head is positioned below the declining line graph, symbolizing stress, loss, or a negative impact. Suitable for presentations, articles, or social media posts related to business performance, market analysis, personal development, or any situation involving a downward trend. The flat design makes it versatile and easily adaptable for various uses.
Free with trial Wooden blocks with arrow up and down with percentage icon. Business planning for target achievement. Measure of performance for a specific objective. 3d render. Investment decrease illustrations Wooden blocks with arrow up and down with percentage icon. Business planning for target achievement. Measure of performance for a specific objective. 3d render
Free with trial Glowing neon line Global economic crisis icon isolated on blue background. World finance crisis. Vector. Investment decrease illustrations Glowing neon line Global economic crisis icon isolated on blue background. World finance crisis. Vector.
Free with trial Stabilizing economy during stock market downturn, financial improvement, finding survival strategy during crisis, solving problems of declining business value, man balancing on falling stack of coins. Investment decrease vectors Man balancing on falling stack of coins. Stabilizing economy during stock market downturn, financial improvement, finding survival strategy during crisis. Stabilizing economy during stock market downturn, financial improvement, finding survival strategy during crisis, solving problems of declining business value, man balancing on falling stack of coins
Free with trial Buy car loan icon doodle illustration. Buy car loan doodle icon sketch vector. buy car loan sign. isolated symbol illustration. Investment decrease illustrations Buy car loan icon doodle illustration. Buy car loan doodle icon sketch vector. buy car loan sign. isolated symbol illustration
Free with trial Abstract 3D rendering of a blue bar chart receding into the distance. The bars are arranged in descending order, suggesting a decline or downward trend. The reflective surface adds depth and visual interest, creating a clean and modern aesthetic. This image can be used to illustrate concepts such as financial downturn, market analysis, or statistical data representation. Investment decrease illustrations Abstract Blue Bar Chart. Abstract 3D rendering of a blue bar chart receding into the distance. The bars are arranged in descending order, suggesting a decline or. Abstract 3D rendering of a blue bar chart receding into the distance. The bars are arranged in descending order, suggesting a decline or downward trend. The reflective surface adds depth and visual interest, creating a clean and modern aesthetic. This image can be used to illustrate concepts such as financial downturn, market analysis, or statistical data representation.
Free with trial Strategy for surviving economic crisis, finding way out of business problems, maintaining financial position during stock market crash, risky investments, man tries not to fall from growing arrow. Investment decrease vectors Man tries not to fall from growing arrow. Strategy for surviving economic crisis, finding way out of business problems, maintaining financial position during. Strategy for surviving economic crisis, finding way out of business problems, maintaining financial position during stock market crash, risky investments, man tries not to fall from growing arrow
Free with trial Cityscape Stock Market Crash Overlay, stunning background Generative AI. Investment decrease illustrations Cityscape Stock Market Crash Overlay. Stunning background Generative AI
 Sign in