Free with trial The Economic Recession 3D Icon Render Clipart is a striking design of realistic and professional 3D illustrations that represent key elements of an economic downturn. Investment decrease vectors Economic Recession 3d icon render clipart. The Economic Recession 3D Icon Render Clipart is a striking design of realistic and professional 3D illustrations that. The Economic Recession 3D Icon Render Clipart is a striking design of realistic and professional 3D illustrations that represent key elements of an economic downturn.
Free with trial The Economic Recession 3D Icon Render Clipart is a striking design of realistic and professional 3D illustrations that represent key elements of an economic downturn. Investment decrease vectors Economic Recession 3d icon render clipart. The Economic Recession 3D Icon Render Clipart is a striking design of realistic and professional 3D illustrations that. The Economic Recession 3D Icon Render Clipart is a striking design of realistic and professional 3D illustrations that represent key elements of an economic downturn.
Free with trial The Economic Recession 3D Icon Render Clipart is a striking design of realistic and professional 3D illustrations that represent key elements of an economic downturn. Investment decrease vectors Economic Recession 3d icon render clipart. The Economic Recession 3D Icon Render Clipart is a striking design of realistic and professional 3D illustrations that. The Economic Recession 3D Icon Render Clipart is a striking design of realistic and professional 3D illustrations that represent key elements of an economic downturn.
Free with trial The Economic Recession 3D Icon Render Clipart is a striking design of realistic and professional 3D illustrations that represent key elements of an economic downturn. Investment decrease vectors Economic Recession 3d icon render clipart. The Economic Recession 3D Icon Render Clipart is a striking design of realistic and professional 3D illustrations that. The Economic Recession 3D Icon Render Clipart is a striking design of realistic and professional 3D illustrations that represent key elements of an economic downturn.
Free with trial The Economic Recession 3D Icon Render Clipart is a striking design of realistic and professional 3D illustrations that represent key elements of an economic downturn. Investment decrease vectors Economic Recession 3d icon render clipart. The Economic Recession 3D Icon Render Clipart is a striking design of realistic and professional 3D illustrations that. The Economic Recession 3D Icon Render Clipart is a striking design of realistic and professional 3D illustrations that represent key elements of an economic downturn.
Free with trial Businessman using hammer to nail percentage sign to the floor. Investment decrease vectors Businessman using hammer to nail percentage sign to the floor. Businessman using hammer to nail percentage sign to the floor
Free with trial A magnifying glass focuses on a digital graph featuring red and orange declining bars and lines, indicating stock market trends. The surrounding environment is filled with digital screens displaying similar financial data, creating an intense, analytical atmosphere. The image highlights the detailed examination of market fluctuations, with vibrant colors contrasting against a computerized background to emphasize the importance of precision in financial analysis. Investment decrease illustrations Stock Market Analysis: Magnifying Glass On Declining Graph. A magnifying glass focuses on a digital graph featuring red and orange declining bars and lines. A magnifying glass focuses on a digital graph featuring red and orange declining bars and lines, indicating stock market trends. The surrounding environment is filled with digital screens displaying similar financial data, creating an intense, analytical atmosphere. The image highlights the detailed examination of market fluctuations, with vibrant colors contrasting against a computerized background to emphasize the importance of precision in financial analysis.
Free with trial Red downward arrow symbolizing decline on a black background. High Quality. Investment decrease illustrations Red downward arrow symbolizing decline on a black background. High Quality
Free with trial Abstract red glowing arrow falling down fast, representing economic downturn, stock crash, negative growth, or crisis warning in modern business and financial industries. Investment decrease illustrations Dynamic glowing arrows pointing downward on dark background, symbolizing decline, loss, crisis, or business failure. Perfect for. Abstract red glowing arrow. Abstract red glowing arrow falling down fast, representing economic downturn, stock crash, negative growth, or crisis warning in modern business and financial industries
Free with trial A glowing red arrow depicting a downward trend rests on a blue digital data background illustrating market decline. Investment decrease illustrations Illuminated Red Downward Trend Graph Shows Market Decline. A glowing red arrow depicting a downward trend rests on a blue digital data background illustrating. A glowing red arrow depicting a downward trend rests on a blue digital data background illustrating market decline
Free with trial Red graph is rapidly declining, representing a market crash, with percentage and dollar signs indicating financial losses. Investment decrease illustrations Red graph showing market crashing down with percentage and dollar sign in background. Red graph is rapidly declining, representing a market crash, with. Red graph is rapidly declining, representing a market crash, with percentage and dollar signs indicating financial losses
Free with trial A businessman in a suit points to a red, downward-trending graph, symbolizing financial decline or economic downturn. The image conveys concepts of loss, risk, and market instability. The composition uses a shallow depth of field. Investment decrease illustrations Businessman\'s Hand Pointing Downward on Red Declining Financial Graph. A businessman in a suit points to a red, downward-trending graph, symbolizing financial. A businessman in a suit points to a red, downward-trending graph, symbolizing financial decline or economic downturn. The image conveys concepts of loss, risk, and market instability. The composition uses a shallow depth of field
Free with trial A businessman's hand gestures towards a red, downward-trending financial graph, symbolizing economic decline. The image conveys concepts of loss, failure, and financial instability. The lighting is soft, with a shallow depth of field. Investment decrease illustrations Businessman\'s Hand Pointing Downward at Red Declining Financial Graph. A businessman's hand gestures towards a red, downward-trending financial graph. A businessman's hand gestures towards a red, downward-trending financial graph, symbolizing economic decline. The image conveys concepts of loss, failure, and financial instability. The lighting is soft, with a shallow depth of field
Free with trial Up and down arrow icon set in generic style. Upward and downward concept. Upward and downward illustration concept. Investment decrease vectors Up and down arrow icon set in generic style. Upward and downward concept. Up and down arrow icon set in generic style. Upward and downward illustration concept
Free with trial Falling red chart arrow with piggy bank on white background. Economic recession, losing savings concept. 3D Rendering. Investment decrease illustrations Falling red chart arrow with piggy bank on white background. Economic recession, losing savings concept. 3D Rendering
Free with trial Vector cartoon 3d transfer icon. Cute realistic up down green and red arrow icon isolated on white background. 3d render exchange concept, plastic counter arrows for infographic, web, business app. Investment decrease vectors Vector cartoon 3d transfer icon. Cute realistic up down green and red arrow icon isolated on white background. 3d render. Exchange concept, plastic counter. Vector cartoon 3d transfer icon. Cute realistic up down green and red arrow icon isolated on white background. 3d render exchange concept, plastic counter arrows for infographic, web, business app.
Free with trial Decreasing bar chart icon in generic design. Market crash sign symbol. Illustration. Investment decrease vectors Decreasing bar chart icon in generic design. Market crash sign symbol. Illustration
Free with trial A businessman in a suit draws a red downward trend line, symbolizing financial loss or economic downturn. The image conveys concepts of business, finance, and market volatility. The lighting is soft, and the composition focuses on the hand and graph. Investment decrease illustrations Businessman\'s Hand Drawing Red Downward Graph, Economic Decline Concept. A businessman in a suit draws a red downward trend line, symbolizing financial loss or. A businessman in a suit draws a red downward trend line, symbolizing financial loss or economic downturn. The image conveys concepts of business, finance, and market volatility. The lighting is soft, and the composition focuses on the hand and graph
Free with trial Mortgage rates A pile of coins placed on the table together with interest rate illustrations. planning savings money of coins to buy a home concept for property, mortgage, real estate. Investment decrease illustrations Mortgage rates A pile of coins placed on the table together with interest rate illustrations. planning savings money of coins to. Buy a home concept for. Mortgage rates A pile of coins placed on the table together with interest rate illustrations. planning savings money of coins to buy a home concept for property, mortgage, real estate
Free with trial Gold coin with arrows pointing up and down, symbolizing the fluctuating nature of money and investments. Investment decrease vectors Gold coin with arrows pointing up and down indicating price fluctuation. Gold coin with arrows pointing up and down, symbolizing the fluctuating nature of money. Gold coin with arrows pointing up and down, symbolizing the fluctuating nature of money and investments
Free with trial Promotional eight percent graphic features a blue circle with white numerals Perfect for discounts and financial presentations. Investment decrease illustrations Eight Percent Graphic on Blue Circle for Discount Promotion. Promotional eight percent graphic features a blue circle with white numerals Perfect for discounts. Promotional eight percent graphic features a blue circle with white numerals Perfect for discounts and financial presentations
Free with trial Stock market crash showing falling prices on digital screens. Red digital ticker displays showing falling stock exchange prices during volatile trading. Investment decrease illustrations Stock market crash showing falling prices on digital screens. Red digital ticker displays showing falling stock exchange prices during volatile trading
Free with trial Businessman success to reduce costs concept vector illustration. Businessman success to reduce costs concept vector. Investment decrease vectors Businessman success to reduce costs concept vector illustration. Businessman success to reduce costs concept vector
Free with trial Black and white icon of a dollar banknote with one arrow pointing up and one arrow pointing down, representing money transfer. Investment decrease vectors Dollar banknote with up and down arrows icon representing money transfer. Black and white icon of a dollar banknote with one arrow pointing up and one arrow. Black and white icon of a dollar banknote with one arrow pointing up and one arrow pointing down, representing money transfer
Free with trial Red stock market chart showing decreasing values, concept of financial crisis and economic recession. Investment decrease illustrations Stock market crash showing decreasing values with red numbers. Red stock market chart showing decreasing values, concept of financial crisis and economic. Red stock market chart showing decreasing values, concept of financial crisis and economic recession
Free with trial Bear and Bull Stare Down in Digital Light, Market Competition , dynamic flow. Investment decrease illustrations Bear and Bull Stare Down in Digital Light, Market Competition. Dynamic flow
Free with trial Set of economic crisis icons. Thin linear style icons Pack. Vector Illustration Outline icons collection. Investment decrease vectors Set of economic crisis icons. Thin linear style icons Pack. Vector Illustration. Outline icons collection
Free with trial Declining red bar graph shown with a falling red arrow directed towards a grey building against a bright white background, symbolizing financial loss or economic downturn for business concepts. Investment decrease illustrations Falling Red Bar Graph with Grey Building on White Background. Declining red bar graph shown with a falling red arrow directed towards a grey building against a. Declining red bar graph shown with a falling red arrow directed towards a grey building against a bright white background, symbolizing financial loss or economic downturn for business concepts
Free with trial Illustration of a distressed cartoon businessman in a suit holding his head, surrounded by financial symbols, a red graph showing a decline, and currency. Represents financial stress, crisis, and business problems. Investment decrease illustrations Stressed cartoon businessman holding head with financial downturn concept. Illustration of a distressed cartoon businessman in a suit holding his head. Illustration of a distressed cartoon businessman in a suit holding his head, surrounded by financial symbols, a red graph showing a decline, and currency. Represents financial stress, crisis, and business problems.
Free with trial This image displays a dynamic business analytics dashboard featuring both bar and line graphs. The bar chart illustrates varying percentages (15%, 50%, 75%, 85%), suggesting performance metrics or growth stages. The line chart, with its intersecting blue lines and data points, represents trends, fluctuations, and comparisons over time or across different categories. The clean, modern design makes it ideal for financial reports, business presentations, and data visualization concepts. Investment decrease illustrations Business Growth and Performance Analysis with Bar and Line Charts. This image displays a dynamic business analytics dashboard featuring both bar and line graphs. This image displays a dynamic business analytics dashboard featuring both bar and line graphs. The bar chart illustrates varying percentages (15%, 50%, 75%, 85%), suggesting performance metrics or growth stages. The line chart, with its intersecting blue lines and data points, represents trends, fluctuations, and comparisons over time or across different categories. The clean, modern design makes it ideal for financial reports, business presentations, and data visualization concepts.
Free with trial A hand manipulates a red arrow pointing downwards, superimposed on a bar graph, illustrating a market downturn. This image, generated by AI, symbolizes economic recession, financial crisis, or business failure, showcasing the impact of negative trends. Investment decrease illustrations Declining Market Trend. A hand manipulates a red arrow pointing downwards, superimposed on a bar graph, illustrating a market downturn. This image, generated by. A hand manipulates a red arrow pointing downwards, superimposed on a bar graph, illustrating a market downturn. This image, generated by AI, symbolizes economic recession, financial crisis, or business failure, showcasing the impact of negative trends.
Free with trial Red descending arrow signifies a negative trend or decrease against a clean white backdrop Use it for economic or statistical presentations. Investment decrease illustrations Red Arrow Illustrating a Decreasing Trend on a White Background. Red descending arrow signifies a negative trend or decrease against a clean white backdrop Use. Red descending arrow signifies a negative trend or decrease against a clean white backdrop Use it for economic or statistical presentations
Free with trial Two burning candles on dark surface with red stock market graph, high-resolution background Generative AI. Investment decrease illustrations Two burning candles on dark surface with red stock market graph. High-resolution background Generative AI
Free with trial Uptrend and downtrend arrow icon in generic style. Zigzag arrows concept. Zigzag arrows illustration concept. Investment decrease vectors Uptrend and downtrend arrow icon in generic style. Zigzag arrows concept. Uptrend and downtrend arrow icon in generic style. Zigzag arrows illustration concept
Free with trial Falling red arrows intersect with a black digital display board showing financial information, creating a dramatic and concerning mood ideal for illustrating market decline or economic downturn. Investment decrease illustrations Red Arrows Indicating Falling Prices on Digital Display Board. Falling red arrows intersect with a black digital display board showing financial information. Falling red arrows intersect with a black digital display board showing financial information, creating a dramatic and concerning mood ideal for illustrating market decline or economic downturn
Free with trial A graph with a line that is slanted and has a lot of peaks and valleys. The graph is on a white background. Investment decrease illustrations A graph with a line that is slanted and has a lot of peaks and valleys. The graph is on a white background
Free with trial This image depicts a close-up of a hand using a pen to review detailed financial data, generated by AI. The image emphasizes precision and attention to detail in financial analysis. The cool blue tones enhance the professional and analytical nature of the task. Investment decrease illustrations Analyzing Financial Data. This image depicts a close-up of a hand using a pen to review detailed financial data, generated by AI. The image emphasizes precision. This image depicts a close-up of a hand using a pen to review detailed financial data, generated by AI. The image emphasizes precision and attention to detail in financial analysis. The cool blue tones enhance the professional and analytical nature of the task.
Free with trial Three miniature apartment building models are shown against a backdrop of a stock market graph illustrating real estate trends. Investment decrease illustrations Apartment Building Models Illustrate Real Estate Market Trends. Three miniature apartment building models are shown against a backdrop of a stock market graph. Three miniature apartment building models are shown against a backdrop of a stock market graph illustrating real estate trends
Free with trial Stock market crash showing falling prices on digital display in trading room. Falling stock exchange prices showing a financial crisis on a digital screen. Investment decrease illustrations Stock market crash showing falling prices on digital display in trading room. Falling stock exchange prices showing a financial crisis on a digital screen
Free with trial A visual representation of negative financial performance, illustrating a declining trend in business or market data with a prominent red arrow indicating a downward movement. Investment decrease illustrations Bar chart showing a downward trend with a red arrow. A visual representation of negative financial performance, illustrating a declining trend in business or. A visual representation of negative financial performance, illustrating a declining trend in business or market data with a prominent red arrow indicating a downward movement
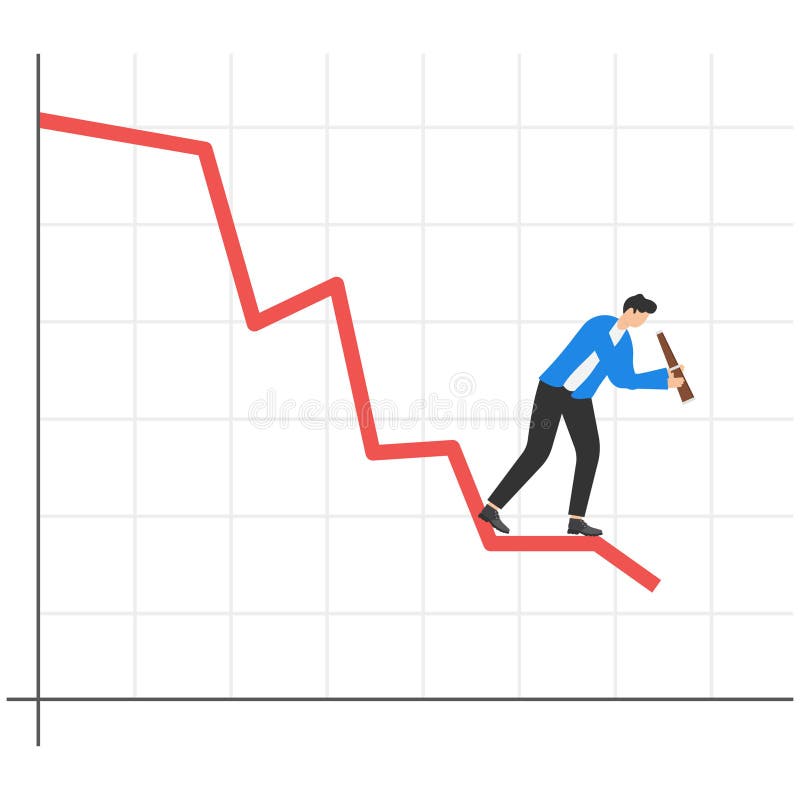
Free with trial Businessman standing on a falling down red graph looks for the bottom. Investment decrease vectors Businessman standing on a falling down red graph looks for the bottom. Businessman standing on a falling down red graph looks for the bottom
Free with trial Stock market graph displaying downward trend with red indicators. Generative AI. Investment decrease illustrations Stock market graph displaying downward trend with red indicators. Generative AI
Free with trial Profit Icon Line Design Style Simple Business and Financial Vector. Perfect Symbol. Investment decrease vectors Profit Icon Line Design Style Simple Business and Financial Vector. Perfect Symbol
Free with trial A cartoon bear in a suit represents a bear market, with a downward trending graph and coins, symbolizing financial loss and economic recession. Investment decrease illustrations Bear Market Illustration - Financial Downturn and Economic Recession. A cartoon bear in a suit represents a bear market, with a downward trending graph and coins. A cartoon bear in a suit represents a bear market, with a downward trending graph and coins, symbolizing financial loss and economic recession
Free with trial Abstract financial graph fluctuating over dark textured surface Images are created using AI. Investment decrease illustrations Abstract financial graph fluctuating over dark textured surface. Images are created using AI
Free with trial White stone arrow pointing right on pink backdrop. Direction guide. Close-up. Investment decrease illustrations White stone arrow pointing right on pink backdrop. Direction guide. Close-up
Free with trial Financial bar chart icon with up and down arrow. Economic growth and decline symbol in black circle. Investment decrease vectors Financial bar chart with up and down arrow. Economic growth and decline symbol in black circle. Financial bar chart icon with up and down arrow. Economic growth. Financial bar chart icon with up and down arrow. Economic growth and decline symbol in black circle
Free with trial Financial concept image featuring a blue bar chart with a red downward arrow, illustrating decline, recession, or loss over time. Ideal for presentations, reports, infographics, economic forecasts, and business documentation. Clean, clear, and professional visual, created ai. Investment decrease illustrations Business bar chart showing financial decline with downward arrow. Financial concept image featuring a blue bar chart with a red downward arrow, illustrating. Financial concept image featuring a blue bar chart with a red downward arrow, illustrating decline, recession, or loss over time. Ideal for presentations, reports, infographics, economic forecasts, and business documentation. Clean, clear, and professional visual, created ai.
Free with trial Percentage sign with circular arrows indicating exchange or cycle. AI generated. Investment decrease vectors Percentage sign with circular arrows indicating exchange or cycle. AI generated
Free with trial Stack of gold dollar coins with a big green arrow pointing down, illustrating the concept of a market crash. Investment decrease vectors Big green arrow pointing down next to stack of golden coins indicating market crash. Stack of gold dollar coins with a big green arrow pointing down. Stack of gold dollar coins with a big green arrow pointing down, illustrating the concept of a market crash
Free with trial Business chart is displaying market data analytics with a candlestick chart, pie chart and line graph. Investment decrease vectors Business chart displaying market data analytics with candlestick chart, pie chart and line graph. Business chart is displaying market data analytics with a. Business chart is displaying market data analytics with a candlestick chart, pie chart and line graph
Free with trial Stockbrokers reacting to market crash on wall street. Stockbrokers reacting to red stock market crash, observing falling graphs and financial news. Investment decrease illustrations Stockbrokers reacting to market crash on wall street. Stockbrokers reacting to red stock market crash, observing falling graphs and financial news
Free with trial Business banner red, decreasing pointing down red and black arrows business composition. On red backdrop banner. Investment decrease vectors Business banner red, decreasing pointing down red and black arrows business composition. On red backdrop banner
Free with trial A laptop on a table with a digital financial graph overlay displaying fluctuating lines The screen is off, and the indoor setting suggests an office or study room For Social Media Post Size. Investment decrease illustrations Laptop on desk with overlayed fluctuating digital financial graph. A laptop on a table with a digital financial graph overlay displaying fluctuating lines The. A laptop on a table with a digital financial graph overlay displaying fluctuating lines The screen is off, and the indoor setting suggests an office or study room For Social Media Post Size
Free with trial Up and down graph icon in line style. Outline bar chart with uptrend and downtrend arrow symbol. Vector. Investment decrease vectors Up and down graph icon in line style. Outline bar chart with uptrend and downtrend arrow symbol. Vector
Free with trial Hand holding house icon with rising percentage graph and interes. Hand holding a house icon with a rising graph and percentage symbols indicating interest rates. Investment decrease illustrations Hand holding house icon with rising percentage graph and interes. Hand holding a house icon with a rising graph and percentage symbols indicating interest rates
Free with trial A stack of yellow coins decreasing in height with red downward arrow symbolizes global financial loss or economic decline. Generative AI. Investment decrease illustrations Stack of yellow coins decreasing in height with red downward arrow. Generative AI. A stack of yellow coins decreasing in height with red downward arrow. A stack of yellow coins decreasing in height with red downward arrow symbolizes global financial loss or economic decline. Generative AI
Free with trial White stone arrow pointing right on black backdrop. Direction guide. Close-up. Investment decrease illustrations White stone arrow pointing right on black backdrop. Direction guide. Close-up
Free with trial Creative security padlock on red forex chart background. Financial recess and data protection concept. 3D Rendering. Investment decrease illustrations Creative security padlock on forex chart background. Financial recess and data protection concept. 3D Rendering. Creative security padlock on red forex chart. Creative security padlock on red forex chart background. Financial recess and data protection concept. 3D Rendering
Free with trial 3D rendering of declining bar and line graphs over a grid background. Investment decrease illustrations 3D rendering of declining bar and line graphs over a grid background. AI generated. 3D rendering of declining bar and line graphs over a grid background..
Free with trial Dollar price up and down icon on circle background. USD currency growth and decline sign symbol. Vector. Investment decrease vectors Dollar price up and down icon on circle background. USD currency growth and decline sign symbol. Vector
Free with trial This image features a vibrant 3D representation of a bar chart, composed of translucent, glowing blocks in shades of pink, yellow, and cyan. The bars are arranged in varying heights, suggesting growth or data representation. The background is a dark green digital grid with subtle light effects and floating particles, creating a futuristic and technological atmosphere. This visual is ideal for concepts related to finance, data analysis, technology, growth, and digital trends. Investment decrease illustrations Abstract 3D Bar Chart with Neon Glow on Green Digital Background. This image features a vibrant 3D representation of a bar chart, composed of translucent. This image features a vibrant 3D representation of a bar chart, composed of translucent, glowing blocks in shades of pink, yellow, and cyan. The bars are arranged in varying heights, suggesting growth or data representation. The background is a dark green digital grid with subtle light effects and floating particles, creating a futuristic and technological atmosphere. This visual is ideal for concepts related to finance, data analysis, technology, growth, and digital trends.
Free with trial Doodle style bar and line graph icon representing growth and analytics. AI generated. Investment decrease vectors Doodle style bar and line graph icon representing growth and analytics. AI generated
Free with trial Illustration representing the concept of economic recession with a red arrow and a money bag. Investment decrease vectors Red arrow pointing down next to money bag with dollar sign illustrating market crash. Illustration representing the concept of economic recession with a red. Illustration representing the concept of economic recession with a red arrow and a money bag
Free with trial Uptrend and downtrend arrow icon on circle background. Zigzag arrows illustration concept. Investment decrease vectors Uptrend and downtrend arrow icon on circle background. Zigzag arrows concept. Uptrend and downtrend arrow icon on circle background. Zigzag arrows illustration. Uptrend and downtrend arrow icon on circle background. Zigzag arrows illustration concept
Free with trial Man Views Red Green Financial Data On Screen At Desk For Analysis , monochrome style. Investment decrease illustrations Man Views Red Green Financial Data On Screen At Desk For Analysis. Monochrome style
Free with trial Red falling financial stock market chart and line graph showing economic crash crisis and profit loss down. Trend. Investment decrease illustrations Red falling financial stock market chart and line graph showing economic crash crisis and profit loss down. Trend
Free with trial This striking image depicts a downward-pointing arrow composed of fragmented red and white blocks, generated by AI. The red blocks represent a decline, while the white blocks symbolize a potential recovery or past stability. The visual metaphor powerfully conveys market instability and potential col. Investment decrease illustrations Market Crash Visualization. This striking image depicts a downward-pointing arrow composed of fragmented red and white blocks, generated by AI. The red blocks. This striking image depicts a downward-pointing arrow composed of fragmented red and white blocks, generated by AI. The red blocks represent a decline, while the white blocks symbolize a potential recovery or past stability. The visual metaphor powerfully conveys market instability and potential col
Free with trial Digital stock market ticker displaying falling financial data against urban twilight backdrop, highlighting market decline. Investment decrease illustrations Red digital stock market ticker showing decreasing values, located outdoors in a modern city at dusk. Digital stock market ticker displaying falling financial. Digital stock market ticker displaying falling financial data against urban twilight backdrop, highlighting market decline
Free with trial A red, dotted world globe is overlaid with a declining stock market chart, symbolizing a global economic downturn. The image conveys financial crisis and market volatility. Investment decrease illustrations Global Market Downturn: Red World Globe with Declining Stock Chart. A red, dotted world globe is overlaid with a declining stock market chart, symbolizing a. A red, dotted world globe is overlaid with a declining stock market chart, symbolizing a global economic downturn. The image conveys financial crisis and market volatility
Free with trial Green Energy Savings Piggy Bank Concept. An illustrative concept of saving money on energy costs. Investment decrease vectors Green Energy Savings Piggy Bank Concept. An illustrative concept of saving money on energy costs
Free with trial Barrel oil with stock charts of oil price quotes. Generative AI. Investment decrease illustrations Barrel oil with stock charts of oil price quotes. Generative AI
Free with trial High total cost icon vector. Image. Thin Outline Vector illustration isolated on background. Investment decrease vectors High total cost icon vector. Image. Thin Outline Vector illustration isolated on background
Free with trial High total cost icon vector. Image. Thin Outline Vector illustration isolated on background. Investment decrease vectors High total cost icon vector. Image. Thin Outline Vector illustration isolated on background
Free with trial High total cost icon vector. Image. Thin Outline Vector illustration isolated on background. Investment decrease vectors High total cost icon vector. Image. Thin Outline Vector illustration isolated on background
Free with trial High total cost icon vector. Image. Thin Outline Vector illustration isolated on background. Investment decrease illustrations High total cost icon vector. Image. Thin Outline Vector illustration isolated on background
Free with trial High total cost icon vector. Image. Thin Outline Vector illustration isolated on background. Investment decrease vectors High total cost icon vector. Image. Thin Outline Vector illustration isolated on background
Free with trial White stone arrow pointing right on yellow backdrop. Direction guide. Close-up. Investment decrease illustrations White stone arrow pointing right on yellow backdrop. Direction guide. Close-up
Free with trial Stock market chart showing a downward trend with red and green candlesticks indicating price fluctuations. A moving average line overlays the candlesticks. Volume bars at the bottom correlate with trading activity, mostly red, suggesting higher selling pressure. Vertical axis shows price levels, and horizontal axis depicts time. The chart originates from Cendlewe (Bearits). Candlestick shapes and colors represent price movements over time, with red indicating a decrease and green an increase. Investment decrease illustrations Dynamic stock market chart shows downward trend with red and green candlesticks and volume bars. Stock market chart showing a downward trend with red and green. Stock market chart showing a downward trend with red and green candlesticks indicating price fluctuations. A moving average line overlays the candlesticks. Volume bars at the bottom correlate with trading activity, mostly red, suggesting higher selling pressure. Vertical axis shows price levels, and horizontal axis depicts time. The chart originates from Cendlewe (Bearits). Candlestick shapes and colors represent price movements over time, with red indicating a decrease and green an increase.
Free with trial A businessperson looking at declining financial charts. During a recession. Investment decrease illustrations A businessperson looking at declining financial charts. During a recession
 Sign in