Free with trial Red arrow going down stock with euro coin icon on white background. Bankruptcy, financial market crash icon for your web site design, logo, app, UI. graph chart downtrend symbol. chart going down. Low decrease vectors Red arrow going down stock with euro coin icon on white background. Bankruptcy, financial market crash icon for your web
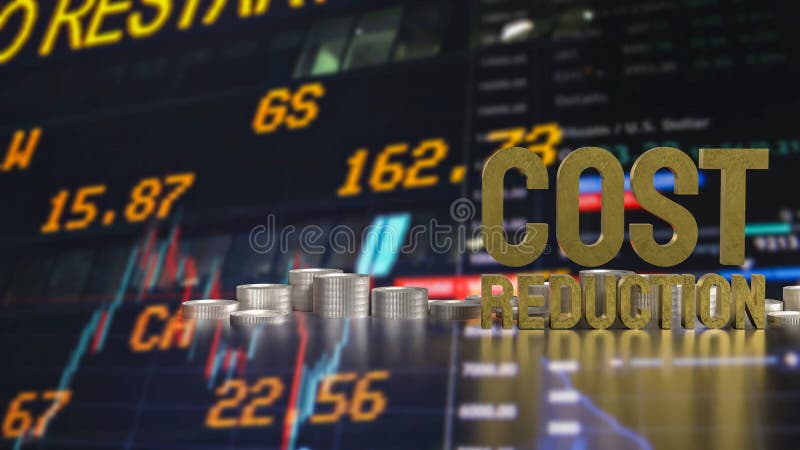
Free with trial The Cost reduction and coins for Business concept 3d rendering. Low decrease illustrations The Cost reduction and coins for Business concept 3d rendering
Free with trial The Cost reduction and coins for Business concept 3d rendering. Low decrease illustrations The Cost reduction and coins for Business concept 3d rendering
Free with trial 3d isometric illustration of a blue line graph decreasing over grey bars, representing a negative trend. Low decrease vectors Blue line decreasing over grey bars showing negative trend. 3d isometric illustration of a blue line graph decreasing over grey bars, representing a negative trend
Free with trial This striking image showcases a modern city designed with a unique artistic touch featuring a circle of orange lines. These lines symbolize the integration of renewable energy sources like solar and wind power that are essential for achieving a sustainable urban environment. By harnessing clean energy, we can markedly decrease carbon emissions, paving the way for a greener, low-carbon future that. Low decrease illustrations Exploring the Impact of Renewable Energy Solutions on Urban Landscapes with Orange Circular Patterns. This striking image showcases a modern city designed with a unique artistic touch featuring a circle of orange lines. These lines symbolize the integration of renewable energy sources like solar and wind power that are essential for achieving a sustainable urban environment. By harnessing clean energy, we can markedly decrease carbon emissions, paving the way for a greener, low-carbon future that
Free with trial A businessman in suit pushing a percent sign for your needs. Concept for online bank or your finance company. Special offer, sale, gift. Vector illustration. Low decrease vectors A businessman in suit pushing a percent sign for your needs. Concept for online bank or your finance company. Special
Free with trial Luxury concrete inscription tax free fallen, soft light, front view smooth background, 3d rendering. Low decrease illustrations Luxury concrete inscription tax free fallen, soft light, smooth background, 3d rendering
Free with trial Footprint with CO2 text and a downward arrow next to it. Ideal for carbon emissions, sustainability, eco-friendly practices, environmental awareness, climate change. Simple vector style. Low decrease vectors Reducing Carbon Footprint Awareness with Downward Trend Graph Icon and CO2 Label. Footprint with CO2 text and a downward arrow next to it. Ideal for carbon emissions, sustainability, eco-friendly practices, environmental awareness, climate change. Simple vector style.
Free with trial CO2 emission reduction concept. green CO2 emission symbol representing carbon footprint awareness, net zero and carbon neutrality. Climate change, Global warming, Greenhouse gas. Low decrease illustrations CO2 emission reduction concept. green CO2 emission symbol representing carbon footprint awareness, net zero and carbon neutrality
Free with trial Speedometer showing slow speed with red arrow pointing down isometric icon. Low decrease vectors Speedometer showing slow speed with red arrow pointing down
Free with trial Collagen production in women based on age. Medical, healthcare infographics. Important information. Menopause problem. Editable vector illustration isolated on a white background. Horizontal banner. Low decrease vectors Collagen production in women based on age.
Free with trial Economic Loss icon Black line art vector in black and white outline set collection sign. Low decrease vectors Economic Loss icon Black line art vector
Free with trial The image depicts a financial chart displaying price movements over time. It features candlestick bars in blue and yellow, indicating price changes, with a red line representing a moving average. The x-axis represents time, while the y-axis represents price. Low decrease illustrations A detailed financial chart showing price movements over time with candlestick bars and moving average line. The image depicts a financial chart displaying price movements over time. It features candlestick bars in blue and yellow, indicating price changes, with a red line representing a moving average. The x-axis represents time, while the y-axis represents price
Free with trial Mortgage rates business concept of investment housing real estate interest rates 3d home appraisal. planning savings money of coins to buy a home concept for property ladder, mortgage, real estate. Low decrease illustrations Mortgage rates business concept of investment housing real estate interest rates 3d home appraisal. planning savings money of
Free with trial Collagen production in women based on age. Medical, healthcare infographics. Important information. Menopause problem. Editable vector illustration isolated on a white background. Horizontal banner. Low decrease vectors Collagen production in women based on age.
Free with trial Co2 gas carbon dioxide icon Black line art vector in black and white outline set collection sign. Low decrease vectors Co2 gas carbon dioxide icon Black line art vector logo. co2 gas carbon dioxide icon Black line art vector in black and white outline set collection sign
Free with trial Bar graph depicting a decline, representing economic downturn, stock market decline, and company insolvency with a dropping red arrow. Low decrease vectors Bar chart illustrating a downward trend, symbolizing financial loss, market crash, and business failure with a falling red arrow. Bar graph depicting a decline, representing economic downturn, stock market decline, and company insolvency with a dropping red arrow
Free with trial Red 3d arrow going down stock icon on white background. Bankruptcy, financial market crash icon for your web site design, logo, app, UI. graph chart downtrend symbol. chart going down sign. Low decrease vectors Red 3d arrow going down stock icon on white background. Bankruptcy, financial market crash icon for your web site design
Free with trial Visual representation of a sharp economic downturn. Red bars and declining graphs depict financial loss and market crash. Represents recession, investment risk, and a negative economic trend. Low decrease illustrations Stock market crash chart financial crisis economic recession investment loss downtrend graph red bars decline. Visual representation of a sharp economic downturn. Red bars and declining graphs depict financial loss and market crash. Represents recession, investment risk, and a negative economic trend.
Free with trial Percent down icon Thin line illustration set. Low decrease vectors Percent down icon Flat vector set outline. Percent down icon Thin line illustration set
Free with trial Cardboard box with percentage decreases cost graphic vector illustration. Low decrease vectors Cardboard box with percentage decreases cost graphic vector illustration
Free with trial Economic critical crisis concept. The bar graph on red world map background. Recession financial, cryptocurrency, gold, and the stock market. Losing money and cash. Bearish. Low decrease vectors Economic critical crisis concept. The bar graph on red world map background. Recession financial, cryptocurrency, gold, and the
Free with trial Environmental benefits of biogas production. CO2 reduction icon. The globe with leaves and the arrow shows a lower carbon dioxide pollution level. Vector illustration isolated on a white background. Low decrease vectors Environmental benefits icon, CO2 reduction. Environmental benefits of biogas production. CO2 reduction icon. The globe with leaves and the arrow shows a lower carbon dioxide pollution level. Vector illustration isolated on a white background
Free with trial Red blood cells, leukocytes and platelets. Circulation seen from the front. Low decrease illustrations 3D illustration of the anatomical interior of an artery or vein with the movement of the blood components. Red blood cells, leukocytes and platelets. Circulation seen from the front.
Free with trial Red blood cells, leukocytes and platelets. Circulation seen from the front. Low decrease illustrations 3D illustration of the anatomical interior of an artery or vein with the movement of the blood components. Red blood cells, leukocytes and platelets. Circulation seen from the front.
Free with trial Cost reduction icon vector logo set collection or bundle pack group. Low decrease vectors Cost reduction vector logo set collection for web app ui. Cost reduction icon vector logo set collection or bundle pack group
Free with trial Business Woman hands typing on laptop with digital falling bar chart and cost percentage icon. Concept of financial cost reduction, business expense management and economic crisis strategy. Low decrease illustrations Business Woman hands typing on laptop with digital falling bar chart and cost percentage icon. Concept of financial cost reduction
Free with trial Percent down icon vector logo set collection for web app ui. Low decrease vectors Percent down icon Thin line illustration set. Percent down icon vector logo set collection for web app ui
Free with trial Man holding pen making a down arrow on virtual screen. Cost reduction concept. Low decrease illustrations Man holding pen making a down arrow on virtual screen. Cost reduction concept
Free with trial CO2 reduction icon. The globe with leaves and the arrow shows a lower carbon dioxide pollution level. Environmental benefits of biogas production. Vector illustration isolated on a white background. Low decrease vectors CO2 reduction vector icon, globe with leaves. CO2 reduction icon. The globe with leaves and the arrow shows a lower carbon dioxide pollution level. Environmental benefits of biogas production. Vector illustration isolated on a white background
Free with trial Cropped image on white background, with part of the circulating blood floating in the air. Low decrease illustrations 3D illustration of artery or vein with the movement of red blood cells. Cropped image on white background, with part of the circulating blood floating in the air.
Free with trial Cropped image on white background, with part of the circulating blood floating in the air. Low decrease illustrations 3D illustration of artery or vein with the movement of red blood cells. Cropped image on white background, with part of the circulating blood floating in the air.
Free with trial Economic critical crisis concept. The lower line graph and shiny on red background. Recession financial, cryptocurrency, gold, and the stock market. Losing money and cash. Bearish. Low decrease vectors Economic critical crisis concept. The lower line graph and shiny on red background. Recession financial, cryptocurrency, gold, and
Free with trial 3D isometric business chart showing a downward trend with a red arrow and colorful bar graphs on a grid background, isolated on white. Low decrease illustrations 3D isometric business chart showing a downward trend with a red arrow and colorful bar graphs on a grid background, isolated on
Free with trial Devolution, scissors cutting a banknote, financial crisis, cost or value reduction. Low decrease illustrations Devolution, scissors cutting a banknote, financial crisis, cost or value reduction
Free with trial Deflation line icon. Economic crisis sign. Vector illustration. Low decrease vectors Deflation line icon. Economic crisis sign
Free with trial Energy reduction icon Vector symbol or sign set collection in black and white outline. Low decrease vectors Energy reduction flat line icon set. Energy reduction Thin line illustration vector. Energy reduction icon Vector symbol or sign set collection in black and white outline
Free with trial A glowing red zigzag arrow points downward, representing a decline on a digital financial chart. The surface is gridded and dark, highlighting the red of the arrow. The arrow has a neon-like appearance and reflects off the glossy surface, signaling a decrease in value. The surrounding chart includes descending graphical elements indicating fluctuating data, conveying a downturn in financial performance or market trends. Low decrease illustrations A large red arrow points downwards over a gridded financial chart showing a sharp decline in value. A glowing red zigzag arrow points downward, representing a decline on a digital financial chart. The surface is gridded and dark, highlighting the red of the arrow. The arrow has a neon-like appearance and reflects off the glossy surface, signaling a decrease in value. The surrounding chart includes descending graphical elements indicating fluctuating data, conveying a downturn in financial performance or market trends.
Free with trial A glowing red zigzag arrow points downward, representing a decline on a digital financial chart. The surface is gridded and dark, highlighting the red of the arrow. The arrow has a neon-like appearance and reflects off the glossy surface, signaling a decrease in value. The surrounding chart includes descending graphical elements indicating fluctuating data, conveying a downturn in financial performance or market trends. Low decrease illustrations A large red arrow points downwards over a gridded financial chart showing a sharp decline in value. A glowing red zigzag arrow points downward, representing a decline on a digital financial chart. The surface is gridded and dark, highlighting the red of the arrow. The arrow has a neon-like appearance and reflects off the glossy surface, signaling a decrease in value. The surrounding chart includes descending graphical elements indicating fluctuating data, conveying a downturn in financial performance or market trends.
Free with trial A glowing red zigzag arrow points downward, representing a decline on a digital financial chart. The surface is gridded and dark, highlighting the red of the arrow. The arrow has a neon-like appearance and reflects off the glossy surface, signaling a decrease in value. The surrounding chart includes descending graphical elements indicating fluctuating data, conveying a downturn in financial performance or market trends. Low decrease illustrations A large red arrow points downwards over a gridded financial chart showing a sharp decline in value. A glowing red zigzag arrow points downward, representing a decline on a digital financial chart. The surface is gridded and dark, highlighting the red of the arrow. The arrow has a neon-like appearance and reflects off the glossy surface, signaling a decrease in value. The surrounding chart includes descending graphical elements indicating fluctuating data, conveying a downturn in financial performance or market trends.
Free with trial 3d rendering red arrow crashing ground with financial chart background. Concept of stock market crash, economic recession and investment loss in dark blue tone. Generative AI. Low decrease illustrations 3d rendering red arrow crashing ground with financial chart background Concept of stock market crash economic recession and. 3d rendering red arrow crashing. 3d rendering red arrow crashing ground with financial chart background. Concept of stock market crash, economic recession and investment loss in dark blue tone. Generative AI
Free with trial Cost reduction concept. Quality increase and cost optimization, Hands typing on a laptop with digital icons representing business efficiency and cost reduction. Effective business, Expense reduce. Low decrease illustrations Cost reduction concept. Quality increase and cost optimization, Hands typing on a laptop with digital icons representing business
Free with trial Dynamic red downward arrow crashing through gray coins, symbolizing price drops, sales, and financial decline. Ideal for Black Friday promotions, market analysis, discount ads, or economic reports, this image is generated using AI. Low decrease vectors Dynamic red downward arrow crashing through gray coins, symbolizing price drops, sales, and financial decline. Ideal for Black
Free with trial Professional vector illustration of downward sloping bar graph and connected dots line represents decreasing profits market loss economic recession data analysis results reduction in growth levels and monthly revenue falling. Low decrease illustrations Descending bar chart icon with line graph showing negative business trends and financial decline on transparent background. Professional vector illustration of downward sloping bar graph and connected dots line represents decreasing profits market loss economic recession data analysis results reduction in growth levels and monthly revenue falling
Free with trial Reduce labor costs icon Vector symbol or sign set collection in black and white outline. Low decrease vectors Worker Wage Reduction Icon Symbolizing Decrease in Labor Income. Reduce labor costs icon Vector symbol or sign set collection in black and white outline
Free with trial Economic critical crisis concept. The bar garph with dropdown arrow on red table background. Recession financial, cryptocurrency, gold, and the stock market. Losing money and cash. Bearish. Low decrease vectors Economic critical crisis concept. The bar garph with dropdown arrow on red table background. Recession financial, cryptocurrency
Free with trial A businessman in suit pushing a percent sign for your needs. Concept for online bank or your finance company. Special offer, sale, gift. Vector illustration. Low decrease vectors A businessman in suit pushing a percent sign for your needs. Concept for online bank or your finance company. Special
Free with trial Economic critical crisis concept. The bar graph with a down arrow on red world map background. Recession financial, cryptocurrency, gold, and the stock market. Losing money and cash. Bearish. Low decrease vectors Economic critical crisis concept. The bar graph with a down arrow on red world map background. Recession financial, cryptocurrency
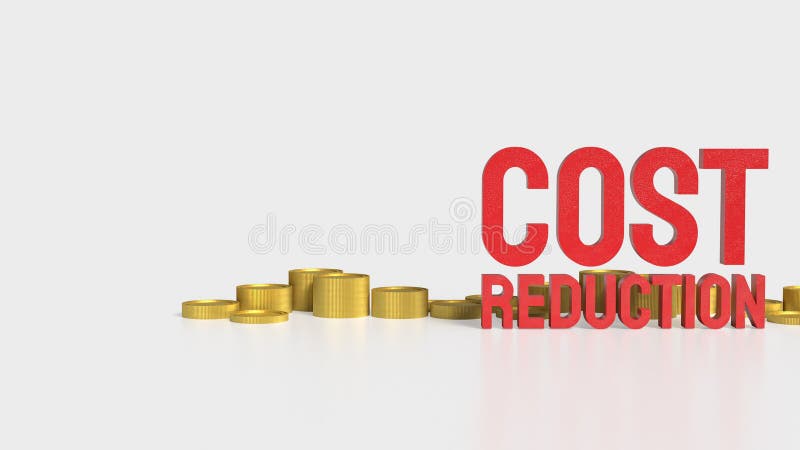
Free with trial The Cost reduction and coins for Business concept 3d rendering. Low decrease illustrations The Cost reduction and coins for Business concept 3d rendering
Free with trial The Cost reduction and coins for Business concept 3d rendering. Low decrease illustrations The Cost reduction and coins for Business concept 3d rendering
Free with trial Economy crisis icon logo sign vector outline in black and white color. Low decrease vectors Economy crisis icon symbol set collection. Economy crisis simple vector sign bundle. Economy crisis icon logo sign vector outline in black and white color
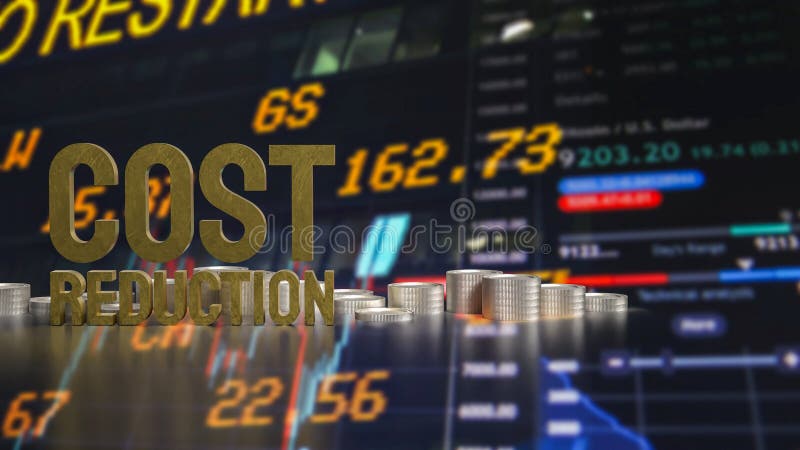
Free with trial The Cost reduction and coins for Business concept 3d rendering. Low decrease illustrations The Cost reduction and coins for Business concept 3d rendering
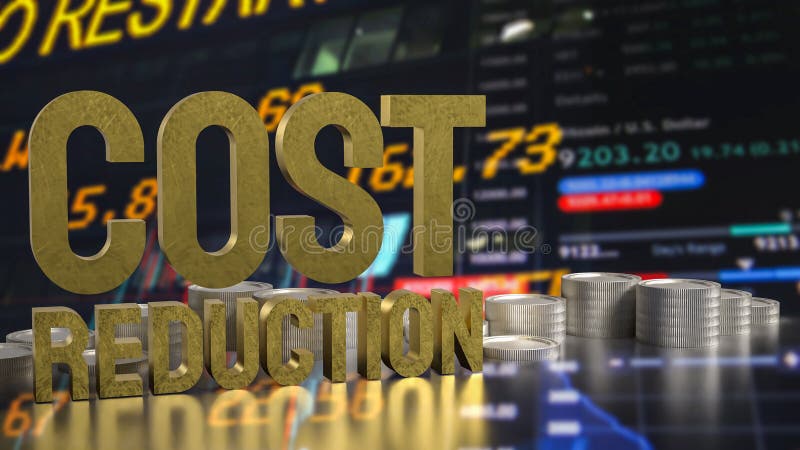
Free with trial The Cost reduction and coins for Business concept 3d rendering. Low decrease illustrations The Cost reduction and coins for Business concept 3d rendering
Free with trial The Cost reduction and coins for Business concept 3d rendering. Low decrease illustrations The Cost reduction and coins for Business concept 3d rendering
Free with trial The Cost reduction and coins for Business concept 3d rendering. Low decrease illustrations The Cost reduction and coins for Business concept 3d rendering
Free with trial The Cost reduction and coins for Business concept 3d rendering. Low decrease illustrations The Cost reduction and coins for Business concept 3d rendering
Free with trial The Cost reduction and coins for Business concept 3d rendering. Low decrease illustrations The Cost reduction and coins for Business concept 3d rendering
Free with trial The Cost reduction and coins for Business concept 3d rendering. Low decrease illustrations The Cost reduction and coins for Business concept 3d rendering
Free with trial The Cost reduction and coins for Business concept 3d rendering. Low decrease illustrations The Cost reduction and coins for Business concept 3d rendering
Free with trial Lower price. Text effect design with modern colors and 3D font look. Low decrease vectors Lower price. Text effect with modern colors and 3D font look
Free with trial Lower price. Text effect design with modern colors and 3D font look. Low decrease vectors Lower price. Text effect with modern colors and 3D font look
Free with trial Lower price. Text effect design with modern colors and 3D font look. Low decrease vectors Lower price. Text effect with modern colors and 3D font look
Free with trial Reduce carbon dioxide co2 icon linear logo mark set collection in black and white for web. Low decrease vectors Reduce carbon dioxide co2 icon linear logo mark in black and white. Reduce carbon dioxide co2 icon linear logo mark set collection in black and white for web
Free with trial Percent down icon vector set on white background. EPS 10. Low decrease vectors Percent down icon isolated on white background. Percent down icon vector set on white background. EPS 10
Free with trial Percent down icon vector set on white background. EPS 10. Low decrease vectors Percent down icon isolated on white background. Percent down icon vector set on white background. EPS 10
Free with trial Percent down icon vector set on white background. EPS 10. Low decrease vectors Percent down icon isolated on white background. Percent down icon vector set on white background. EPS 10
Free with trial Percent down icon vector set on white background. EPS 10. Low decrease vectors Percent down icon isolated on white background. Percent down icon vector set on white background. EPS 10
Free with trial Simple white arrow points downwards on plain pastel blue background. This icon represents decline, failure or a negative trend in business or finance. Low decrease illustrations Simple white arrow points downwards on plain pastel blue background. This icon represents decline, failure, or a negative trend. Simple white arrow points downwards on plain pastel blue background. This icon represents decline, failure or a negative trend in business or finance.
Free with trial Striking AI-generated visualization of a sharp financial crisis. This 3D render, featuring a bar chart and a glowing downward arrow, clearly communicates economic distress and market volatility, providing essential data imagery for investors and businesses tracking performance decline. Low decrease illustrations Conceptual 3D bar chart illustrating drastic market collapse and financial loss with a glowing downward arrow on a neutral backgro. Striking AI-generated visualization of a sharp financial crisis. This 3D render, featuring a bar chart and a glowing downward arrow, clearly communicates economic distress and market volatility, providing essential data imagery for investors and businesses tracking performance decline.
Free with trial Energy reduction icon logo sign vector outline in black and white color. Low decrease vectors Energy reduction icon symbol set collection. Energy reduction simple vector sign bundle. Energy reduction icon logo sign vector outline in black and white color
Free with trial Lower price. Text effect design with modern colors and 3D font look. Low decrease illustrations Lower price. Text effect with modern colors and 3D font look
Free with trial Luxurywooden inscription tax on beige podium, soft light, front view smooth background, 3d rendering. Low decrease illustrations Luxury wooden inscription tax on beige podium, soft light, smooth background, 3d rendering
Free with trial CO2 emissions icon logo sign vector outline in black and white color. Low decrease vectors CO2 Emission Reduction Icon for Environmental Care and Climate Action. CO2 emissions icon logo sign vector outline in black and white color
Free with trial Percentage symbol displayed on a wooden block represents discounts sales offers promotions finance interest rates savings investments returns growth market value profit margins gains losses and reduc. Low decrease illustrations Percentage discount sale offer promotion finance interest rate savings investment return growth market value profit margin gain lo. Percentage symbol displayed on a wooden block represents discounts sales offers promotions finance interest rates savings investments returns growth market value profit margins gains losses and reduc
Free with trial Curved down arrow icon. Bankrupt, market crisis vector concept. Low decrease vectors Curved down arrow icon. Bankrupt, market crisis concept
Free with trial Economic critical crisis concept. The down arrow on red world map background. Recession financial, cryptocurrency, gold, and the stock market. Losing money and cash. Bearish. Low decrease vectors Economic critical crisis concept. The down arrow on red world map background. Recession financial, cryptocurrency, gold, and the
Free with trial Golden bear statue on wall street in financial district - bear market recession concept. Generative AI. Low decrease illustrations Golden bear statue on wall street in financial district - bear market recession concept
Free with trial Percent down icon vector set on white background. EPS 10. Low decrease vectors Percent down icon isolated on white background. Percent down icon vector set on white background. EPS 10
Free with trial Mortgage rates business concept of investment housing real estate interest rates 3d home appraisal. planning savings money of coins to buy a home concept for property ladder, mortgage, real estate. Low decrease illustrations Mortgage rates business concept of investment housing real estate interest rates 3d home appraisal. planning savings money of
Free with trial Red arrow going down stock icon on white background. Bankruptcy, financial market crash icon for your web site design, logo, app, UI. graph chart down trend symbol. chart going down sign. Low decrease vectors Red arrow going down stock icon on white background. Bankruptcy, financial market crash icon for your web site design