Free with trial Cost reduction icon set in black and white color. simple flat vector. Low decrease vectors Cost reduction icon logo set vector. Cost reduction icon set in black and white color. simple flat vector
Free with trial Economic Loss icon outline collection or set in black and white. Low decrease vectors Economic Loss icon Line Art Logo set. Economic Loss icon outline collection or set in black and white
Free with trial Percent down icon vector logo set collection or bundle pack group. Low decrease vectors Percent down icon Isolated flat vector in outline. Percent down icon vector logo set collection or bundle pack group
Free with trial Cost reduction, money line icon illustration. Low decrease illustrations Cost reduction, money line icon
Free with trial This image shows a 3D rendering of a red line graph sharply declining, resting on a white cube. The graphic is generated by AI, and visually represents a negative trend or downturn, suitable for presentations or reports on market analysis, economic forecasts, or business performance. Low decrease illustrations Declining Trend Visualization. This image shows a 3D rendering of a red line graph sharply declining, resting on a white cube. The graphic is generated by AI, and visually represents a negative trend or downturn, suitable for presentations or reports on market analysis, economic forecasts, or business performance.
Free with trial A simple graphic illustration of a decreasing signal strength icon. The icon features a black rounded rectangle containing four white vertical bars of decreasing height, representing a weakening signal. This image can be used to illustrate concepts such as connectivity issues, data loss, or declining performance in various technological contexts. Low decrease vectors Decreasing Signal Strength Icon
Free with trial A simple, hand-drawn icon representing the importance of reducing salt intake for a healthier lifestyle. Low decrease vectors Reduce Salt Intake Health Icon. A simple, hand-drawn icon representing the importance of reducing salt intake for a healthier lifestyle
Free with trial Downward zigzag arrow icon vector with long shadow. Low decrease vectors Downward zigzag arrow icon with long shadow
Free with trial 3d rendering of isolated man and female symbol with word "CHILDFREE". Low decrease illustrations Isolated man and female symbol with word \'CHILDFREE\'. 3d rendering of isolated man and female symbol with word "CHILDFREE"
Free with trial 3d rendering of isolated man and female symbol with word "CHILDFREE". Low decrease illustrations Isolated man and female symbol with word \'CHILDFREE\'. 3d rendering of isolated man and female symbol with word "CHILDFREE"
Free with trial 3d rendering of isolated man and female symbol with word "CHILDFREE". Low decrease illustrations Isolated man and female symbol with word \'CHILDFREE\'. 3d rendering of isolated man and female symbol with word "CHILDFREE"
Free with trial A wooden block labeled "CO2" rests on a seesaw, tilting downwards, illustrating a decrease in carbon dioxide levels. Green arrows point downwards, symbolizing the reduction. The serene background suggests a positive environmental impact. Low decrease illustrations Reducing Carbon Dioxide Emissions. A wooden block labeled "CO2" rests on a seesaw, tilting downwards, illustrating a decrease in carbon dioxide levels. Green arrows point downwards, symbolizing the reduction. The serene background suggests a positive environmental impact.
Free with trial Percent down Arrow flat vector icon. Simple solid symbol isolated on white background. Low decrease vectors Percent down Arrow Flat Vector Icon
Free with trial Bright gradient minus sign icon, featuring yellow and pink hues, isolated on white background. Ideal for indicating subtraction, negative values, or removing elements. Low decrease vectors Minus sign icon isolated on white background. Bright gradient minus sign icon, featuring yellow and pink hues, isolated on white background. Ideal for indicating subtraction, negative values, or removing elements.
Free with trial A minimalist vector icon representing a downturn in the housing market. Low decrease vectors Real Estate Price Reduction Symbol. A minimalist vector icon representing a downturn in the housing market
Free with trial A city street depicts an economic downturn. People walk past closed shops, a bar chart shows a sharp decline. Low decrease illustrations Economic Downturn: A City in Decline. A city street depicts an economic downturn. People walk past closed shops, a bar chart shows a sharp decline
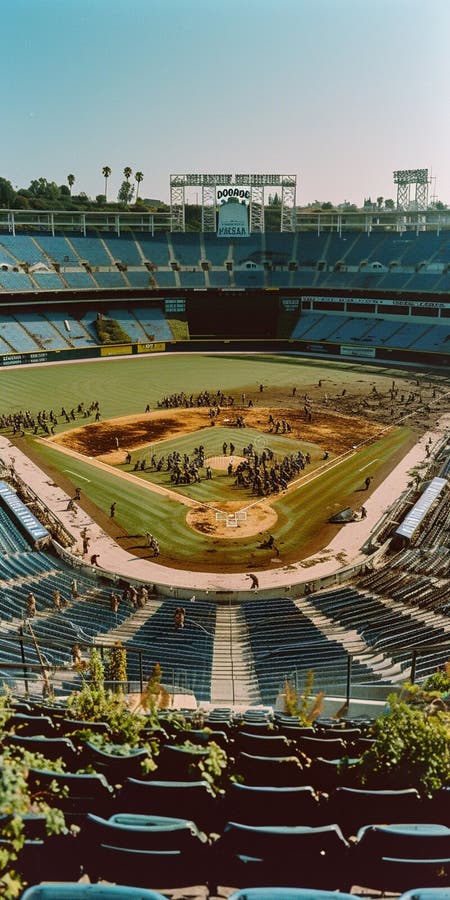
Free with trial A baseball stadium, devoid of spectators, showcases rows of empty seats as the game unfolds on the field. The lack of fans creates an eerie scene in the usually bustling venue. Low decrease illustrations Sparse Attendance at Baseball Stadium. A baseball stadium, devoid of spectators, showcases rows of empty seats as the game unfolds on the field. The lack of fans creates an eerie scene in the usually bustling venue.
Free with trial Economic Loss icon vector logo set collection or bundle pack group. Low decrease vectors Economic Loss icon Flat vector set outline. Economic Loss icon vector logo set collection or bundle pack group
Free with trial Economic Loss icon set in thin line outline style and linear vector sign. Low decrease vectors Economic Loss icon set vector illustration. Economic Loss icon set in thin line outline style and linear vector sign
Free with trial The image showcases a miniature, stylized octopus rendered in pale pink hues. It is positioned amidst a dimly lit underwater environment. The background consists of a dark, desaturated blue, suggesting depth. The octopus is centrally located, with various types of dark-toned rocks and reddish-brown seaweed or coral formations surrounding it. The lighting is soft and diffused, creating a moody atmosphere. The overall aesthetic is delicate and suggests a feeling of tranquility. The texture of the octopus is smooth, contrasting with the slightly rougher texture of the surrounding rocks and plants. The focus is sharp on the octopus, with a gradual decrease in sharpness towards the background. The color palette is limited, primarily utilizing shades of pink, brown, and dark blue. Low decrease illustrations Miniature Octopus in Underwater Scene. The image showcases a miniature, stylized octopus rendered in pale pink hues. It is positioned amidst a dimly lit underwater environment. The background consists of a dark, desaturated blue, suggesting depth. The octopus is centrally located, with various types of dark-toned rocks and reddish-brown seaweed or coral formations surrounding it. The lighting is soft and diffused, creating a moody atmosphere. The overall aesthetic is delicate and suggests a feeling of tranquility. The texture of the octopus is smooth, contrasting with the slightly rougher texture of the surrounding rocks and plants. The focus is sharp on the octopus, with a gradual decrease in sharpness towards the background. The color palette is limited, primarily utilizing shades of pink, brown, and dark blue.
Free with trial Economic Loss icon logo sign vector outline in black and white color. Low decrease vectors Economic Loss icon Flat fill set collection. Economic Loss icon logo sign vector outline in black and white color
Free with trial A 3D render of a red speech bubble next to a red downward-pointing arrow. The objects are isolated on a black background, creating a clean and graphic representation of communication and decline or negative feedback. Low decrease illustrations Red Speech Bubble and Down Arrow Icon. A 3D render of a red speech bubble next to a red downward-pointing arrow. The objects are isolated on a black background, creating a clean and graphic representation of communication and decline or negative feedback
Free with trial 29 points test score, twenty nine points exam results, vector illustration. Low decrease vectors 29 points test score, twenty nine points exam results, vector illustration
Free with trial Crisis financial concept, Economic recession, financial crisis and loosing money, Businessman shocked by broken piggy bank. Low decrease vectors Crisis financial concept, Economic recession, financial crisis and loosing money, Businessman shocked by broken piggy bank
Free with trial Red arrow down, falling markets, economic crisis. Generative AI. Low decrease illustrations Red arrow down, falling markets, economic crisis. Generative AI
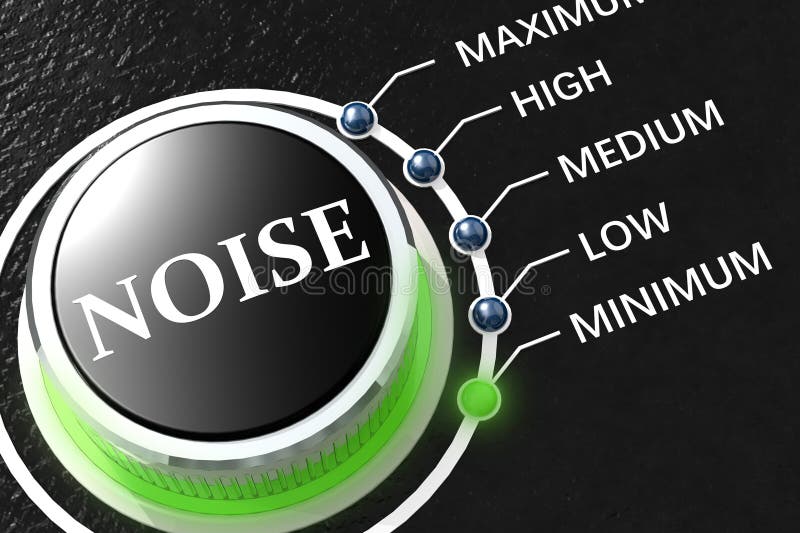
Free with trial Turn the noise knob to minimum level, 3d rendering. Low decrease illustrations Turn the noise knob to minimum level
Free with trial A symbolic illustration representing the critical issue of water scarcity. Low decrease vectors Water Conservation and Scarcity Symbol. A symbolic illustration representing the critical issue of water scarcity
Free with trial A stylized blue water drop icon featuring a bold white arrow pointing downwards. Low decrease vectors Water Drop Icon with Down Arrow Symbol. A stylized blue water drop icon featuring a bold white arrow pointing downwards
Free with trial Lower cost icon vector logo set collection for web app ui. Low decrease vectors Lower cost icon vector set collection for web. Lower cost icon vector logo set collection for web app ui
Free with trial Wooden house model with percentage blocks, illustrating mortgage and finance concept. 3D Render. Low decrease illustrations Wooden house model with percentage blocks, illustrating mortgage and finance concept
Free with trial Economic Loss icon vector line logo mark or symbol set collection outline style. Low decrease vectors Economic Loss icon black and white vector sign. Economic Loss icon vector line logo mark or symbol set collection outline style
Free with trial Economic crisis icon of economy depreciation and business downturn, vector line symbol. Banking investment recession, stock exchange trade fall and money value inflation icon of financial crisis. Low decrease vectors Economic crisis icon economy business depreciation. Economic crisis icon of economy depreciation and business downturn, vector line symbol. Banking investment recession, stock exchange trade fall and money value inflation icon of financial crisis
Free with trial A conceptual image illustrating a decline in the cocoa market. In the foreground, a pile of raw cocoa beans sits on a white surface. Behind them, a 3D bar chart shows a steep downward trend, with tall green bars transitioning to shorter red bars, symbolizing falling prices, reduced production, or financial loss. This graphic is ideal for representing economic downturns, agricultural commodity trading, market analysis, business reports, and news related to the chocolate industry's performance, supply chain issues, or crop failure. Low decrease illustrations Cocoa Market Decline with Beans and Graph. A conceptual image illustrating a decline in the cocoa market. In the foreground, a pile of raw cocoa beans sits on a white surface. Behind them, a 3D bar chart shows a steep downward trend, with tall green bars transitioning to shorter red bars, symbolizing falling prices, reduced production, or financial loss. This graphic is ideal for representing economic downturns, agricultural commodity trading, market analysis, business reports, and news related to the chocolate industry's performance, supply chain issues, or crop failure.
Free with trial Cost reduction icon Black line art vector in black and white outline set collection sign. Low decrease vectors Cost reduction icon Thin line flat illustration. Cost reduction icon Black line art vector in black and white outline set collection sign
Free with trial 40 points test score, forty points mark, bad exam results illustration - Vector. Low decrease vectors 40 points test score, forty points mark, bad exam results illustration - Vector
Free with trial Bankruptcy and inflation business, man in depression. Vector of crisis finance bankruptcy, business economy inflation illustration. Low decrease illustrations Bankruptcy and inflation business, man in depression
Free with trial Black and white icon featuring a stylized T-shirt beneath a speech bubble. Inside the bubble, a downward arrow and a dollar sign symbolize a price reduction. The simplistic design uses bold, solid lines, and a flat silhouette style, commonly used in visual communications or graphic interfaces to represent sales or discounts in the retail industry. Low decrease vectors Prices Go Down. Black and white icon featuring a stylized T-shirt beneath a speech bubble. Inside the bubble, a downward arrow and a dollar sign symbolize a price reduction. The simplistic design uses bold, solid lines, and a flat silhouette style, commonly used in visual communications or graphic interfaces to represent sales or discounts in the retail industry.
Free with trial Icon illustrating a computer monitor, thermometer, snowflake, and downward arrow. The monitor is depicted as a rectangle with a base. The thermometer, beside the screen, symbolizes temperature. The snowflake indicates cold, and the downward arrow suggests a decrease in temperature. The design uses bold black lines on a white background to convey the concept of cooling or monitoring PC temperature. Low decrease vectors PC Temperature
Free with trial Black and white illustration with a speech bubble above featuring a downward arrow and a dollar sign, symbolizing reduced costs or prices. Below, a simplified car icon represents the automobile industry, suggesting a drop in car prices. The icons are minimalist, using bold lines on a white background to convey the message clearly. Low decrease vectors Prices Go Down. Black and white illustration with a speech bubble above featuring a downward arrow and a dollar sign, symbolizing reduced costs or prices. Below, a simplified car icon represents the automobile industry, suggesting a drop in car prices. The icons are minimalist, using bold lines on a white background to convey the message clearly.
Free with trial A black and white line drawing shows two distinct symbols. The upper symbol is a speech bubble containing a downward arrow and a dollar sign, indicating a price reduction. Below it, a simple, outlined car icon represents an automobile. The combination suggests a theme related to decreasing car prices or discounts in the automotive market. Low decrease vectors Prices Go Down. A black and white line drawing shows two distinct symbols. The upper symbol is a speech bubble containing a downward arrow and a dollar sign, indicating a price reduction. Below it, a simple, outlined car icon represents an automobile. The combination suggests a theme related to decreasing car prices or discounts in the automotive market.
Free with trial A minimalist icon representing a downturn in the housing market. Low decrease vectors Real Estate Market Decline Vector Icon (3. A minimalist icon representing a downturn in the housing market
Free with trial A conceptual vector illustration symbolizing a downturn in the housing market. Low decrease vectors Real Estate Market Decline Vector Icon (4. A conceptual vector illustration symbolizing a downturn in the housing market
Free with trial Downward zigzag arrow icon in generic style. Market crash sign symbol vector. Low decrease vectors Downward zigzag arrow icon in generic style. Market crash sign symbol
Free with trial Black and white line icon depicting a t-shirt with a speech bubble above it. Inside the bubble, a downward arrow is next to a dollar sign, symbolizing a price reduction or sale. The design is simple and clean, using bold lines for easy recognition, likely used in retail contexts to indicate discounts on clothing items. Low decrease vectors Prices Go Down. Black and white line icon depicting a t-shirt with a speech bubble above it. Inside the bubble, a downward arrow is next to a dollar sign, symbolizing a price reduction or sale. The design is simple and clean, using bold lines for easy recognition, likely used in retail contexts to indicate discounts on clothing items.
Free with trial A downward arrow with a dollar sign in the middle. The image is blue and orange. Low decrease vectors A downward arrow with a dollar sign in the middle
Free with trial Downward zigzag arrow icon on black circle. Market crash sign symbol vector. Low decrease vectors Downward zigzag arrow icon on black circle. Market crash sign symbol
Free with trial Simple wooden house and percentage block, depicting concepts of mortgage and interest rates. 3D Render. Low decrease illustrations Simple wooden house and percentage block, depicting concepts of mortgage and interest rates
Free with trial Financial loss icon design vector illustration. Low decrease vectors Financial loss icon design vector illustration
Free with trial Economic Loss icon Black line art vector in black and white outline set collection sign. Low decrease vectors Economic Loss icon Black line art vector logo set. Economic Loss icon Black line art vector in black and white outline set collection sign
Free with trial Economic Loss icon linear logo mark set collection in black and white for web. Low decrease vectors Economic Loss linear logo mark in black and white. Economic Loss icon linear logo mark set collection in black and white for web
Free with trial A vibrant graphic announcing a special price drop sale with a colorful awning and leaf design. Low decrease illustrations Special Price Drop Sale Announcement Design. A vibrant graphic announcing a special price drop sale with a colorful awning and leaf design
Free with trial Blue three dimensional arrow pointing down on a white background. Low decrease illustrations Blue 3d arrow pointing down representing negative trend. Blue three dimensional arrow pointing down on a white background
Free with trial Dollar arrow up and down icon vector. USD growth and decline concept. Low decrease vectors Dollar arrow up and down icon. USD growth and decline concept
Free with trial Oil price down icon. Vector illustration. EPS 10. Stock image. Low decrease vectors Oil price down icon. Vector illustration. EPS 10.
Free with trial Golden Ring with Minus Symbol and Subtle Glow. Low decrease vectors Golden Ring with Minus Symbol and Subtle Glow
Free with trial 3d animation with the movement of blood components. Low decrease illustrations 3d illustration with the movement of blood components. 3d animation with the movement of blood components.
Free with trial Dollar arrow up and down icon on circle line. USD growth and decline concept vector. Low decrease vectors Dollar arrow up and down icon on circle line. USD growth and decline concept
Free with trial Co2 gas carbon dioxide icon logo sign vector outline in black and white color. Low decrease vectors Co2 gas carbon dioxide icon Flat fill set collection. co2 gas carbon dioxide icon logo sign vector outline in black and white color
Free with trial Mortgage rates A pile of coins placed on the table together with interest rate illustrations. planning savings money of coins to buy a home concept for property, mortgage, real estate. Low decrease illustrations Mortgage rates A pile of coins placed on the table together with interest rate illustrations. planning savings money of coins to
Free with trial A red arrow points downward towards the words "Interest Rates" in dark lettering, symbolizing a decline. Image. Low decrease illustrations Red Arrow Pointing Down at Interest Rates Text. A red arrow points downward towards the words "Interest Rates" in dark lettering, symbolizing a decline. Image
Free with trial Baby height chart with clouds measuring from zero to one hundred and fifty centimeters. Low decrease vectors Cartoon height chart measuring tool for kids with a cute sky theme. Baby height chart with clouds measuring from zero to one hundred and fifty centimeters
Free with trial Red and Black Line Diagram Icon. Low decrease vectors Low Sales and diagram icon concept. Red and Black Line Diagram Icon
Free with trial Hand pushing green factory in front of pollution factory for green produce and economy to reduce carbon dioxide emission from Kyoto protocol within 2050 ,Sustainability environment concept. Low decrease illustrations Hand pushing green factory in front of pollution factory for green produce and economy to reduce carbon dioxide emission from
Free with trial A minimalist and clean digital illustration of a classic thermometer, featuring a vibrant red liquid column indicating a moderate temperature. Set against a pristine white background, the simple graphic design makes it highly versatile. This clear visual effectively conveys concepts of heat, cold, temperature measurement, and progress. Ideal for use in medical, weather, environmental, or financial contexts, as well as for infographics, apps, and websites needing a precise and universal indicator of status or change. Low decrease illustrations Simple Red Thermometer Icon on White Background. A minimalist and clean digital illustration of a classic thermometer, featuring a vibrant red liquid column indicating a moderate temperature. Set against a pristine white background, the simple graphic design makes it highly versatile. This clear visual effectively conveys concepts of heat, cold, temperature measurement, and progress. Ideal for use in medical, weather, environmental, or financial contexts, as well as for infographics, apps, and websites needing a precise and universal indicator of status or change.
Free with trial Economic Loss icon set in thin line outline style and linear vector sign. Low decrease vectors Economic Loss icon design in filled and outlined style. Economic Loss icon set in thin line outline style and linear vector sign
Free with trial Percentage arrow up and down glyph icon with percent sign. Represents financial growth, decline, interest rates, banking, credit, investment, and economic trends. Low decrease vectors Percentage Arrow Up and Down Glyph Icon
Free with trial Simple vector icon of a thermometer with the mercury level decreasing. Low decrease illustrations Thermometer showing decreasing temperature icon. Simple vector icon of a thermometer with the mercury level decreasing
Free with trial Magnifier glass on use dollar banknote with carbon reduction icon for carbon credit can make more money in business and sustainable development together in economic and environment concept. Low decrease illustrations Magnifier glass on use dollar banknote with carbon reduction icon for carbon credit can make more money in business and
Free with trial Green pin on year 2050 for Kyoto Protocol with CO2 reduction, 3d rendering. Low decrease illustrations Green pin on year 2050 for Kyoto Protocol with CO2 reduction
Free with trial Futuristic digital illustration of glowing blue arrow pointing downwards. Geometric wireframe design with polygonal facets on dark gradient background representing business trends and data loss. Low decrease vectors Abstract low poly blue arrow pointing down on dark background. Futuristic digital illustration of glowing blue arrow pointing downwards. Geometric wireframe. Futuristic digital illustration of glowing blue arrow pointing downwards. Geometric wireframe design with polygonal facets on dark gradient background representing business trends and data loss
Free with trial Red hand holding a dollar coin with a downward arrow, symbolizing financial loss or reduced income. Low decrease vectors Red hand holding a dollar coin with a downward arrow
Free with trial Cost reduction icon linear logo mark set collection in black and white for web. Low decrease vectors Cost reduction icon linear logo mark in black and white. Cost reduction icon linear logo mark set collection in black and white for web
Free with trial Distressed Piggy Bank Symbolizing Financial Loss or Recession. Low decrease illustrations Distressed Piggy Bank Symbolizing Financial Loss or Recession
Free with trial Arrow percent icon in line style. Up and down percentage outline sign symbol illustration. Low decrease vectors Arrow percent icon in line style. Up and down percentage outline sign symbol
Free with trial Cost reduction icon vector line logo mark or symbol set collection outline style. Low decrease vectors Cost reduction icon black and white vector outline sign. Cost reduction icon vector line logo mark or symbol set collection outline style