Free with trial Default or collapse in stock market and exchange concept vector illustration. Businessman in stress, broker in panic clasping your head with hands on background of screen with securities value fall. Market value price decrease vectors Default or collapse in stock market and exchange
Free with trial Novel coronavirus disease COVID-19 with text coronavirus outbreak on correction market background. concept of black swan event in World trade market and economy. Market value price decrease vectors Novel coronavirus disease COVID-19 with text coronavirus outbreak on correction market background. concept of black swan event in
Free with trial A poignant 3D rendering illustrates the concept of a bear market with a sad brown bear juxtaposed with a prominent red down arrow, symbolizing financial decline and an impending economic recession. This bearish depiction, set against a clean white background, powerfully communicates investment losses, a market crash, and the anxieties of a financial crisis. Perfect for visual representations of. Market value price decrease illustrations Bear market concept depicted by sad brown bear with red down arrow illustrating financial decline and economic recession. A poignant 3D rendering illustrates the concept of a bear market with a sad brown bear juxtaposed with a prominent red down arrow, symbolizing financial decline and an impending economic recession. This bearish depiction, set against a clean white background, powerfully communicates investment losses, a market crash, and the anxieties of a financial crisis. Perfect for visual representations of
Free with trial A glossy green arrow with a percentage symbol points downwards, symbolizing a decrease in value, sales, or economic performance. Perfect for financial concepts. Market value price decrease illustrations Green percentage symbol arrow shows downward trend indicating price reduction or loss isolated on white background. A glossy green arrow with a percentage symbol points downwards, symbolizing a decrease in value, sales, or economic performance. Perfect for financial concepts
Free with trial This illustration represents retail economics, featuring a shopping cart, price tag, head with dollar sign, and coin with arrow, symbolizing financial concepts. Market value price decrease vectors Vector art of illustration showcasing retail economics with shopping cart, price tag, head with dollar sign, and coin with upward. This illustration represents retail economics, featuring a shopping cart, price tag, head with dollar sign, and coin with arrow, symbolizing financial concepts
Free with trial A stock market chart analysis with a downward trend arrow, illustrating financial decline, economic downturn, and investment risk in a clear visual manner. Market value price decrease vectors Vector art of stock market chart analysis with downward trend arrow indicating financial decline and economic downturn. A stock market chart analysis with a downward trend arrow, illustrating financial decline, economic downturn, and investment risk in a clear visual manner
Free with trial A 3D rendered illustration features a bright yellow coin prominently displaying the Indian Rupee symbol. Adjacent to it, a smaller blue circular icon contains a white downward-pointing arrow. This graphic represents financial concepts such as currency, decrease in value, or a financial transaction. The objects are isolated on a white background. Market value price decrease illustrations 3D Rendered Yellow Coin with Indian Rupee Symbol and Blue Down Arrow Icon currency money. A 3D rendered illustration features a bright yellow coin prominently displaying the Indian Rupee symbol. Adjacent to it, a smaller blue circular icon contains a white downward-pointing arrow. This graphic represents financial concepts such as currency, decrease in value, or a financial transaction. The objects are isolated on a white background
Free with trial This graphic features three stylized red candlestick chart icons arranged in a sequence against a clean white background. Each icon consists of a rectangular body with thin vertical lines extending from the top and bottom, symbolizing financial market data. The vibrant red color indicates a bearish or declining trend in asset valuation. The minimalist design provides a clear and professional. Market value price decrease vectors Three red candlestick chart icons representing a downward market trend on white background. This graphic features three stylized red candlestick chart icons. This graphic features three stylized red candlestick chart icons arranged in a sequence against a clean white background. Each icon consists of a rectangular body with thin vertical lines extending from the top and bottom, symbolizing financial market data. The vibrant red color indicates a bearish or declining trend in asset valuation. The minimalist design provides a clear and professional
Free with trial Oil price fall graph illustration Oil pump icons Red arrow. Market value price decrease vectors Oil price graph illustration. Oil price fall graph illustration Oil pump icons Red arrow
Free with trial This image captures a downward trend line, symbolizing a financial market decline and representing challenges faced by investors. Market value price decrease illustrations Downward Trend Line Representing Financial Market Decline and Loss. This image captures a downward trend line, symbolizing a financial market decline and representing challenges faced by investors
Free with trial Negative Equity Wordcloud Shows Losses Or Debt Bigger Than House Value. Economic Downturn Causes Bankruptcy And Failure - 3d Illustration. Market value price decrease illustrations Negative Equity Wordcloud Shows Losses Or Debt Bigger Than House Value - 3d Illustration. Negative Equity Wordcloud Shows Losses Or Debt Bigger Than House Value. Economic Downturn Causes Bankruptcy And Failure - 3d Illustration
Free with trial Negative Equity Icon Shows Losses Or Debt Bigger Than House Value. Economic Downturn Causes Bankruptcy And Failure - 3d Illustration. Market value price decrease illustrations Negative Equity Icon Shows Losses Or Debt Bigger Than House Value - 3d Illustration. Negative Equity Icon Shows Losses Or Debt Bigger Than House Value. Economic Downturn Causes Bankruptcy And Failure - 3d Illustration
Free with trial A striking red line graph against a dark backdrop, illustrating a stock market crash and highlighting a financial crisis. The image conveys a sense of loss and economic downturn. Market value price decrease illustrations Stock market crash illustration with red line graph on a dark background depicting financial crisis concept. A striking red line graph against a dark backdrop, illustrating a stock market crash and highlighting a financial crisis. The image conveys a sense of loss and economic downturn
Free with trial Real estate market decline linear icon. concept of appreciation or competition in property and loss. flat simple stroke trend investment demand or downturn logotype graphic design isolated on white. Market value price decrease vectors Real estate market decline linear icon
Free with trial A vibrant blue percentage sign with a downward-pointing arrow visually represents a decrease or discount. This image is perfect for illustrating financial loss or reduction. Market value price decrease vectors Vector art of blue percentage sign with arrow pointing down, indicating decrease, discount, or financial loss in a visually. A vibrant blue percentage sign with a downward-pointing arrow visually represents a decrease or discount. This image is perfect for illustrating financial loss or reduction
Free with trial A magnifying glass highlights a "Buy" signal amidst a declining stock market graph. Market value price decrease illustrations Buy Opportunity Stock Market Downturn Analysis with Magnifying Glass. A magnifying glass highlights a "Buy" signal amidst a declining stock market graph.
Free with trial A red graph with a downward trend, indicating a decline or decrease in a particular metric or value over time, with a prominent red arrow pointing downwards. Market value price decrease illustrations Downward trend indicated by red graph with declining values over time. A red graph with a downward trend, indicating a decline or decrease in a particular metric or value over time, with a prominent red arrow pointing downwards
Free with trial A hand holding a yellow caution sign with black text that reads 'CAUTION: Deflation and Inflation. ' The image emphasizes the economic concepts of deflation, which is a decrease in the general price level of goods and services, and inflation, which is a sustained increase in the general price level. The sign is typically used to alert viewers to potential economic risks or considerations. Market value price decrease illustrations Caution sign highlighting economic concerns of deflation and inflation. A hand holding a yellow caution sign with black text that reads 'CAUTION: Deflation and Inflation.' The image emphasizes the economic concepts of deflation, which is a decrease in the general price level of goods and services, and inflation, which is a sustained increase in the general price level. The sign is typically used to alert viewers to potential economic risks or considerations
Free with trial Isometric bar chart. Decrease, drop, economic crisis, investment and failure concept. Turquoise blue background. Flat design. EPS 8 vector illustration, no transparency, no gradients. Market value price decrease vectors Bar chart, decrease, crisis. Isometric bar chart. Decrease, drop, economic crisis, investment and failure concept. Turquoise blue background. Flat design. EPS 8 vector illustration, no transparency, no gradients
Free with trial 3D HALF PRICE word on white background 3d rendering. Market value price decrease illustrations 3D HALF PRICE word on white background 3d rendering
Free with trial An illustration of Bitcoin, cryptocurrency market analysis, growth chart, and blockchain technology, representing digital finance and investment trends. Market value price decrease vectors Vector art of bitcoin and cryptocurrency market analysis with growth chart and blockchain technology isolated on white background. An illustration of Bitcoin, cryptocurrency market analysis, growth chart, and blockchain technology, representing digital finance and investment trends
Free with trial Hand showing price or cost drop black icon. concept of non effective expense or bankrupt sign. flat simple trendy modern crash stats logotype graphic art infographic design element isolated on white. Market value price decrease vectors Hand showing price or cost drop black icon
Free with trial A watercolor painting of a downward trending financial chart, symbolizing market instability, economic downturn, investment risk, financial loss, and uncertainty. Spacious empty area designed for product displays and advertisements. Perfect for banners, branding, and marketing visuals. . Generative AI. Market value price decrease illustrations Watercolor Chart Decline A watercolor painting of a downward trending financial chart symbolizing market instability economic. A watercolor painting of a downward trending financial chart, symbolizing market instability, economic downturn, investment risk, financial loss, and uncertainty. Spacious empty area designed for product displays and advertisements. Perfect for banners, branding, and marketing visuals. . Generative AI
Free with trial The image shows a pyramid-shaped stack of gold-colored coins with a bold red downward arrow placed on top. This visual metaphor typically represents a decline in value, price, or financial performance. The coins are neatly aligned, suggesting stability or wealth, while the arrow emphasizes a downward trend. Market value price decrease illustrations A stack of gold coins with a downward-pointing red arrow indicating a decrease. The image shows a pyramid-shaped stack of gold-colored coins with a bold red downward arrow placed on top. This visual metaphor typically represents a decline in value, price, or financial performance. The coins are neatly aligned, suggesting stability or wealth, while the arrow emphasizes a downward trend
Free with trial The image depicts a line graph with a light blue line representing the changes in stock price over time. The graph shows various peaks and troughs, indicating the volatility of the stock. The background is a light, gradient blue color, providing a clear contrast to the line graph. Market value price decrease illustrations A detailed line graph showing the fluctuations of a stock price over a period of time. The image depicts a line graph with a light blue line representing the changes in stock price over time. The graph shows various peaks and troughs, indicating the volatility of the stock. The background is a light, gradient blue color, providing a clear contrast to the line graph
Free with trial A golden dollar sign is positioned between a red downward arrow and a green upward arrow, symbolizing financial market changes, isolated on transparent background. Market value price decrease vectors Golden dollar sign symbol between red down arrow and green up arrow indicating financial market fluctuations isolated on. A golden dollar sign is positioned between a red downward arrow and a green upward arrow, symbolizing financial market changes, isolated on transparent background
Free with trial The image features a 3D Bitcoin logo positioned centrally with an upward green arrow on the left and a downward red arrow on the right, symbolizing the cryptocurrency's price volatility and market fluctuations. Market value price decrease illustrations Bitcoin symbol with upward and downward trend arrows indicating volatility. The image features a 3D Bitcoin logo positioned centrally with an upward green arrow on the left and a downward red arrow on the right, symbolizing the cryptocurrency's price volatility and market fluctuations
Free with trial Businessman looks at a graph of the real estate market where the arrowhead is falling. recession Home prices fall in real estate and property market crash. isometric illustration vector. Market value price decrease vectors Home prices fall in real estate and property market crash
Free with trial 3D illustration showing stacks of golden Bitcoin coins and a red downward arrow, symbolizing cryptocurrency market decline, loss, and financial risk. This concept represents volatility, crypto crash, and falling Bitcoin value. Perfect for use in fintech, blockchain, and economic news visuals. Market value price decrease illustrations 3D Bitcoin Coins with Red Downward Arrow Representing Cryptocurrency Market Decline. 3D illustration showing stacks of golden Bitcoin coins and a red downward arrow, symbolizing cryptocurrency market decline, loss, and financial risk. This concept represents volatility, crypto crash, and falling Bitcoin value. Perfect for use in fintech, blockchain, and economic news visuals.
Free with trial Reduction of cost and sale for clients. Only today off price for customers, new product. Discounts and clearance. Promotional banner, advertisement poster with transparent frame. Vector in flat style. Market value price decrease illustrations Only today price reduction, new product, banner. Reduction of cost and sale for clients. Only today off price for customers, new product. Discounts and clearance. Promotional banner, advertisement poster with transparent frame. Vector in flat style
Free with trial Dollar sign in front of stock market graph chart declining. Concept of financial crisis, recession, economic downturn, market fall. Business, finance investment risk. Negative trend. Market value price decrease illustrations Dollar sign in front of stock market graph chart declining. Concept of financial crisis, recession, economic downturn, market
Free with trial Reduction of cost and sale for clients. Only today off price for customers, new product. Discounts and clearance. Promotional banner, advertisement poster with transparent frame. Vector in flat style. Market value price decrease vectors Only today price reduction, new product, banner. Reduction of cost and sale for clients. Only today off price for customers, new product. Discounts and clearance. Promotional banner, advertisement poster with transparent frame. Vector in flat style
Free with trial Hands holding a glowing graph showing a downward trend for gold prices, symbolizing financial loss and market downturn. Market value price decrease illustrations Gold price falling graph held in hands, financial crisis concept, investment loss. Hands holding a glowing graph showing a downward trend for gold prices, symbolizing financial loss and market downturn
Free with trial Dollar increase decrease icon. Money symbol with arrow stretching rising up and drop fall down. Business cost sale and reduction icon. vector illustration. Market value price decrease vectors Dollar increase decrease icon. Money symbol with arrow stretching rising up and drop fall down. Business cost sale and reduction i
Free with trial A 3D rendered blue arrow pointing downwards is adorned with a pink circular tag featuring a white percentage symbol. The graphic is isolated on a clean white background, symbolizing a decrease or reduction. Market value price decrease illustrations Blue downward arrow with a pink percentage symbol tag on a white background decrease decline. A 3D rendered blue arrow pointing downwards is adorned with a pink circular tag featuring a white percentage symbol. The graphic is isolated on a clean white background, symbolizing a decrease or reduction
Free with trial Gold coins stack with red arrow zigzag down representing economic recession and market crash. Generative AI. Market value price decrease illustrations Gold coins stack with red arrow zigzag down representing economic recession and market crash
Free with trial 3D coin background with finance chart. Financial investment, currency, successful market growth, technology report concept. Bitcoin or cryptocurrency trading, online banking digital. Market value price decrease illustrations 3D coin background with finance chart. Financial investment, currency, successful market growth, technology report concept.
Free with trial A visual representation of a stock market decline, featuring a red financial graph with a downward trend. The image signifies a bearish market, potential losses, and economic downturns. Market value price decrease illustrations Stock market crash red financial graph showing bearish trend and market decline. A visual representation of a stock market decline, featuring a red financial graph with a downward trend. The image signifies a bearish market, potential losses, and economic downturns
Free with trial A visual metaphor showcasing a downward trend in the financial market, indicated by a red arrow pointing downwards, juxtaposed against a stack of gold bars, representing a drop in gold prices and. Market value price decrease illustrations Depiction of economic recession and financial crisis with falling gold prices and market downturn. A visual metaphor showcasing a downward trend in the financial market, indicated by a red arrow pointing downwards, juxtaposed against a stack of gold bars, representing a drop in gold prices and
Free with trial An abstract red financial graph dramatically illustrates an economic downturn or stock market volatility against a rugged, textured wall. This powerful graphic symbolizes financial crisis, loss, and recession with a prominent downward trend. Perfect for illustrating concepts of risk, falling stock, and bearish markets, this image is ideal for financial reports, business presentations, and articles. Market value price decrease illustrations Abstract red financial graph depicting economic downturn or stock market volatility on a textured wall. An abstract red financial graph dramatically illustrates an economic downturn or stock market volatility against a rugged, textured wall. This powerful graphic symbolizes financial crisis, loss, and recession with a prominent downward trend. Perfect for illustrating concepts of risk, falling stock, and bearish markets, this image is ideal for financial reports, business presentations, and articles
Free with trial Financial Data Chart Analysis with Glowing Stock Market Uptrend Graph in Blue and Orange Colors, Generated by AI. Market value price decrease illustrations Financial Data Chart Analysis with Glowing Stock Market Uptrend Graph in Blue and Orange Colors
Free with trial A digital screen displays a red stock market graph in a financial district. The graph depicts a downward trend, suggesting potential losses or a market downturn, with city buildings out of focus in the background. Market value price decrease illustrations Red Stock Market Graph displayed on a digital screen in the Financial District. A digital screen displays a red stock market graph in a financial district. The graph depicts a downward trend, suggesting potential losses or a market downturn, with city buildings out of focus in the background
Free with trial Real estate market crash concept with red arrow falling down on wooden house model causing crisis. Generative AI. Market value price decrease illustrations Real estate market crash concept with red arrow falling down on wooden house model causing crisis
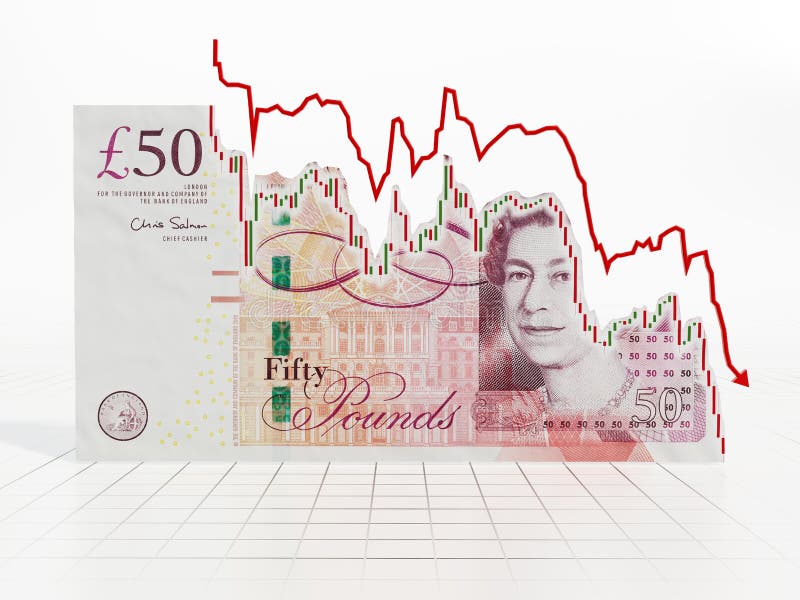
Free with trial Falling Pound or Sterling value. 3D illustration. Market value price decrease illustrations Falling Pound or Sterling value. 3D illustration
Free with trial Falling Pound or Sterling value. 3D illustration. Market value price decrease illustrations Falling Pound or Sterling value. 3D illustration
Free with trial Colored miniature houses stand on real estate market analysis chart. Hand holds home loan. Housing market concept, mortgage rates rising falling. Property value increase decrease. Market value price decrease illustrations Colored miniature houses stand on real estate market analysis chart. Hand holds home loan. Housing market concept, mortgage rates
Free with trial A stack of gold bars against a stock market chart, symbolizing investment opportunities, financial trading, and wealth creation in a volatile market. Market value price decrease illustrations Gold bars and stock market chart showing investment opportunity and financial trading strategy insight. A stack of gold bars against a stock market chart, symbolizing investment opportunities, financial trading, and wealth creation in a volatile market.
Free with trial Illustration of dynamic stock market chart with red fluctuations in dark trading environment. Economic financial volatility, digital data analysis, business concept. Charts reflect. Market value price decrease illustrations Illustration of dynamic stock market chart with red fluctuations in dark trading environment. Economic financial volatility
Free with trial Retro flat price tag icon concept. vector illustration template for your design. Market value price decrease vectors Retro flat price tag icon concept. vector
Free with trial This image depicts a small white house encircled by gold coins, with a white arrow pointing down towards it. It visually represents a decline in property values or a challenging real estate market. high-quality professional detailed modern elegant stylish clean. Market value price decrease illustrations A miniature house surrounded by coins with an arrow pointing downwards symbolizing decreasing value. This image depicts a small white house encircled by gold coins, with a white arrow pointing down towards it. It visually represents a decline in property values or a challenging real estate market. high-quality professional detailed modern elegant stylish clean
Free with trial Negative Equity Icon Shows Losses Or Debt Bigger Than House Value. Economic Downturn Causes Bankruptcy And Failure - 3d Illustration. Market value price decrease illustrations Negative Equity Icon Shows Losses Or Debt Bigger Than House Value - 3d Illustration. Negative Equity Icon Shows Losses Or Debt Bigger Than House Value. Economic Downturn Causes Bankruptcy And Failure - 3d Illustration
Free with trial Reduction of cost and sale for clients. Off price for customers of shops and stores. Discounts and clearance. Promotional banner or advertisement poster with transparent frame, vector in flat style. Market value price decrease illustrations Off price reduction of cost, promotional banner. Reduction of cost and sale for clients. Off price for customers of shops and stores. Discounts and clearance. Promotional banner or advertisement poster with transparent frame, vector in flat style
Free with trial Red arrow crashing into gold coins stack representing financial crisis, inflation and stock market loss. Generative AI. Market value price decrease illustrations Red arrow crashing into gold coins stack representing financial crisis inflation and stock market loss
Free with trial A high-tech visualization of financial data, showing a glowing blue bar chart and line graphs representing stock market trends, business analytics, and economic growth. Market value price decrease illustrations Futuristic digital stock market chart with glowing blue graphs and data analysis on a dark background. A high-tech visualization of financial data, showing a glowing blue bar chart and line graphs representing stock market trends, business analytics, and economic growth
Free with trial Vibrant financial chart illustrates stock market trends and trading activity. Showcasing investment dynamics with percentage values command signals and statistic data display. Market value price decrease illustrations Vibrant financial chart illustrates stock market trends and trading activity. Showcasing investment dynamics with percentage
Free with trial Laptop screen shows stock market crash with red candlesticks falling down. Economic recession, global financial crisis and trade war concept. Investment loss, business failure. Market value price decrease illustrations Laptop screen shows stock market crash with red candlesticks falling down. Economic recession, global financial crisis and trade
Free with trial Red arrow indicates financial market decline. Bearish trend illustrated over chart of falling stock prices. Economic instability concept, representing losses, recession, crisis. Market value price decrease illustrations Red arrow indicates financial market decline. Bearish trend illustrated over chart of falling stock prices. Economic instability
Free with trial The image depicts a financial chart displaying price movements over time. It features candlestick bars in blue and yellow, indicating price changes, with a red line representing a moving average. The x-axis represents time, while the y-axis represents price. Market value price decrease illustrations A detailed financial chart showing price movements over time with candlestick bars and moving average line. The image depicts a financial chart displaying price movements over time. It features candlestick bars in blue and yellow, indicating price changes, with a red line representing a moving average. The x-axis represents time, while the y-axis represents price
Free with trial A vivid red stock market bar chart decline is displayed against a dark background. This image conveys a financial crisis or market downturn concept. Market value price decrease illustrations Red Financial Stock Market Crash with Bar Chart Decline in Dark Background Concept. A vivid red stock market bar chart decline is displayed against a dark background. This image conveys a financial crisis or market downturn concept
Free with trial A red financial graph with a descending trend indicates a stock market decline and bearish trends. The digital chart displays negative data, symbolizing loss and potential economic crisis. Market value price decrease illustrations Red Stock Market Financial Graph Demonstrating Bearish Market Decline and Negative Trends. A red financial graph with a descending trend indicates a stock market decline and bearish trends. The digital chart displays negative data, symbolizing loss and potential economic crisis
Free with trial Abstract vector showing price decreasing and investment increasing, using blue lines and pink accents. Simple composition, balanced for illustrative purposes. Market value price decrease vectors Abstract visual illustrating price reduction, investment, and financial dynamics on a black background. Abstract vector showing price decreasing and investment increasing, using blue lines and pink accents. Simple composition, balanced for illustrative purposes.
Free with trial A red arrow points down over a bar graph, symbolizing a stock market crash, recession, or financial crisis. This image conveys economic downturn, investment loss, and business failure in a clear visual manner. Market value price decrease illustrations Stock market crash recession chart financial crisis economic downturn investment loss business failure graph. a red arrow points down over a bar graph, symbolizing a stock market crash, recession, or financial crisis. This image conveys economic downturn, investment loss, and business failure in a clear visual manner.
Free with trial A red stock market chart displayed against a dark background depicting a significant financial decline. The image conveys a sense of crisis and economic downturn. Market value price decrease illustrations Red Stock Market Chart Showing Financial Decline with Dark Background Depicting Crisis. A red stock market chart displayed against a dark background depicting a significant financial decline. The image conveys a sense of crisis and economic downturn
Free with trial Laptop screen shows declining financial graph. Red chart illustrates market downturn economic, crisis or stock market crash. Background includes city lights. Image conveys financial. Market value price decrease illustrations Laptop screen shows declining financial graph. Red chart illustrates market downturn economic crisis or stock market crash. Laptop screen shows declining financial graph. Red chart illustrates market downturn economic, crisis or stock market crash. Background includes city lights. Image conveys financial.
Free with trial A 3D rendered yellow Bitcoin coin with the iconic 'B' symbol is centrally placed. To its left, a green circle with an upward arrow signifies growth, while to its right, a red circle with a downward arrow represents decline. These elements are presented on a clean white background, illustrating cryptocurrency market trends. Market value price decrease illustrations 3D Rendered Bitcoin Symbol with Up and Down Arrows Indicating Cryptocurrency Market Trends on a White Background. A 3D rendered yellow Bitcoin coin with the iconic 'B' symbol is centrally placed. To its left, a green circle with an upward arrow signifies growth, while to its right, a red circle with a downward arrow represents decline. These elements are presented on a clean white background, illustrating cryptocurrency market trends
Free with trial Cryptocurrency decline in value during market downturn, digital currency collapse, finding strategy to survive during crisis, consequences of declining foreign exchange market, arrow breaking Bitcoin. Market value price decrease vectors Arrow breaking Bitcoin
Free with trial This image illustrates market trends with arrows and graphs. It represents economic instability, showing both growth and decline, crucial for financial analysis. Market value price decrease vectors Vector art of illustration depicting fluctuating market trends with upward and downward arrows and bar graphs, , conveying. This image illustrates market trends with arrows and graphs. It represents economic instability, showing both growth and decline, crucial for financial analysis
Free with trial Graph of the real estate market where the arrowhead is falling. recession Home prices fall in real estate and property market crash. 3D render illustration. Market value price decrease illustrations Graph of the real estate market where the arrowhead is falling
Free with trial A close up view of golden digital currency coins on a financial candlestick chart. this image represents the volatility and trading patterns of the modern cryptocurrency market and global economy. Market value price decrease vectors Golden digital currency coins placed over a financial candlestick chart showing market volatility and trading trends. a close up view of golden digital currency coins on a financial candlestick chart. this image represents the volatility and trading patterns of the modern cryptocurrency market and global economy
Free with trial Stacked coins with a red bearish stock market trend. 3D Rendering. Market value price decrease illustrations Stacked coins with a bearish stock market trend. Stacked coins with a red bearish stock market trend. 3D Rendering
Free with trial This icon represents seven percent, symbolizing a discount, interest rate, or statistical value in various contexts such as finance, sales, and data analysis. Market value price decrease vectors Vector art of seven percent icon, representing a discount, interest rate, or statistical value in finance, sales, and data. This icon represents seven percent, symbolizing a discount, interest rate, or statistical value in various contexts such as finance, sales, and data analysis
Free with trial Red real estate market decline icon. flat simple stroke trend investment demand or downturn logotype graphic design element. concept of appreciation or competition in property and rental deposit loss. Market value price decrease vectors Red real estate market decline icon
Free with trial Retro flat price tag icon concept. vector illustration design. Market value price decrease vectors Retro flat price tag icon concept. vector illustration design
Free with trial Bitcoin coins falling arrows represents decline in cryptocurrency market value and potential investment losses, presentations, website related cryptocurrency, finance. 3D render illustration. Market value price decrease illustrations Bitcoin cryptocurrency loss icon 3D render. Bitcoin coins falling arrows represents decline in cryptocurrency market value and potential investment losses, presentations, website related cryptocurrency, finance. 3D render illustration
Free with trial Golden bitcoin coin rests on wooden surface. Blurred red downward crypto chart in background. Digital currency investment risk, market loss financial volatility and value decrease. Market value price decrease illustrations Golden bitcoin coin rests on wooden surface. Blurred red downward crypto chart in background. Digital currency investment risk
Free with trial Red ipo market bubble like big fall. concept of initial public offering symbol and financial definition. cartoon flat trend modern investment logotype graphic design isolated on white background. Market value price decrease vectors Red ipo market bubble like big fall
Free with trial Red bar chart displays a stock market decline against a dark background, representing a financial crisis or economic downturn. This image highlights negative trends and losses in the market. Market value price decrease illustrations Red Bar Chart Displaying Stock Market Decline on Dark Background for Financial Crisis Concept. Red bar chart displays a stock market decline against a dark background, representing a financial crisis or economic downturn. This image highlights negative trends and losses in the market