Free with trial Oil price growth graph illustration. Oil pump icons on growing chart. Modern brochure, report or flyer design template. 3D rendering. Neon bulb illumination. Market value price decrease illustrations Oil price graph. Oil price growth graph illustration. Oil pump icons on growing chart. Modern brochure, report or flyer design template. 3D rendering. Neon bulb illumination
Free with trial Coin with dollar sign, downward arrow. Symbol of financial loss, cost reduction, decrease in value. Business concept. Market value price decrease vectors Orange coin with dollar sign and blue downward arrow representing financial loss or decreasing value concept business finance. Coin with dollar sign, downward. Coin with dollar sign, downward arrow. Symbol of financial loss, cost reduction, decrease in value. Business concept
Free with trial Coin with dollar sign, downward arrow. Symbol of financial loss, cost reduction, decrease in value. Business concept. Market value price decrease vectors Blue coin with dollar sign and orange downward arrow representing financial loss or decreasing value concept business finance. Coin with dollar sign, downward arrow. Symbol of financial loss, cost reduction, decrease in value. Business concept
Free with trial Red glossy 3D arrow with percentage symbol pointing down, representing price drops, sales, discount offers, interest rate cuts, or economic recession. Ideal for financial news, marketing campaigns, this image is generated using AI. Market value price decrease vectors Red glossy 3D arrow with percentage symbol pointing down, representing price drops, sales, discount offers, interest rate cuts, or
Free with trial This image depicts two contrasting scenarios of the housing market, one showing a positive upward trend and the other a negative downward trend. Market value price decrease illustrations Visual representation of real estate market trends showing both upward and downward fluctuations in housing prices and investment. This image depicts two contrasting scenarios of the housing market, one showing a positive upward trend and the other a negative downward trend
Free with trial Rise and fall of cryptocurrencies, flash crash of the bitcoin value. Market value price decrease vectors Sudden flash crash of the bitcoin value. Rise and fall of cryptocurrencies, flash crash of the bitcoin value
Free with trial Stock market candlestick chart with declining trend. 3D Rendering. Market value price decrease illustrations Stock market candlestick chart with declining trend.
Free with trial Linear hand with price or cost drop icon. concept of non effective expense or bankrupt sign. lineart simple trendy modern stats logotype graphic stroke art infographic design element isolated on white. Market value price decrease vectors Linear hand with price or cost drop icon
Free with trial Price down in view of scoreboard 3D illustration. Market value price decrease illustrations Price down
Free with trial The crash in the stock market. Market value price decrease vectors The crash in the stock market
Free with trial Financial or economic improvement during cryptocurrency market crash, stabilizing value of digital currency, risky game in stock exchange, countering inflation, man with umbrella protects bitcoin. Market value price decrease vectors Man with umbrella protects bitcoin
Free with trial Falling of real estate market, 3D rendering. Market value price decrease illustrations Falling of real estate market
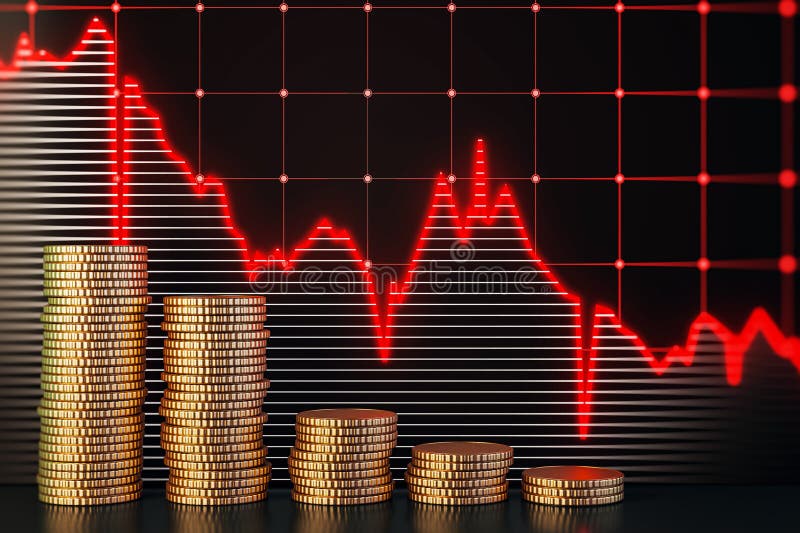
Free with trial Market Downturn Red candlestick chart on a grid background with metallic cylinder accents. Depth of field effect. Stock photo. Market value price decrease illustrations Market Downturn Red candlestick chart on a grid background with metallic cylinder accents. Depth of field effect
Free with trial Linear simple ipo market icon like big fall. concept of initial public offering symbol and financial definition. flat trend modern logotype graphic art design element isolated on white background. Market value price decrease vectors Linear simple ipo market icon like big fall
Free with trial Concept Declining Financial Market, Red Candlestick Background, Stock Market Graph, Economic Downturn Decline in financial market illustrated by red candlestick background in stock market graph. Market value price decrease illustrations Decline in financial market illustrated by red candlestick background in stock market graph. Concept Declining Financial Market, Red Candlestick Background, Stock Market Graph, Economic Downturn Decline in financial market illustrated by red candlestick background in stock market graph
Free with trial Three red arrows with percentage signs pointing down, symbolizing a financial decline or reduction, isolated on a transparent background. Market value price decrease vectors Three bright red downward pointing arrows with white percentage symbols signifying a decrease in value or interest rates isolated. Three red arrows with percentage signs pointing down, symbolizing a financial decline or reduction, isolated on a transparent background
Free with trial Dollar increase decrease icon. Money symbol with arrow stretching rising up and drop fall down. Business cost sale and reduction icon. vector illustration. Market value price decrease vectors Dollar increase decrease icon. Money symbol with arrow stretching rising up and drop fall down. Business cost sale and reduction i
Free with trial Silhouette of a head with stock market decline graph overlay, red and black tones, digital concept of financial crisis. 3D. Market value price decrease illustrations Silhouette of a head with stock market decline graph overlay, red and black tones, digital concept of financial crisis. 3D
Free with trial Bear market presents downtrend stock market. Market value price decrease vectors Bear market presents downtrend stock market
Free with trial Bear market presents downtrend stock market. Market value price decrease vectors Bear market presents downtrend stock market
Free with trial Bear market presents downtrend stock market. Market value price decrease vectors Bear market presents downtrend stock market
Free with trial Bear market presents downtrend stock market. Market value price decrease vectors Bear market presents downtrend stock market
Free with trial Businessman looks at a graph of the real estate market where the arrowhead is falling. recession Home prices fall in real estate and property market crash. isometric illustration vector. Market value price decrease vectors Home prices fall in real estate and property market crash
Free with trial 3D Isometric Flat Vector Conceptual Illustration of Real Estate And Property Market Crash, Housing Prices Falling Down. Market value price decrease vectors 3D Isometric Flat Vector Conceptual Illustration of Real Estate And Property Market Crash
Free with trial Concept of the real estate price bubble bursting. Market value price decrease illustrations Concept of real estate price bubble bursting
Free with trial Happy calculator with euro value increasing, 3d rendering. Market value price decrease illustrations Happy calculator with euro value increasing
Free with trial Bear market presents downtrend stock market. Market value price decrease vectors Bear market presents downtrend stock market
Free with trial Bear market presents downtrend stock market. Market value price decrease vectors Bear market presents downtrend stock market
Free with trial Oil loss of price or falling price oil illustrationeasy to modify. Market value price decrease illustrations Oil loss of price or falling price oil illustration
Free with trial Graph of real estate market where arrowhead is falling. recession House prices fall in real estate business. Real estate market downturn housing market is falling reduce. 3D render illustration. Market value price decrease illustrations Graph of real estate market where arrowhead is falling
Free with trial Bitcoin graph with the price going up and down on a blue blackground. Market value price decrease illustrations Bitcoin graph with the price going up and down
Free with trial House price decline concept with home and green arrow. 3D rendering isolated on white background. Market value price decrease illustrations House price decline concept with home and green arrow. 3D rendering
Free with trial The crash in the stock market. Market value price decrease vectors The crash in the stock market
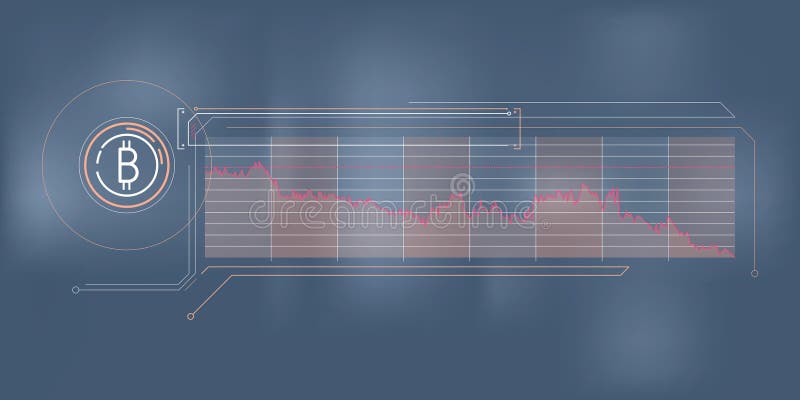
Free with trial Clean and simple abstract infographic about the fall of the bitcoin price. Vector illustration. Market value price decrease vectors Simple infographics about the fall of the bitcoin price. Clean and simple abstract infographic about the fall of the bitcoin price. Vector illustration.
Free with trial Clean and simple abstract infographic about the fall of the bitcoin price. Vector illustration. Market value price decrease illustrations Simple infographics about the fall of the bitcoin price. Clean and simple abstract infographic about the fall of the bitcoin price. Vector illustration.
Free with trial Oil falls in price. graph down. Diagram oil, price crisis, business petrol, arrow down, petroleum industry. Vector art abstract unusual fashion illustration. Market value price decrease vectors Oil falls in price. graph down
Free with trial Oil loss of price or falling price oil illustration easy to modify. Market value price decrease illustrations Oil loss of price or falling price oil illustration
Free with trial Fiery Bitcoin Coin Engulfed In Flames, Symbolizing The Volatile Nature Of Cryptocurrency, Representing Value, Investment, And The Potential For Both Growth And Risk. Cartoon Vector Illustration. Market value price decrease vectors Fiery Bitcoin Coin Engulfed In Flames, Symbolizing The Volatile Nature Of Cryptocurrency, Representing Value, Investment
Free with trial Bearish bitcoin trend concept bear market red background btc sign cryptocurrency investment. Market value price decrease illustrations Bitcoin bearish btc red market trend. Bearish bitcoin trend concept bear market red background btc sign cryptocurrency investment
Free with trial Business concept. Loans value. Investing ranking. Mortgage percentage. Interest rate change. Percent sign and arrows on cubes. 3d render. Market value price decrease illustrations Business concept. Loans value. Investing ranking
Free with trial Oil falls in price. Petrol down, gasoline and arrow, energy industry, price graph and chart, barrel crisis, black gold. Vector graphic illustration. Market value price decrease illustrations Oil falls in price
Free with trial Interest rate change. Business concept. Loans value. Investing ranking. Mortgage percentage. Percent sign and arrows on buttons. 3d render. Market value price decrease illustrations Interest rate change. Business concept. Loans value
Free with trial Rate cut concept in circle with thin line icons: cutting price, cost reduction, sale, discount, receipt, loyalty card, interest. Modern vector illustration. Market value price decrease vectors Rate cut concept in circle with thin line icons: cutting price, cost reduction, sale, discount, receipt, loyalty card, interest.
Free with trial Oil price growth graph illustration. Oil pump icons on growing chart. Field for text. Modern vector brochure, report or flyer design template. Market value price decrease vectors Oil price graph. Oil price growth graph illustration. Oil pump icons on growing chart. Field for text. Modern vector brochure, report or flyer design template.
Free with trial Rate cut concept in half circle with thin line icons: cutting price, cost reduction, sale, discount, receipt, loyalty card, interest. Modern vector illustration. Market value price decrease vectors Rate cut concept in half circle with thin line icons: cutting price, cost reduction, sale, discount, receipt, loyalty card
Free with trial Vector illustration Oil price decrease. Petroleum industry. Economic crisis. Drop prices to negative value. Low cost. Storage. Market crash. WTI West Texas Intermediate. Falling global oil demand. Market value price decrease vectors Oil Economic Crisis Drop prices falls down WTI. Vector illustration Oil price decrease. Petroleum industry. Economic crisis. Drop prices to negative value. Low cost. Storage. Market crash. WTI West Texas Intermediate. Falling global oil demand
Free with trial Vector illustration Oil price decrease. Petroleum industry. Economic crisis. Drop prices to negative value. Low cost. Storage. Market crash. WTI West Texas Intermediate. Falling global oil demand. Market value price decrease vectors Oil Economic Crisis Drop prices falls down WTI. Vector illustration Oil price decrease. Petroleum industry. Economic crisis. Drop prices to negative value. Low cost. Storage. Market crash. WTI West Texas Intermediate. Falling global oil demand
Free with trial Vector illustration Oil price decrease. Petroleum industry. Economic crisis. Drop prices to negative value. Low cost. Storage. Market crash. WTI West Texas Intermediate. Falling global oil demand. Market value price decrease vectors Oil Economic Crisis Drop prices falls down WTI. Vector illustration Oil price decrease. Petroleum industry. Economic crisis. Drop prices to negative value. Low cost. Storage. Market crash. WTI West Texas Intermediate. Falling global oil demand
Free with trial Vector illustration Oil price decrease. Petroleum industry. Economic crisis. Drop prices to negative value. Low cost. Storage. Market crash. WTI West Texas Intermediate. Falling global oil demand. Market value price decrease vectors Oil Economic Crisis Drop prices falls down WTI. Vector illustration Oil price decrease. Petroleum industry. Economic crisis. Drop prices to negative value. Low cost. Storage. Market crash. WTI West Texas Intermediate. Falling global oil demand
Free with trial Vector illustration Oil price decrease. Petroleum industry. Economic crisis. Drop prices to negative value. Low cost. Storage. Market crash. WTI West Texas Intermediate. Falling global oil demand. Market value price decrease vectors Oil Economic Crisis Drop prices falls down WTI. Vector illustration Oil price decrease. Petroleum industry. Economic crisis. Drop prices to negative value. Low cost. Storage. Market crash. WTI West Texas Intermediate. Falling global oil demand
Free with trial Vector illustration Oil price decrease. Petroleum industry. Economic crisis. Drop prices to negative value. Low cost. Storage. Market crash. WTI West Texas Intermediate. Falling global oil demand. Market value price decrease vectors Oil Economic Crisis Drop prices falls down WTI. Vector illustration Oil price decrease. Petroleum industry. Economic crisis. Drop prices to negative value. Low cost. Storage. Market crash. WTI West Texas Intermediate. Falling global oil demand
Free with trial Vector illustration Oil price decrease. Petroleum industry. Economic crisis. Drop prices to negative value. Low cost. Storage. Market crash. WTI West Texas Intermediate. Falling global oil demand. Market value price decrease vectors Oil Economic Crisis Drop prices falls down WTI. Vector illustration Oil price decrease. Petroleum industry. Economic crisis. Drop prices to negative value. Low cost. Storage. Market crash. WTI West Texas Intermediate. Falling global oil demand
Free with trial Oil falls in price. Petrol down, gasoline and arrow, energy industry, price graph and chart, barrel crisis, black gold. Vector graphic illustration. Market value price decrease illustrations Oil falls in price
Free with trial Businessman and mortgage interest rates. Percent sign in drawn red house. Real estate market, banks and home loan offer. Market value price decrease illustrations Businessman and mortgage interest rates. Percent sign in drawn red house. Real estate market, banks and home loan offer.
Free with trial Unhappy calculator with euro value decreasing, 3d rendering. Market value price decrease illustrations Unhappy calculator with euro value decreasing
Free with trial Clean and simple abstract infographic about the fall of the Solana price. Market value price decrease illustrations A simple infographic about the fall of the Solana price. Clean and simple abstract infographic about the fall of the Solana price.
Free with trial Dollar increase decrease icon. Money symbol with arrow stretching rising up and drop fall down. Business cost sale and reduction icon. vector illustration. Market value price decrease vectors Dollar increase decrease icon. Money symbol with arrow stretching rising up and drop fall down. Business cost sale and reduction
Free with trial Dollar increase decrease icon. Money symbol with arrow stretching rising up and drop fall down. Business cost sale and reduction icon. vector illustration. Market value price decrease vectors Dollar increase decrease icon. Money symbol with arrow stretching rising up and drop fall down. Business cost sale and reduction i
Free with trial Vector illustration Oil price decrease. Petroleum industry. Economic crisis. Drop prices to negative value. Low cost. Storage. Market crash. WTI West Texas Intermediate. Falling global oil demand. Market value price decrease vectors Oil Economic Crisis Drop prices falls down WTI. Vector illustration Oil price decrease. Petroleum industry. Economic crisis. Drop prices to negative value. Low cost. Storage. Market crash. WTI West Texas Intermediate. Falling global oil demand
Free with trial Vector illustration Oil price decrease. Petroleum industry. Economic crisis. Drop prices to negative value. Low cost. Storage. Market crash. WTI West Texas Intermediate. Falling global oil demand. Market value price decrease vectors Oil Economic Crisis Drop prices falls down WTI. Vector illustration Oil price decrease. Petroleum industry. Economic crisis. Drop prices to negative value. Low cost. Storage. Market crash. WTI West Texas Intermediate. Falling global oil demand
Free with trial Dollar increase decrease icon. Money symbol with arrow stretching rising up and drop fall down. Business cost sale and reduction icon. vector illustration. Market value price decrease vectors Dollar increase decrease icon. Money symbol with arrow stretching rising up and drop fall down. Business cost sale and reduction i
Free with trial Increase and decrease in prices on money and commodity goods. money trading to determine percentage of currency, concept vector illustration. can use for ui, web, mobile app, poster, banner, website, can be used for various businesses, needs and uses ranging from sales marketing advertisements and others. can also be used for UI ux presentation banners, poster documents, mobile web websites apps, applications, flayer. and can be used for print and online needs. Market value price decrease vectors Increase and decrease in prices on money and commodity goods. money trading to determine percentage of currency, concept vector il
Free with trial Loans value. Investing ranking. Mortgage percentage. Interest rate change. Business concept. Percent sign and arrows on buttons. 3d render. Market value price decrease illustrations Loans value. Investing ranking. Mortgage percentage. Interest rate change
Free with trial A vibrant red arrow points downward, resting on a silver coin, signifying a market decline. This 3D rendering, generated by AI, visually represents economic downturn or price reduction. Use it to illustrate concepts related to financial loss, market trends, and economic instability. Market value price decrease illustrations Falling Prices. A vibrant red arrow points downward, resting on a silver coin, signifying a market decline. This 3D rendering, generated by AI, visually represents economic downturn or price reduction. Use it to illustrate concepts related to financial loss, market trends, and economic instability.
Free with trial Clean and simple abstract infographic about the fall of the yen price. Vector illustration. Market value price decrease vectors Simple infographics about the fall of the yen price. Clean and simple abstract infographic about the fall of the yen price. Vector illustration.
Free with trial Bull Bear market presents downtrend stock market. Market value price decrease vectors Bull Bear market presents downtrend stock market
Free with trial Clean and simple abstract infographic about the fall of the pound sterling price. Vector illustration. Market value price decrease vectors Simple infographics about the fall of the pound sterling price. Clean and simple abstract infographic about the fall of the pound sterling price. Vector illustration.
Free with trial A dynamic 3D illustration of a glossy red arrow pointing downwards in a jagged, volatile path. Isolated on a white background, this graphic icon is a powerful symbol for negative concepts. It represents decline, decrease, failure, loss, and crisis. This visual is perfect for illustrating stock market crashes, economic recession, financial downturns, poor business performance, or any downward trend in data and statistics. An ideal element for reports, presentations, and financial news, with ample copy space. Market value price decrease illustrations Red Jagged Arrow of Decline - Financial Crisis Concept. A dynamic 3D illustration of a glossy red arrow pointing downwards in a jagged, volatile path. Isolated on a white background, this graphic icon is a powerful symbol for negative concepts. It represents decline, decrease, failure, loss, and crisis. This visual is perfect for illustrating stock market crashes, economic recession, financial downturns, poor business performance, or any downward trend in data and statistics. An ideal element for reports, presentations, and financial news, with ample copy space.
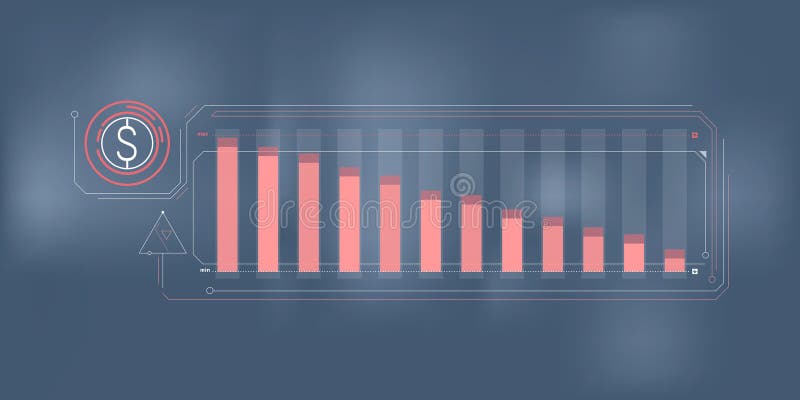
Free with trial Clear and concise infographic about dollar price fall. Vector illustration. Market value price decrease illustrations Abstract simple infographics of falling dollar price. Clear and concise infographic about dollar price fall. Vector illustration.
Free with trial Dollar price up down icon vector in line style - icon. Market value price decrease vectors Dollar price up down icon vector in line style
Free with trial Clean and simple abstract infographic about the fall of the Ethereum price. Market value price decrease illustrations A simple infographic about the fall of the Ethereum price. Clean and simple abstract infographic about the fall of the Ethereum price.
Free with trial Line icon recession the price of goods goes up and the value of the currency goes down. Market value price decrease vectors Line icon recession
Free with trial Unhappy calculator with decreasing real estate value, 3d rendering. Market value price decrease illustrations Unhappy calculator with decreasing real estate value, 3d rendering
Free with trial Abstract isometric view of multiple red arrows moving downward on a dark grid texture with selective focus. Business and finance concept illustrating a market crash, economic downturn, negative growth, and decreasing investment value. Market value price decrease illustrations Red down arrows on grid background representing financial decline and stock market crash. Abstract isometric view of multiple red arrows moving downward on a dark grid texture with selective focus. Business and finance concept illustrating a market crash, economic downturn, negative growth, and decreasing investment value.
Free with trial Clean and simple abstract infographic about the fall of the dollar price. Market value price decrease illustrations A simple infographic about the fall of the dollar price. Clean and simple abstract infographic about the fall of the dollar price.
Free with trial Oil price growth graph illustration. Oil pump icons on growing chart. Field for text. Modern vector brochure, report or flyer design template. Market value price decrease vectors Oil price graph. Oil price growth graph illustration. Oil pump icons on growing chart. Field for text. Modern vector brochure, report or flyer design template.
Free with trial Oil price fall graph illustration Oil pump icons Red arrow with world map. Market value price decrease vectors Oil price graph illustration. Oil price fall graph illustration Oil pump icons Red arrow with world map
Free with trial Oil price rise graph illustration Oil pump icons Red arrow. Market value price decrease vectors Oil price graph illustration. Oil price rise graph illustration Oil pump icons Red arrow
Free with trial Looking Bear market presents downtrend stock market. Market value price decrease vectors Looking Bear market presents downtrend stock market
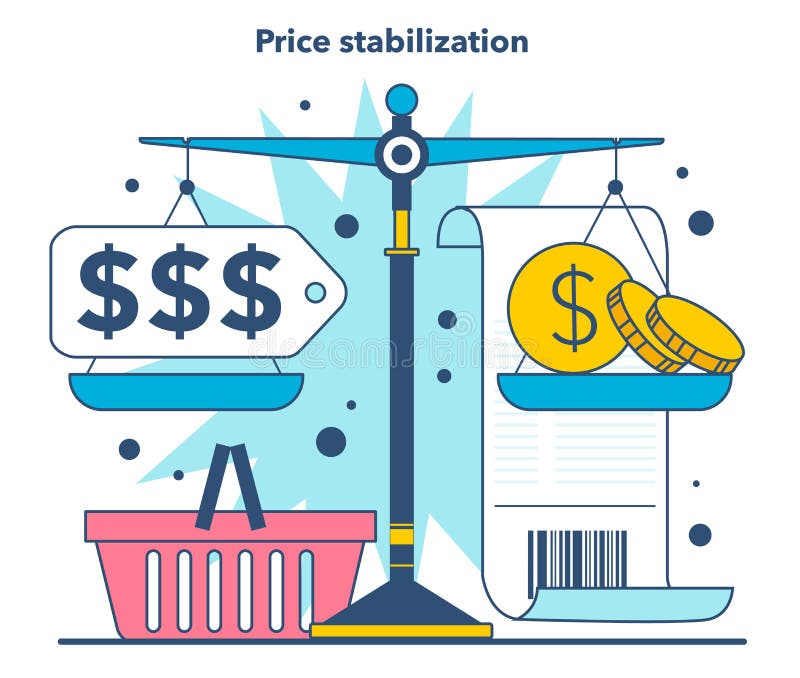
Free with trial Price stabilization as a inflation expectations cycle part. Economics crisis and value of money decline implications. Flat vector illustration. Market value price decrease vectors Price stabilization as a inflation expectations cycle part. Economics