Free with trial Stock market display with a red line graph indicating a downward trend on a digital screen. The graph is composed of jagged peaks and troughs, suggesting instability. Surrounding the graph are numeric data and grid lines, highlighting market performance details. The screen is located in a financial setting with a blurred, busy background, possibly an office or trading floor, enhancing the context of economic activity. The color red typically signifies a decrease or negative trend in market terms. Performance decrease illustrations Red Stock Market Crash On Screen. Stock market display with a red line graph indicating a downward trend on a digital screen. The graph is composed of jagged peaks and troughs, suggesting instability. Surrounding the graph are numeric data and grid lines, highlighting market performance details. The screen is located in a financial setting with a blurred, busy background, possibly an office or trading floor, enhancing the context of economic activity. The color red typically signifies a decrease or negative trend in market terms.
Free with trial Colorful bar chart illustrating a gradual decrease against a transparent background, highlighting a decline in data and signaling a negative financial trend or recession. Performance decrease vectors Bar chart gradually decreasing with transparent background. Colorful bar chart illustrating a gradual decrease against a transparent background, highlighting a decline in data and signaling a negative financial trend or recession
Free with trial A bar chart showing a steady decline with a red downward arrow, symbolizing financial loss, economic downturn, business decline, or negative performance trends. Performance decrease illustrations Economic Downtrend Bar Chart for Business concept 3d Rendering. A bar chart showing a steady decline with a red downward arrow, symbolizing financial loss, economic downturn, business decline, or negative performance trends
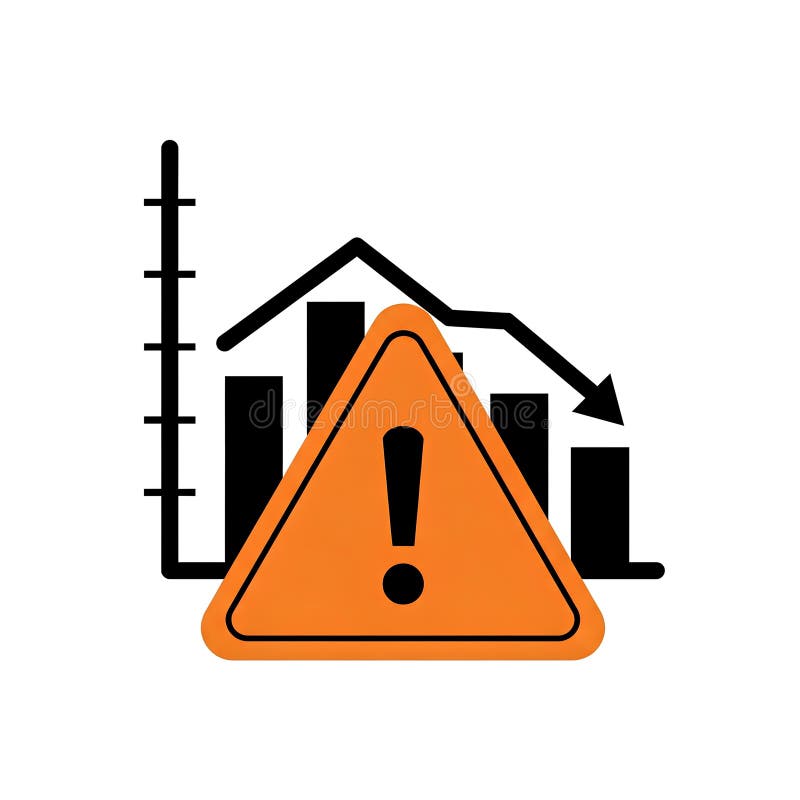
Free with trial Illustration of a downward trending graph with an orange warning sign in the foreground. The graph depicts a decline in performance or value. The warning sign highlights potential risks or negative outcomes. This image can be used to represent financial loss, economic downturn, business failure, or any situation where caution is advised. Performance decrease illustrations Warning Sign with Declining Graph. Illustration of a downward trending graph with an orange warning sign in the foreground. The graph depicts a decline in performance or value. The warning sign highlights potential risks or negative outcomes. This image can be used to represent financial loss, economic downturn, business failure, or any situation where caution is advised.
Free with trial Downturn showing downward trending graph with arrow indicating decline keywords: graph, chart, decline. Performance decrease illustrations Downward Trending Graph With Arrow Indicating Decline Keywords: graph, chart, decline, decrease. Downturn showing downward trending graph with arrow indicating decline keywords: graph, chart, decline
Free with trial Abstract illustration of business growth, featuring bar graphs and line graphs in shades of blue and grey. The image conveys concepts of data analysis, progress, and financial performance. Suitable for presentations, reports, and marketing materials related to business, finance, and technology. Performance decrease illustrations Abstract Business Growth Chart. Abstract illustration of business growth, featuring bar graphs and line graphs in shades of blue and grey. The image conveys concepts of data analysis, progress, and financial performance. Suitable for presentations, reports, and marketing materials related to business, finance, and technology.
Free with trial A black icon of a graph with a downward sloping curve and an arrow indicating decrease. Performance decrease illustrations Black graph showing a downward trend with an arrow and Y axis label chart data. A black icon of a graph with a downward sloping curve and an arrow indicating decrease
Free with trial Magnifying glass highlights poor analytics on chart, signed document, and sad emotion. Ideal for business, analytics, decline, review, research productivity failure. Simple flat metaphor. Performance decrease illustrations Analysis of Declining Trends with Signed Document and Performance Chart. Magnifying glass highlights poor analytics on chart, signed document, and sad emotion. Ideal for business, analytics, decline, review, research productivity failure. Simple flat metaphor
Free with trial A blue stopwatch displays a green arrow pointing downwards, symbolizing a decrease in time or a reduction in duration. Performance decrease illustrations Stopwatch with a downward arrow indicating time reduction. A blue stopwatch displays a green arrow pointing downwards, symbolizing a decrease in time or a reduction in duration
Free with trial Bar chart with falling growth, sad face icon, and signed financial document. Ideal for business reports, financial loss, analytics, economy, decline, strategy simple flat metaphor. Performance decrease vectors Declining Business Performance Indicated by Bar Chart and Sad Face Symbol. Bar chart with falling growth, sad face icon, and signed financial document. Ideal for business reports, financial loss, analytics, economy, decline, strategy simple flat metaphor
Free with trial Illustration showing financial data analysis with charts, idea lightbulb, and location pins, perfect for finance and business concepts. Performance decrease illustrations Analyzing Financial Data and Performance Charts Illustration. Illustration showing financial data analysis with charts, idea lightbulb, and location pins, perfect for finance and business concepts
Free with trial A bold red arrow with a zigzag pattern points downwards, symbolizing a negative trend, loss, or decrease. Performance decrease vectors Red arrow indicating downward trend or decline. A bold red arrow with a zigzag pattern points downwards, symbolizing a negative trend, loss, or decrease
Free with trial Line graph with plotted data points, bar chart, and triangular warning alert. Ideal for analytics, business, risk management, financial trends, forecasting, reporting performance tracking simple. Performance decrease vectors Data Analysis with Line Graph, Bar Chart, and Warning Sign for Risk Monitoring. Line graph with plotted data points, bar chart, and triangular warning alert. Ideal for analytics, business, risk management, financial trends, forecasting, reporting performance tracking simple
Free with trial Featuring "LOW PRICE" text on a lightbox overlaid with downward candlestick charts and percentage performance data. Performance decrease illustrations Low price trends and market entry opportunities reflected through real-time financial metrics and volatile trading indicators. Featuring 'LOW PRICE' text on a. Featuring "LOW PRICE" text on a lightbox overlaid with downward candlestick charts and percentage performance data.
Free with trial This image showcases a comprehensive collection of blue bar graphs and line graphs, presented in a grid format. Each graph depicts various data trends, including upward and downward movements, fluctuating patterns, and steady growth. The clean, modern design makes these icons ideal for representing financial data, market analysis, performance metrics, and business growth in presentations, reports, and websites. Performance decrease illustrations Collection of Blue Bar and Line Graphs for Business Analytics. This image showcases a comprehensive collection of blue bar graphs and line graphs, presented in a grid format. Each graph depicts various data trends, including upward and downward movements, fluctuating patterns, and steady growth. The clean, modern design makes these icons ideal for representing financial data, market analysis, performance metrics, and business growth in presentations, reports, and websites.
Free with trial A simple bar chart illustrating data trends with predominantly green bars indicating positive performance and one red bar suggesting a negative outcome, isolated on white. Performance decrease illustrations Bar chart with green and red bars isolated on white background. A simple bar chart illustrating data trends with predominantly green bars indicating positive performance and one red bar suggesting a negative outcome, isolated on white
Free with trial A bar chart showing a steady decline with a red downward arrow, symbolizing financial loss, economic downturn, business decline, or negative performance trends. Performance decrease illustrations Economic Downtrend Bar Chart for Business concept 3d Rendering. A bar chart showing a steady decline with a red downward arrow, symbolizing financial loss, economic downturn, business decline, or negative performance trends
Free with trial This image visually represents a financial decline or economic downturn. Several stacks of shiny gold coins are prominently featured, symbolizing wealth and financial assets. A large, bold red arrow points downwards, directly indicating a decrease or loss. The composition suggests a conceptual representation of falling stock prices, economic recession, or financial crisis. It's ideal for illustrating concepts related to investment losses, market crashes, or financial instability. Performance decrease illustrations Financial Downturn: Stacks of Gold Coins with Red Downward Arrow. This image visually represents a financial decline or economic downturn. Several stacks of shiny gold coins are prominently featured, symbolizing wealth and financial assets. A large, bold red arrow points downwards, directly indicating a decrease or loss. The composition suggests a conceptual representation of falling stock prices, economic recession, or financial crisis. It's ideal for illustrating concepts related to investment losses, market crashes, or financial instability.
Free with trial A visual representation of negative financial performance, illustrating a significant downward trend with a red arrow pointing downwards, indicating a loss or decline in value. Performance decrease illustrations Red graph showing a downward trend isolated on white background. A visual representation of negative financial performance, illustrating a significant downward trend with a red arrow pointing downwards, indicating a loss or decline in value
Free with trial A clean and modern digital illustration of a financial candlestick chart, displaying market trends and stock performance. The graph features blue candlesticks indicating price movements over time, accompanied by a solid blue line graph and subtle dashed trend lines. Set against a crisp white background with a clear grid, this visualization is ideal for illustrating concepts related to finance, investment, business analytics, economic forecasts, and data reporting. It conveys growth, volatility, and strategic decision-making in the stock market. Performance decrease illustrations Financial Candlestick Chart with Trend Line on White Background. A clean and modern digital illustration of a financial candlestick chart, displaying market trends and stock performance. The graph features blue candlesticks indicating price movements over time, accompanied by a solid blue line graph and subtle dashed trend lines. Set against a crisp white background with a clear grid, this visualization is ideal for illustrating concepts related to finance, investment, business analytics, economic forecasts, and data reporting. It conveys growth, volatility, and strategic decision-making in the stock market.
Free with trial A vibrant green arrow points upwards indicating progress or increase, while a glossy red arrow points downwards symbolizing decline or decrease, representing directional changes. Performance decrease illustrations Green up arrow and red down arrow icons symbolizing directional movement and change white background. A vibrant green arrow points upwards indicating progress or increase, while a glossy red arrow points downwards symbolizing decline or decrease, representing directional changes
Free with trial Line chart tracks data trends over time, with a downward arrow implying decline and a globe representing global impact. Ideal for analytics, performance, global strategy, tracking, economics, market. Performance decrease illustrations Line Chart with Data Points, Downward Arrow, and Globe for Analysis and Global Trends. Line chart tracks data trends over time, with a downward arrow implying decline and a globe representing global impact. Ideal for analytics, performance, global strategy, tracking, economics, market
Free with trial Bar graph showing decreasing values alongside arrows moving toward a minimal cloud. Ideal for data analysis, statistics, regression, performance tracking, economy, analytics, simple flat metaphor. Performance decrease vectors Declining Bar Chart with Arrows and Cloud Representing Regression or Data Flow. Bar graph showing decreasing values alongside arrows moving toward a minimal cloud. Ideal for data analysis, statistics, regression, performance tracking, economy, analytics, simple flat metaphor
Free with trial A compelling visual representation of declining retail sales or consumer spending, featuring a large green shopping bag alongside three progressively smaller white shopping bags. A prominent red arrow graphically illustrates a downward trend, symbolizing a decrease in market demand, economic downturn, or business loss. This 3D rendered image on a clean white background is ideal for financial reports, economic analysis, business presentations, or articles discussing retail challenges, recession, or reduced purchasing power. Performance decrease illustrations Retail Sales Decline Concept with Shopping Bags and Downward Arrow. A compelling visual representation of declining retail sales or consumer spending, featuring a large green shopping bag alongside three progressively smaller white shopping bags. A prominent red arrow graphically illustrates a downward trend, symbolizing a decrease in market demand, economic downturn, or business loss. This 3D rendered image on a clean white background is ideal for financial reports, economic analysis, business presentations, or articles discussing retail challenges, recession, or reduced purchasing power.
Free with trial A 3D icon features a blue pound sterling symbol within a white circle, which is bordered by a light blue ring. To the right of the circle, a small orange circle contains a white downward-pointing triangle, indicating a decrease or fall. The icon is presented on a clean white background with a subtle shadow. Performance decrease illustrations 3D Icon with Pound Sterling Symbol and Downward Arrow on White Background currency money. A 3D icon features a blue pound sterling symbol within a white circle, which is bordered by a light blue ring. To the right of the circle, a small orange circle contains a white downward-pointing triangle, indicating a decrease or fall. The icon is presented on a clean white background with a subtle shadow
Free with trial Vibrant financial decisions shown through floating digital market charts --chaos 55 --ar 16:9 --profile 8vfa4lb --v 7 Job ID: 73c43520-d3ac-4d75-940e-9fab8db6f1ed. Generative AI. Performance decrease illustrations Red Arrow Decrease on Stock Market Graph Showing Economic Downturn and Financial Decline. Vibrant financial decisions shown through floating digital market charts --chaos 55 --ar 16:9 --profile 8vfa4lb --v 7 Job ID: 73c43520-d3ac-4d75-940e-9fab8db6f1ed. Generative AI
Free with trial Shopping cart with a downward arrow, bar graph indicating loss, and sad face illustrating declining sales or performance. Ideal for business, ecommerce, market decline, economic loss, analytics. Performance decrease vectors Declining Sales Concept with Shopping Cart, Downward Arrow, Bar Graph, and Sad Face. Shopping cart with a downward arrow, bar graph indicating loss, and sad face illustrating declining sales or performance. Ideal for business, ecommerce, market decline, economic loss, analytics
Free with trial Displaying dashboard on screen showing red arrow trending down over bar chart and colorful lines. Analytics, visualization, data, performance, digital, insight, metrics. Performance decrease illustrations Displaying dashboard on screen showing red arrow trending down over bar chart and colorful lines
Free with trial The image shows a conference room with a long wooden table and black leather chairs. a silver line graph depicting a downward trend is placed on the table. the graph starts high on the left and gradually declines towards the right, indicating a loss or decrease. the room is well-lit with ceiling lights. the background is blurred, focusing attention on the graph and the table. a painting is visible on the wall. Performance decrease illustrations Decreasing graph on conference room table view. the image shows a conference room with a long wooden table and black leather chairs. a silver line graph depicting a downward trend is placed on the table. the graph starts high on the left and gradually declines towards the right, indicating a loss or decrease. the room is well-lit with ceiling lights. the background is blurred, focusing attention on the graph and the table. a painting is visible on the wall.
Free with trial The image displays a financial trend chart superimposed on a modern office setting. the chart depicts a declining trend, indicated by a downward-sloping line with an arrow pointing downwards. the background features a blurred office environment with windows, a plant, and furniture, creating a sense of realism and context for the financial data. the overall composition suggests a reflection or projection of financial performance within a contemporary workspace. Performance decrease illustrations Financial decline chart in modern office space. the image displays a financial trend chart superimposed on a modern office setting. the chart depicts a declining trend, indicated by a downward-sloping line with an arrow pointing downwards. the background features a blurred office environment with windows, a plant, and furniture, creating a sense of realism and context for the financial data. the overall composition suggests a reflection or projection of financial performance within a contemporary workspace.
Free with trial The image depicts a stylized representation of a business downturn chart. the chart is rendered as a glowing white line against a black background, creating a stark contrast. the line graph shows a clear downward trend, indicating a decline in business performance. the words "business downtorn" are visible above the chart. a reflective surface below the chart creates a mirrored image, enhancing the visual impact. the overall aesthetic is modern and minimalist, conveying a sense of concern about economic decline. Performance decrease illustrations Business downtorn chart with reflection effect. the image depicts a stylized representation of a business downturn chart. the chart is rendered as a glowing white line against a black background, creating a stark contrast. the line graph shows a clear downward trend, indicating a decline in business performance. the words "business downtorn" are visible above the chart. a reflective surface below the chart creates a mirrored image, enhancing the visual impact. the overall aesthetic is modern and minimalist, conveying a sense of concern about economic decline.
Free with trial Line graph with downward trend, sad face for dissatisfaction, alert bell for warning, and magnifier symbolizing evaluation. Ideal for data analysis, performance tracking, decline, warning, failure. Performance decrease vectors Declining Graph with Sad Face, Alert Bell, and Magnifier Indicating Negative Trends. Line graph with downward trend, sad face for dissatisfaction, alert bell for warning, and magnifier symbolizing evaluation. Ideal for data analysis, performance tracking, decline, warning, failure
Free with trial Red sad face beside a line graph showing a downward trend and a bar graph. Ideal for business loss, economic decline, performance issues, challenges, setbacks, analytics, trends. Simple flat metaphor. Performance decrease vectors Declining Chart with Sad Face and Bar Graph Representing Negative Trend and Challenges. Red sad face beside a line graph showing a downward trend and a bar graph. Ideal for business loss, economic decline, performance issues, challenges, setbacks, analytics, trends. Simple flat metaphor
Free with trial The image shows a stylized, neon blue graph depicting a downward trend, overlaid on a background resembling the interior of a theater or auditorium. the graph is composed of many small, glowing particles, giving it a digital or futuristic appearance. the background features rows of empty seats and stage lighting, suggesting a performance venue. the overall impression is one of economic downturn or financial loss, visualized in an unusual and somewhat theatrical setting. Performance decrease illustrations Declining stock market graph in theater setting. the image shows a stylized, neon blue graph depicting a downward trend, overlaid on a background resembling the interior of a theater or auditorium. the graph is composed of many small, glowing particles, giving it a digital or futuristic appearance. the background features rows of empty seats and stage lighting, suggesting a performance venue. the overall impression is one of economic downturn or financial loss, visualized in an unusual and somewhat theatrical setting.
Free with trial The image features a neon white line graph depicting a downward trend, suggesting a decline in value or performance. the graph is set against a dark background, creating a stark contrast that emphasizes the neon light. the presence of shimmering particles around the line adds a sense of movement. a reflective surface below mirrors the graph, enhancing the visual impact and creating a sense of depth. Performance decrease illustrations Neon downward trend line with reflection effect. the image features a neon white line graph depicting a downward trend, suggesting a decline in value or performance. the graph is set against a dark background, creating a stark contrast that emphasizes the neon light. the presence of shimmering particles around the line adds a sense of movement. a reflective surface below mirrors the graph, enhancing the visual impact and creating a sense of depth.
Free with trial Closeup of a hand holding vibrant blue graph, illustrating data trends and analysis ,Generative ai. Performance decrease illustrations Hand holding a blue graph, data analysis, trends, and performance insights closeup. Closeup of a hand holding vibrant blue graph, illustrating data trends and analysis ,Generative ai
Free with trial A simple red line graph showing a sharp downward trend, indicating a significant decrease or loss in value, isolated against a clean white background for clarity. Performance decrease illustrations Red downward trending graph isolated on white background. A simple red line graph showing a sharp downward trend, indicating a significant decrease or loss in value, isolated against a clean white background for clarity
Free with trial A striking 3D-rendered image featuring a blue hand emerging from the left side, gripping a red zigzag arrow pointing downward against a solid light blue background. The arrow symbolizes a decline in metrics such as financial performance, market trends, or business growth. This image is ideal for use in economic reports, editorial content, business presentations, and visual storytelling focused on loss, downturns, or negative growth. The clean design and bold color contrast make it a powerful metaphor for financial challenges and strategic analysis. Performance decrease illustrations . A striking 3D-rendered image featuring a blue hand emerging from the left side, gripping a red zigzag arrow pointing downward against a solid light blue background. The arrow symbolizes a decline in metrics such as financial performance, market trends, or business growth. This image is ideal for use in economic reports, editorial content, business presentations, and visual storytelling focused on loss, downturns, or negative growth. The clean design and bold color contrast make it a powerful metaphor for financial challenges and strategic analysis.
Free with trial A glossy, vibrant red arrow makes a sharp downward curve. This dynamic visual represents a negative trend, decrease, or a directional shift towards a lower point. Performance decrease illustrations Shiny red arrow curves downward symbolizing decline or negative trend. A glossy, vibrant red arrow makes a sharp downward curve. This dynamic visual represents a negative trend, decrease, or a directional shift towards a lower point
Free with trial Sad face symbolizing dissatisfaction or issues, with data point focus and declining performance graph. Ideal for business analytics, performance drops, feedback, emotions, troubleshooting, reporting. Performance decrease illustrations Sad face with declining graph and focus on data highlighting underperformance and issues. Sad face symbolizing dissatisfaction or issues, with data point focus and declining performance graph. Ideal for business analytics, performance drops, feedback, emotions, troubleshooting, reporting
Free with trial A graphic representing a 50 percent reduction or decline, depicted by a red arrow and percentage. Performance decrease illustrations Red downward arrow indicating 50 percent decrease within a curved arc. A graphic representing a 50 percent reduction or decline, depicted by a red arrow and percentage
Free with trial Colorful line graph illustrating growth and decline over time, with variously colored data points on a dark background, visualizing financial performance and trends. Performance decrease vectors Colorful line graph illustrating growth and decline over time, with variously colored data points on a dark background
Free with trial Global RAM Shortage Crisis Impacting Computer Hardware Market and Semiconductor Supply Chain with Declining Performance Trend. Performance decrease vectors Global RAM Shortage Crisis Impacting Computer Hardware Market and Semiconductor Supply Chain
Free with trial A visual representation of a declining financial trend, depicted by a bar chart with a red arrow indicating a downward movement, symbolizing loss or poor performance. Performance decrease illustrations Bar chart with downward trending red arrow isolated on white background. A visual representation of a declining financial trend, depicted by a bar chart with a red arrow indicating a downward movement, symbolizing loss or poor performance
Free with trial This graphic features two distinct 3D arrows. A vibrant green arrow points upward, symbolizing increase, progress, or positive movement. Alongside it, a bold red arrow points downward, indicating a decrease, decline, or negative trend. Performance decrease illustrations Green up arrow and red down arrow symbols representing growth and decline finances or data white background. This graphic features two distinct 3D arrows. A vibrant green arrow points upward, symbolizing increase, progress, or positive movement. Alongside it, a bold red arrow points downward, indicating a decrease, decline, or negative trend
Free with trial This image is a simple vector graphic depicting a downward trending line graph. The graph is enclosed in a square with a bold black border and shows a blue line indicating a decrease in values over ti. Performance decrease illustrations Downward Trend Graph, Data Decline Icon. This image is a simple vector graphic depicting a downward trending line graph. The graph is enclosed in a square with a bold black border and shows a blue line indicating a decrease in values over ti
Free with trial This image is a simple vector graphic depicting a downward trending line graph. The graph is enclosed in a square with a bold black border and shows a blue line indicating a decrease in values over ti. Performance decrease illustrations Downward Trend Graph, Data Decline Icon. This image is a simple vector graphic depicting a downward trending line graph. The graph is enclosed in a square with a bold black border and shows a blue line indicating a decrease in values over ti
Free with trial Horizontal scale ranging from minus to plus is indicating volume control, measurement, performance, or value on a blue background. 3D render. Performance decrease illustrations Horizontal colorful scale showing measurement on blue background. Horizontal scale ranging from minus to plus is indicating volume control, measurement, performance, or value on a blue background. 3D render
Free with trial A financial graph depicting a downward trend with a red arrow, blue bar chart, and white line graph on a dark blue grid background. Ideal for illustrating market decline, revenue loss, or negative performance in business, finance, and economic presentations. Performance decrease illustrations Declining Financial Graph Red Arrow and Bar Chart on Dark Grid Background. A financial graph depicting a downward trend with a red arrow, blue bar chart, and white line graph on a dark blue grid background. Ideal for illustrating market decline, revenue loss, or negative performance in business, finance, and economic presentations.
Free with trial Downward arrow, spiral calendar, and bar graph signifying trend analysis, scheduling, and metrics. Ideal for time management, progress tracking, productivity, data analytics planning forecasting. Performance decrease vectors Calendar, Downward Arrow, and Bar Graph Representing Time Management and Performance Analysis. Downward arrow, spiral calendar, and bar graph signifying trend analysis, scheduling, and metrics. Ideal for time management, progress tracking, productivity, data analytics planning forecasting
Free with trial A neon purple line graph shows a steep downward trend against a stark black background, symbolizing financial loss or negative performance. Performance decrease illustrations Vibrant neon purple graph illustrates sharp decline on black background. A neon purple line graph shows a steep downward trend against a stark black background, symbolizing financial loss or negative performance
Free with trial A bar graph illustrates a decreasing trend in financial performance, indicated by a red arrow and a dollar symbol. Performance decrease illustrations Bar chart showing financial decline with downward trend and dollar sign. A bar graph illustrates a decreasing trend in financial performance, indicated by a red arrow and a dollar symbol
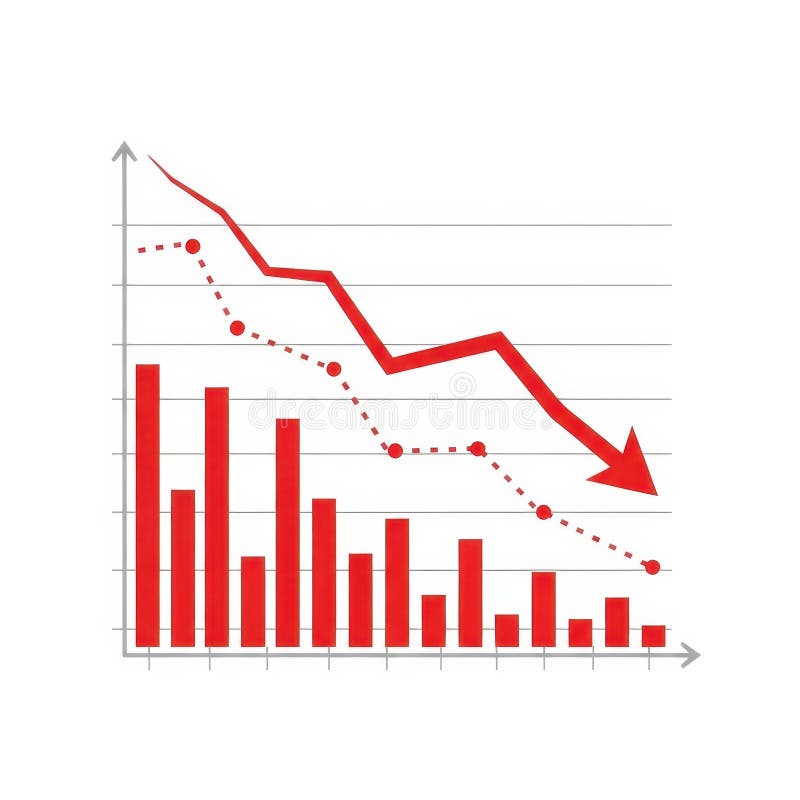
Free with trial This infographic displays a bar graph illustrating a sharp negative trend. The red line clearly depicts a significant decrease, showcasing concepts like downturn, recession, and loss within a business or financial context. Ideal for presentations, reports, and analyses highlighting negative market trends or economic decline, generated by AI. Performance decrease illustrations Decreasing bar graph showing negative trend decline. This infographic displays a bar graph illustrating a sharp negative trend. The red line clearly depicts a significant decrease, showcasing concepts like downturn, recession, and loss within a business or financial context. Ideal for presentations, reports, and analyses highlighting negative market trends or economic decline, generated by AI.
Free with trial A line graph illustrates a steady decline in values, featuring a blue line dropping toward a bright red arrow indicating a significant downward trend over time. Performance decrease illustrations Declining trend in data representation shows significant decrease over time. A line graph illustrates a steady decline in values, featuring a blue line dropping toward a bright red arrow indicating a significant downward trend over time.
Free with trial This image showcases vibrant 3D bar and line charts, generated by AI, offering a dynamic visual representation of business data. The colorful design effectively communicates trends and comparisons across multiple data sets, providing a clear and engaging overview of key performance indicators. Performance decrease illustrations AI-Generated 3D Business Charts. This image showcases vibrant 3D bar and line charts, generated by AI, offering a dynamic visual representation of business data. The colorful design effectively communicates trends and comparisons across multiple data sets, providing a clear and engaging overview of key performance indicators.
Free with trial A vibrant collection of hand-drawn business charts and graphs, rendered in blue tones. The set includes various types of visualizations like bar charts, line graphs, and a pie chart, all with a sketchy, illustrative style. These visuals are ideal for presentations, reports, and infographics related to finance, data analysis, growth, and business performance. Performance decrease illustrations Hand-Drawn Business Charts and Graphs Collection. A vibrant collection of hand-drawn business charts and graphs, rendered in blue tones. The set includes various types of visualizations like bar charts, line graphs, and a pie chart, all with a sketchy, illustrative style. These visuals are ideal for presentations, reports, and infographics related to finance, data analysis, growth, and business performance.
Free with trial This image features two prominent arrows pointing upwards one green and one red symbolizing contrasting financial performance or progress in different areas. Performance decrease illustrations Two upward arrows green and red showing growth progress and contrasting trends. This image features two prominent arrows pointing upwards one green and one red symbolizing contrasting financial performance or progress in different areas
Free with trial A bar chart showing a steady decline with a red downward arrow, symbolizing financial loss, economic downturn, business decline, or negative performance trends. Performance decrease illustrations Economic Downtrend Bar Chart for Business concept 3d Rendering. A bar chart showing a steady decline with a red downward arrow, symbolizing financial loss, economic downturn, business decline, or negative performance trends
Free with trial A bar chart showing a steady decline with a red downward arrow, symbolizing financial loss, economic downturn, business decline, or negative performance trends. Performance decrease illustrations Economic Downtrend Bar Chart for Business concept 3d Rendering. A bar chart showing a steady decline with a red downward arrow, symbolizing financial loss, economic downturn, business decline, or negative performance trends
Free with trial Downward line graph with sad face reflecting poor performance, folder with binary data, and cloud element. Ideal for finance, analytics, failure, statistics, digital storage, emotions simple flat. Performance decrease illustrations Negative trend in data analysis with declining graph, sad face, and digital file management. Downward line graph with sad face reflecting poor performance, folder with binary data, and cloud element. Ideal for finance, analytics, failure, statistics, digital storage, emotions simple flat
Free with trial A striking red arrow curves downward, representing economic downturn, financial loss, or a negative trend. This visual metaphor is perfect for presentations on market changes or business performance. Performance decrease illustrations Red downward arrow symbolizing decline and negative trend in business and finance. A striking red arrow curves downward, representing economic downturn, financial loss, or a negative trend. This visual metaphor is perfect for presentations on market changes or business performance
Free with trial Sad face beside declining line graph and bar chart, symbolizing setbacks. Ideal for finance, business, economy, loss, analytics, crisis performance. Simple flat metaphor. Performance decrease vectors Negative Trend Line and Declining Bar Chart Representing Business Loss or Financial Downturn. Sad face beside declining line graph and bar chart, symbolizing setbacks. Ideal for finance, business, economy, loss, analytics, crisis performance. Simple flat metaphor
Free with trial A red line graph shows a steady decline in values over a period. The downward trajectory reflects a significant decrease, with data points plotted against a grid background. Performance decrease illustrations Declining trend line illustrates significant downward movement in data over time. A red line graph shows a steady decline in values over a period. The downward trajectory reflects a significant decrease, with data points plotted against a grid background.
Free with trial Downward trend graph with large sad face and woman in casual attire. Ideal for business performance, feedback, failure, regret, decisions, emotions, analytics. Clean simple flat metaphor. Performance decrease vectors Declining Trend Graph with Sad Face and Casual Woman Highlighting Failure or Negative Feedback. Downward trend graph with large sad face and woman in casual attire. Ideal for business performance, feedback, failure, regret, decisions, emotions, analytics. Clean simple flat metaphor
Free with trial A vibrant image featuring a thick, textured green arrow pointing upwards, symbolizing growth, success, and progress. Contrasting this, a bold red arrow points downwards, representing decline, loss, and failure. Both arrows are rendered with a painterly style, suggesting a hand-drawn or artistic representation of financial or market trends. The clean white background isolates the arrows, emphasizing their symbolic meaning. This visual is ideal for illustrating concepts like stock market fluctuations, business performance, positive and negative trends, or decision-making. Performance decrease illustrations Up and Down Arrows: Growth vs. Decline. A vibrant image featuring a thick, textured green arrow pointing upwards, symbolizing growth, success, and progress. Contrasting this, a bold red arrow points downwards, representing decline, loss, and failure. Both arrows are rendered with a painterly style, suggesting a hand-drawn or artistic representation of financial or market trends. The clean white background isolates the arrows, emphasizing their symbolic meaning. This visual is ideal for illustrating concepts like stock market fluctuations, business performance, positive and negative trends, or decision-making.
Free with trial A striking red arrow curves downwards, symbolizing a financial downturn economic recession or declining performance. This graphic conveys a clear message of loss, regression, or negative trends. Performance decrease illustrations Red downward arrow symbol showing decline and negative trend in business and finance. A striking red arrow curves downwards, symbolizing a financial downturn economic recession or declining performance. This graphic conveys a clear message of loss, regression, or negative trends
Free with trial A conceptual vector illustration depicting business analysis and market research. A hand holds a magnifying glass, focusing on a colorful financial chart with bar and line graphs labeled 'Market Trends'. Surrounding icons represent key business metrics like growth, decline, market share, and innovation. This flat design graphic is ideal for presentations, reports, and web content related to data analytics, strategic planning, and financial performance evaluation, symbolizing the scrutiny of data to identify opportunities and understand market dynamics. Performance decrease illustrations Business Analysis and Market Trends Concept with Magnifying Glass. A conceptual vector illustration depicting business analysis and market research. A hand holds a magnifying glass, focusing on a colorful financial chart with bar and line graphs labeled 'Market Trends'. Surrounding icons represent key business metrics like growth, decline, market share, and innovation. This flat design graphic is ideal for presentations, reports, and web content related to data analytics, strategic planning, and financial performance evaluation, symbolizing the scrutiny of data to identify opportunities and understand market dynamics.
Free with trial Understanding bar graph charts data analysis and visualization for business and financial performance metrics. Performance decrease vectors Understanding bar graph charts data analysis and visualization for business
Free with trial A 3D illustration of a statistic down icon isolated on a white background symbolizing decline in data or business performance. Performance decrease illustrations Statistic down 3D illustration. A 3D illustration of a statistic down icon isolated on a white background symbolizing decline in data or business performance
Free with trial A 3D illustration of a statistic down icon isolated on a white background symbolizing decline in data or business performance. Performance decrease illustrations Statistic down 3D illustration. A 3D illustration of a statistic down icon isolated on a white background symbolizing decline in data or business performance
Free with trial A conceptual vector illustration depicting the duality of business performance. On a modern teal background, two reports are shown side-by-side. One features a rising red graph symbolizing growth, profit, and success, while the other displays a descending graph representing decline, loss, and failure. This flat design graphic is ideal for financial analysis, market trend comparisons, business presentations, and infographics illustrating opposite outcomes or strategic choices. The long shadow effect adds a contemporary feel to the design. Performance decrease vectors Growth and Decline Business Charts Comparison. A conceptual vector illustration depicting the duality of business performance. On a modern teal background, two reports are shown side-by-side. One features a rising red graph symbolizing growth, profit, and success, while the other displays a descending graph representing decline, loss, and failure. This flat design graphic is ideal for financial analysis, market trend comparisons, business presentations, and infographics illustrating opposite outcomes or strategic choices. The long shadow effect adds a contemporary feel to the design.
Free with trial A bold, three-dimensional red arrow is prominently displayed, pointing directly downwards. The arrow is cast against a textured, light-colored wall, creating a stark contrast. A dramatic shadow of the arrow is cast on the wall to its left, adding depth and visual interest. The lighting suggests a single light source, casting sharp shadows and highlighting the arrow's form. This image effectively symbolizes decline, decrease, failure, or a downward trend in various contexts, such as finance, business, or performance. Performance decrease illustrations Red Arrow Pointing Downward Against Textured Wall. A bold, three-dimensional red arrow is prominently displayed, pointing directly downwards. The arrow is cast against a textured, light-colored wall, creating a stark contrast. A dramatic shadow of the arrow is cast on the wall to its left, adding depth and visual interest. The lighting suggests a single light source, casting sharp shadows and highlighting the arrow's form. This image effectively symbolizes decline, decrease, failure, or a downward trend in various contexts, such as finance, business, or performance.
Free with trial This image showcases a person using a tablet to interact with business analytics data, generated by AI. The visualization includes graphs and charts, providing real-time insights into key performance indicators. This technology streamlines business decision-making. Performance decrease illustrations AI-Powered Business Analytics. This image showcases a person using a tablet to interact with business analytics data, generated by AI. The visualization includes graphs and charts, providing real-time insights into key performance indicators. This technology streamlines business decision-making.
Free with trial A visual representation of negative financial performance and economic downturn. This graphic depicts a sharp decline, indicating losses and a downward trend in market or business metrics. Performance decrease vectors Red downward trending graph with arrow signifying financial decline and economic recession concept. A visual representation of negative financial performance and economic downturn. This graphic depicts a sharp decline, indicating losses and a downward trend in market or business metrics
Free with trial Circular bar chart with red upward arrow and dark gray downward arrow icon for growth and analytics featuring improvement, decrease, trend with. Performance decrease vectors Circular bar chart with red upward arrow and dark gray downward arrow icon for growth
Free with trial This image displays a financial growth chart, featuring both a candlestick chart and a bar graph, laid out on a wooden surface. The candlestick chart illustrates stock market fluctuations with red and green candles, while the bar graph shows increasing values over time. The overall composition suggests positive financial trends, investment performance, and economic progress. It's ideal for representing concepts like business growth, market analysis, financial planning, and investment strategies. Performance decrease illustrations Financial Growth Chart with Candlestick and Bar Graph. This image displays a financial growth chart, featuring both a candlestick chart and a bar graph, laid out on a wooden surface. The candlestick chart illustrates stock market fluctuations with red and green candles, while the bar graph shows increasing values over time. The overall composition suggests positive financial trends, investment performance, and economic progress. It's ideal for representing concepts like business growth, market analysis, financial planning, and investment strategies.
Free with trial Abstract 3D render of a descending bar chart made of blue glass rectangles. The bars are reflected on a glossy surface, creating a clean and modern aesthetic. The image can be used to represent data visualization, financial trends, business performance, or concepts like decline, recession, or negative growth. The cool blue color palette adds a sense of calm and professionalism. Performance decrease illustrations Abstract Blue Glass Bar Chart. Abstract 3D render of a descending bar chart made of blue glass rectangles. The bars are reflected on a glossy surface, creating a clean and modern aesthetic. The image can be used to represent data visualization, financial trends, business performance, or concepts like decline, recession, or negative growth. The cool blue color palette adds a sense of calm and professionalism.
Free with trial Black filled database icon with downward arrow representing decrease, reduction, or lower status. Performance decrease vectors Database Downward Arrow Icon. Black filled database icon with downward arrow representing decrease, reduction, or lower status.