Free with trial A stark vector illustration of a bar chart showing a sharp decrease, indicated by a downward-pointing red arrow. This icon effectively represents economic downturns, financial losses, declining trends, or negative performance metrics. Ideal for business reports, financial analysis, or news graphics, vector design Generative AI. Performance decrease vectors . A stark vector illustration of a bar chart showing a sharp decrease, indicated by a downward-pointing red arrow. This icon effectively represents economic downturns, financial losses, declining trends, or negative performance metrics. Ideal for business reports, financial analysis, or news graphics, vector design Generative AI
Free with trial A visual representation of declining data points connected by a red line. This graphic effectively illustrates a negative trend or decrease over time, suitable for financial or performance reports. Performance decrease illustrations Data trend analysis showing downward trajectory with red dots and connecting line vector. A visual representation of declining data points connected by a red line. This graphic effectively illustrates a negative trend or decrease over time, suitable for financial or performance reports
Free with trial Hand interacting with blue chart, analyzing growth, trends, and financial performance data ,Generative ai. Performance decrease illustrations Hand analyzing blue chart, deciphering growth trends and financial performance for business success. Hand interacting with blue chart, analyzing growth, trends, and financial performance data ,Generative ai
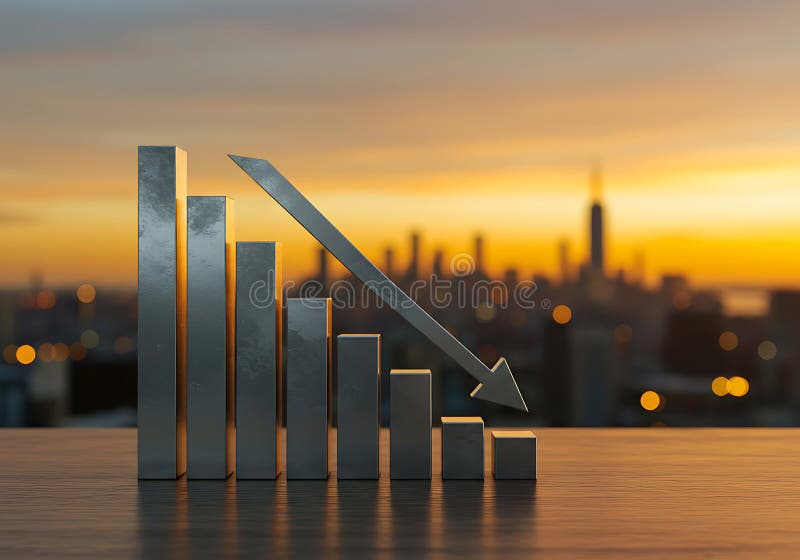
Free with trial Falling Performance Shown in 3D Business Data Chart - 3D chart displays a decline in business performance, highlighting negative growth. Performance decrease illustrations Falling Performance Shown in 3D Business Data Chart
Free with trial Down Trend Line Outline Arrow Pointing Downward Decrease Profits Sales Market Business Finance Black White Icon Sign Symbol Vector Illustration Artwork. Performance decrease vectors Down Trend Line Outline Arrow Pointing Downward Decrease Profits Sales Market Business Finance Black White Icon
Free with trial A 3D rendered icon featuring a golden bar graph with a downward trend line and a red arrow indicating a decrease. The graph is set on a black circular background with a prominent gold rim. This symbol represents financial decline, loss, or negative performance. Performance decrease illustrations Golden Graph with Downward Trend Arrow on Black Circle with Gold Rim chart falling. A 3D rendered icon featuring a golden bar graph with a downward trend line. A 3D rendered icon featuring a golden bar graph with a downward trend line and a red arrow indicating a decrease. The graph is set on a black circular background with a prominent gold rim. This symbol represents financial decline, loss, or negative performance
Free with trial Falling bar chart with decrease red arrow symbol design. Business Icon. Performance decrease vectors Falling bar chart with decrease red arrow symbol design
Free with trial Male avatar in a circle next to a declining bar chart. Ideal for progress, profile data, analytics, user stats, report analysis, business performance, visualization. Simple flat metaphor. Performance decrease illustrations Profile Avatar with Bar Chart Representing Performance and Analytics Data. Male avatar in a circle next to a declining bar chart. Ideal for progress, profile data, analytics, user stats, report analysis, business performance, visualization. Simple flat metaphor
Free with trial Social media marketing graph showing decrease with thumbs up icons, isometric vector illustration. Performance decrease vectors Graph showing decrease in social media marketing with thumbs up icons. Social media marketing graph showing decrease with thumbs up icons, isometric vector illustration
Free with trial A bold black line graph icon showing a downward trend with an arrow. Symbolizes financial downturn, sales decrease, or negative performance metrics. Clear visual for business reports and data analysis indicating a decline value. vector design Generative AI. Performance decrease vectors Bold Decreasing Line Graph Icon Financial Downturn Data vector design Generative AI. A bold black line graph icon showing a downward trend with an arrow. Symbolizes financial downturn, sales decrease, or negative performance metrics. Clear visual for business reports and data analysis indicating a decline value. vector design Generative AI
Free with trial Blue downward arrow, circular user avatar, abstract line, and curve visuals. Ideal for analytics, statistics, loss, user activity disengagement performance digital trends. Clean flat metaphor. Performance decrease illustrations Downward Arrow and User Avatar Representing Decline or Decrease in User Activity. Blue downward arrow, circular user avatar, abstract line, and curve visuals. Ideal for analytics, statistics, loss, user activity disengagement performance digital trends. Clean flat metaphor
Free with trial Visualizing a sharp downward trend, this graphic powerfully represents financial downturns and declining business performance, ideal for economic analyses and cautionary tales. Performance decrease vectors Dynamic chart shows steep decline impacting business growth and financial performance. Visualizing a sharp downward trend, this graphic powerfully represents financial downturns and declining business performance, ideal for economic analyses and cautionary tales
Free with trial Downward trend graph with data points, sad face icon, and user profile silhouette. Ideal for business, economy, performance, analytics, customer satisfaction, decision-making simple flat metaphor. Performance decrease vectors Declining Business Performance Represented by Graph, Sad Face, and User Profile. Downward trend graph with data points, sad face icon, and user profile silhouette. Ideal for business, economy, performance, analytics, customer satisfaction, decision-making simple flat metaphor
Free with trial 3D Bar Chart Visualizing Business Performance Decline Trends - Business performance decline shown with a 3D bar chart to analyze negative trends. Performance decrease illustrations 3D Bar Chart Visualizing Business Performance Decline Trends
Free with trial A simple yet impactful vector illustration of an orange line graph showing a downward trend, representing a decrease or negative performance. This graphic is perfect for financial dashboards, stock market analysis, business presentations, or statistical reports. It clearly conveys declining metrics and critical data points, vector design Generative AI. Performance decrease vectors Orange Decreasing Line Graph Vector. Financial Market Drop Graphic, vector design Generative AI. A simple yet impactful vector illustration of an orange line graph showing a downward trend, representing a decrease or negative performance. This graphic is perfect for financial dashboards, stock market analysis, business presentations, or statistical reports. It clearly conveys declining metrics and critical data points, vector design Generative AI
Free with trial This image displays a dynamic business analytics dashboard featuring both bar and line graphs. The bar chart illustrates varying percentages (15%, 50%, 75%, 85%), suggesting performance metrics or growth stages. The line chart, with its intersecting blue lines and data points, represents trends, fluctuations, and comparisons over time or across different categories. The clean, modern design makes it ideal for financial reports, business presentations, and data visualization concepts. Performance decrease illustrations Business Growth and Performance Analysis with Bar and Line Charts. This image displays a dynamic business analytics dashboard featuring both bar and line graphs. The bar chart illustrates varying percentages (15%, 50%, 75%, 85%), suggesting performance metrics or growth stages. The line chart, with its intersecting blue lines and data points, represents trends, fluctuations, and comparisons over time or across different categories. The clean, modern design makes it ideal for financial reports, business presentations, and data visualization concepts.
Free with trial Chart with downward trend, sad face indicating negative results, user profile photo with verification checkmark. Ideal for performance, feedback, user analytics, identity, emotions, progress. Performance decrease illustrations Declining Performance Chart with Sad Face and User Profile Verification Concept. Chart with downward trend, sad face indicating negative results, user profile photo with verification checkmark. Ideal for performance, feedback, user analytics, identity, emotions, progress
Free with trial A sharp vector illustration of a red downward-pointing arrow, symbolizing financial decline, losses, or a negative market trend. This impactful graphic is ideal for economic reports, business presentations, or any visual conveying a decrease in value or performance. vector design Generative AI. Performance decrease vectors Red Downward Arrow Financial Decline, vector design Generative AI. A sharp vector illustration of a red downward-pointing arrow, symbolizing financial decline, losses, or a negative market trend. This impactful graphic is ideal for economic reports, business presentations, or any visual conveying a decrease in value or performance. vector design Generative AI
Free with trial A clear flat vector icon representing a bar chart with a downward-pointing red arrow, symbolizing decline, loss, or negative growth. This design is useful for financial reports, risk analysis, or any situation indicating a decrease in performance or value. It communicates challenges, vector design Generative AI. Performance decrease vectors Bar Chart Downtrend Icon, Decline, Loss, Negative Growth, Business, vector design Generative AI. A clear flat vector icon representing a bar chart with a downward-pointing red arrow, symbolizing decline, loss, or negative growth. This design is useful for financial reports, risk analysis, or any situation indicating a decrease in performance or value. It communicates challenges, vector design Generative AI
Free with trial A minimal style of a red down graph of the financial crisis, economic downturn, inflation, recession, failure, bankruptcy, and crisis concept. Businessmen team push a decrease business chart diagram. Performance decrease vectors Businessmen team push a decrease business chart diagram
Free with trial A minimal style of a red down graph of the financial crisis, economic downturn, inflation, recession, failure, bankruptcy, and crisis concept. Businessmen team push a decrease business chart diagram. Performance decrease vectors Businessmen team push a decrease business chart diagram
Free with trial A clear vector illustration of a red downward trending line graph, symbolizing a decrease, decline, or negative performance. This icon is essential for financial reports, business presentations, data visualization, or any context indicating a reduction. Its simple, sharp design effectively communicates a downward trend in various metrics, vector design Generative AI. Performance decrease vectors Red Downward Trending Graph Line Icon, vector design Generative AI. A clear vector illustration of a red downward trending line graph, symbolizing a decrease, decline, or negative performance. This icon is essential for financial reports, business presentations, data visualization, or any context indicating a reduction. Its simple, sharp design effectively communicates a downward trend in various metrics, vector design Generative AI
Free with trial This image features a striking red neon-style line graph on a black background, symbolizing decline, decrease, or downward trend in data visualization. Ideal for business, finance, and analytics concepts, it visually represents performance drops or negative growth in a modern, eye-catching manner. Performance decrease illustrations Red Neon Declining Graph Line Icon for Business Data Visualization. This image features a striking red neon-style line graph on a black background, symbolizing decline, decrease, or downward trend in data visualization. Ideal for business, finance, and analytics concepts, it visually represents performance drops or negative growth in a modern, eye-catching manner.
Free with trial A vibrant glossy red arrow curves downwards, symbolizing a negative trend, decline, or reduction. This eye-catching graphic is perfect for presentations and reports illustrating falling data or negative performance. Performance decrease illustrations Glossy red downward arrow graphic sign indicating trend decline or decrease white background. A vibrant glossy red arrow curves downwards, symbolizing a negative trend, decline, or reduction. This eye-catching graphic is perfect for presentations and reports illustrating falling data or negative performance
Free with trial A minimalist graphic depicting a bar chart with falling bars and a downward-pointing arrow, symbolizing a negative trend, economic downturn, or performance decline. Clean and clear representation of loss. Performance decrease illustrations Simple downward trend bar chart icon indicating decline or decrease. A minimalist graphic depicting a bar chart with falling bars and a downward-pointing arrow, symbolizing a negative trend, economic downturn, or performance decline. Clean and clear representation of loss
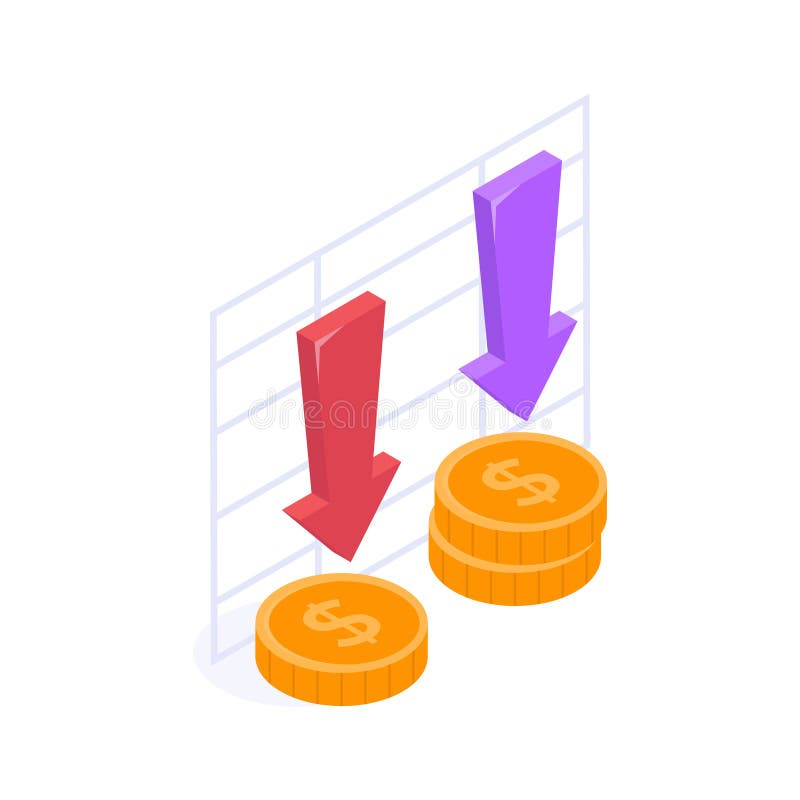
Free with trial Declining Financial Performance Depicted by Falling Arrows and Coins. Performance decrease vectors Declining Financial Performance Depicted by Falling Arrows and Coins
Free with trial A chart showing a decrease with an arrow pointing down, isolated on a white background, representing a decline in data or performance. Performance decrease illustrations Decreasing chart with arrow isolated on white background. A chart showing a decrease with an arrow pointing down, isolated on a white background, representing a decline in data or performance
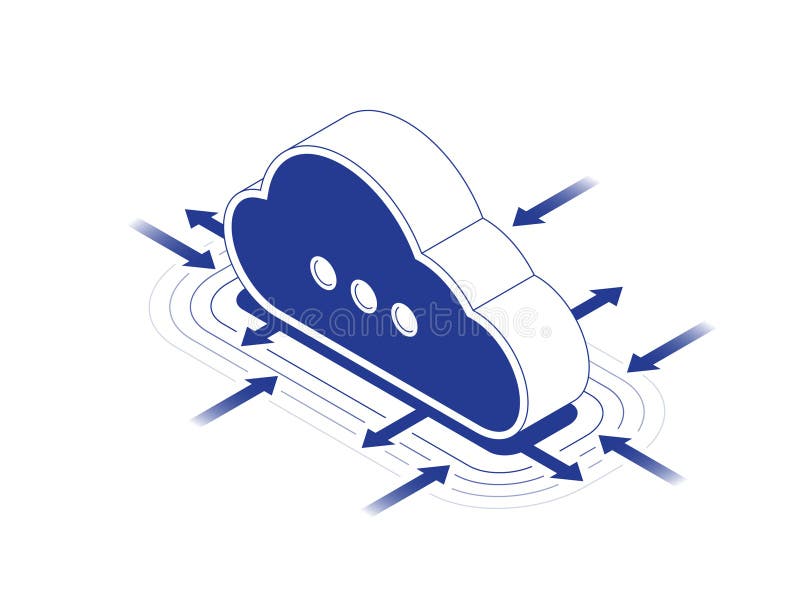
Free with trial Cloud storage scaling concept with dynamic size adjustment arrows showing capacity increase and decrease in isometric line contour vector illustration. Performance decrease vectors Cloud storage scaling concept with dynamic size adjustment arrows showing capacity increase and decrease in isometric
Free with trial Decline bar chart with downward trend arrow outline icon. Decrease, loss, and financial drop symbol vector. Performance decrease vectors Decline bar chart with downward trend arrow outline icon. Decrease, loss, and financial drop symbol
Free with trial Increase decrease editable stroke line icons isolated on white background. Performance decrease vectors Increase decrease editable stroke line icons isolated on white background
Free with trial A black outline graphic of a line trending downwards. This icon represents decline, decrease, negative trends, statistics, analysis, or negative performance in a simple graphic outline style, suitable for financial, business, or statistical visuals. , vector design Generative AI. Performance decrease vectors Outline graphic of a downward sloping line, symbolizing decline trends , vector design Generative AI. A black outline graphic of a line trending downwards. This icon represents decline, decrease, negative trends, statistics, analysis, or negative performance in a simple graphic outline style, suitable for financial, business, or statistical visuals. , vector design Generative AI
Free with trial Business decline bar chart icon with long shadow. Decrease, loss, and financial collapse sign symbol vector. Performance decrease vectors Business decline bar chart icon with long shadow. Decrease, loss, and financial collapse sign symbol
Free with trial Up and down arrows with digital dashboard and analytics graph. Ideal for workflow, analysis, progress monitoring, performance, business strategy, reporting, simple flat metaphor. Performance decrease vectors Data Analysis with Interactive Dashboard, Graphs, and Performance Trends in Business Workflow. Up and down arrows with digital dashboard and analytics graph. Ideal for workflow, analysis, progress monitoring, performance, business strategy, reporting, simple flat metaphor
Free with trial A bold red arrow curves downwards and points to the right, clearly symbolizing a trend of falling prices, negative growth, or a decline in performance. Ideal for financial or business contexts. Performance decrease illustrations Bright red downward arrow symbol indicating decline or decrease on white. A bold red arrow curves downwards and points to the right, clearly symbolizing a trend of falling prices, negative growth, or a decline in performance. Ideal for financial or business contexts
Free with trial Modern rendered line graph with yellow marker points rising and falling vertically, forming a white trend line that fluctuates across the screen. The graph represents business data such as growth, decrease, profit, and market performance. Set against a blurred office background, the image has a clean, digital aesthetic ideal for financial presentations, company reports, startup pitches, and data analysis. This visual is suitable for showcasing trading performance, corporate strategy, and economic trends. Performance decrease illustrations Business Trend Line Graph Showing Growth and Market Fluctuations. Modern rendered line graph with yellow marker points rising and falling vertically, forming a white trend line that fluctuates across the screen. The graph represents business data such as growth, decrease, profit, and market performance. Set against a blurred office background, the image has a clean, digital aesthetic ideal for financial presentations, company reports, startup pitches, and data analysis. This visual is suitable for showcasing trading performance, corporate strategy, and economic trends.
Free with trial A vintage scooter positioned on a declining graph, representing a decrease in activity, challenging market trends, or reduced demand. This reflective illustration is useful for analytical reports, economic discussions, or problem identification. It conveys a sense of decline or performance issues, vector design Generative AI. Performance decrease vectors Scooter on a downward graph, symbolizing decreased activity or challenges, vector design Generative AI. A vintage scooter positioned on a declining graph, representing a decrease in activity, challenging market trends, or reduced demand. This reflective illustration is useful for analytical reports, economic discussions, or problem identification. It conveys a sense of decline or performance issues, vector design Generative AI
Free with trial A vector icon of a line graph showing a downward trend with a red arrow. Represents decline, loss, negative performance, or decreasing statistics. Useful for financial reports, business analytics, or illustrating unfavorable trends. Clear visual for decrease, vector design Generative AI. Performance decrease vectors Downward Trend Line Graph Vector Icon for Decline Loss, vector design Generative AI. A vector icon of a line graph showing a downward trend with a red arrow. Represents decline, loss, negative performance, or decreasing statistics. Useful for financial reports, business analytics, or illustrating unfavorable trends. Clear visual for decrease, vector design Generative AI
Free with trial Business performance decline icon in black circle. Productivity drop and process efficiency loss symbol vector. Performance decrease vectors Business performance decline icon in black circle. Productivity drop and process efficiency loss symbol
Free with trial Calculator with purple screen, upward-trending performance graph, and downward arrow. Ideal for finance, accounting, budgeting, data analysis, cost reduction, investment strategy simple flat. Performance decrease vectors Financial calculation with a calculator, performance graph, and downward arrow for data analysis. Calculator with purple screen, upward-trending performance graph, and downward arrow. Ideal for finance, accounting, budgeting, data analysis, cost reduction, investment strategy simple flat
Free with trial Signed document with a frown face and declining bar chart symbolizing failure, loss, rejection, or performance drop. Ideal for business, finance, loss, analysis, feedback strategy simple landing. Performance decrease vectors Document with Signature, Sad Face, and Bar Graph Highlighting Decline in Performance or Approval. Signed document with a frown face and declining bar chart symbolizing failure, loss, rejection, or performance drop. Ideal for business, finance, loss, analysis, feedback strategy simple landing
Free with trial Decline bar chart with downward trend arrow icon vector. Decrease, loss, and financial drop symbol on circle line. Performance decrease vectors Decline bar chart with downward trend arrow icon. Decrease, loss, and financial drop symbol on circle line
Free with trial Statistic graph progress, financial profit growth, increase and decrease line icons set. Infographic charts with arrow, circles and bars thin black and red outline symbols vector illustration. Performance decrease vectors Statistic graph progress, financial profit growth, increase and decrease line icons set
Free with trial A vector icon illustrating a downward trending line graph, symbolizing a decline, decrease, or negative performance. Ideal for financial reports, data analysis dashboards, or warning indicators. This clear and concise graphic is scalable, perfect for conveying trend information in various digital interfaces, vector design Generative AI. Performance decrease vectors Declining Trend Graph Icon - Downturn Analysis Symbol, vector design Generative AI. A vector icon illustrating a downward trending line graph, symbolizing a decline, decrease, or negative performance. Ideal for financial reports, data analysis dashboards, or warning indicators. This clear and concise graphic is scalable, perfect for conveying trend information in various digital interfaces, vector design Generative AI
Free with trial Wooden block with a downward arrow symbol, representing a decline or decrease, sits on a rustic wooden surface. Performance decrease illustrations Wooden block with an arrow symbol pointing down represents a decrease or decline. wooden block with a downward arrow symbol, representing a decline or decrease, sits on a rustic wooden surface.
Free with trial Decline bar chart with downward trend arrow icon vector. Decrease, loss, and financial crisis symbol in black circle. Performance decrease vectors Decline bar chart with downward trend arrow icon. Decrease, loss, and financial crisis symbol in black circle
Free with trial Downward arrow with decreasing bar graph alongside neutral, happy, and sad emotion faces. Ideal for emotional feedback, metrics, performance, business evaluation, impact loss failure. A simple flat. Performance decrease vectors Decline in Performance Represented by Downward Arrow, Graph Bars, and Varying Emotional Expressions. Downward arrow with decreasing bar graph alongside neutral, happy, and sad emotion faces. Ideal for emotional feedback, metrics, performance, business evaluation, impact loss failure. A simple flat
Free with trial Chart with a downward trend line and data points, a sad face emotion, and a pointing hand. Ideal for performance analysis, failure, problem-solving, disappointment, caution, decision-making simple. Performance decrease vectors Hand pointing at declining data chart with a sad face icon highlighting negative performance trend. Chart with a downward trend line and data points, a sad face emotion, and a pointing hand. Ideal for performance analysis, failure, problem-solving, disappointment, caution, decision-making simple
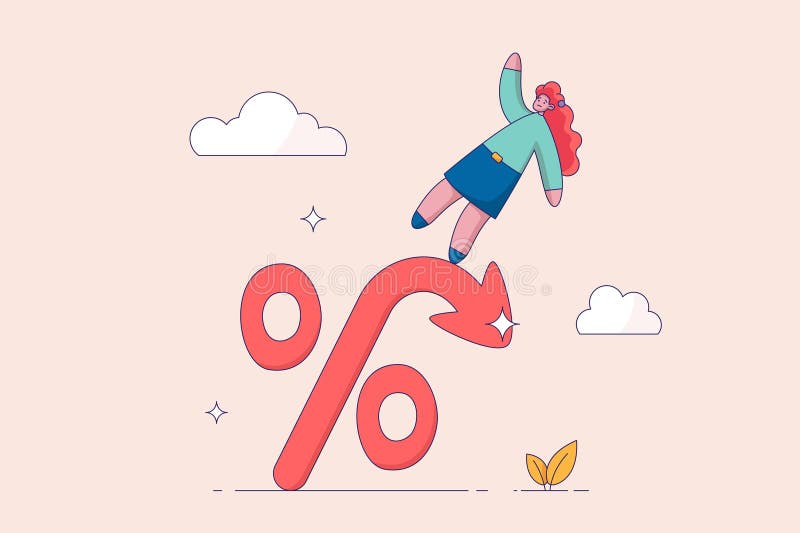
Free with trial Inflation. Interest rate falling down, decrease or reduction, profit fall in economic recession, stock market value loss, FED reduce interest rate, businesswoman on percentage sign with falling down. Performance decrease vectors Inflation. Interest rate falling down, decrease or reduction, profit fall in economic recession, stock market value loss
Free with trial An isolated red downward arrow dramatically crashes through, conveying a sense of loss or decline in performance metrics. This represents bearish market behavior or negative trends. Performance decrease illustrations A red downward arrow symbolizes a significant decline in market trends or performance. An isolated red downward arrow dramatically crashes through, conveying a sense of loss or decline in performance metrics. This represents bearish market behavior or negative trends.
Free with trial Visualize decreasing business performance with this striking image. A pink 3D bar chart graphically represents a decline in financial data, highlighting loss and reduction. The falling graph is juxtaposed with a healthy green plant in a pot, emphasizing the contrast between success and setbacks. Ideal for illustrating economic concepts, investment challenges, or business performance issues, Created AI. Performance decrease illustrations Decreasing business performance represented by pink graphic and potted green plant. Visualize decreasing business performance with this striking image. A pink 3D bar chart graphically represents a decline in financial data, highlighting loss and reduction. The falling graph is juxtaposed with a healthy green plant in a pot, emphasizing the contrast between success and setbacks. Ideal for illustrating economic concepts, investment challenges, or business performance issues, Created AI
Free with trial Downward trend bar chart with arrow showing financial economic decline loss decrease. Performance decrease vectors Downward trend bar chart with arrow showing financial economic decline loss decrease
Free with trial This compelling visual representation showcases a clear negative trend. A vibrant red downward arrow icon serves as a potent indicator of decline, positioned prominently against a pristine white background. The simple, yet impactful, chart surrounding the arrow depicts a consistently sloping downward line, visually reinforcing the concept of a fall or decrease in value. This graphic serves as a. Performance decrease illustrations Visualizing Declining Trends A Downward Arrow Chart Illustrates Negative Performance. This compelling visual representation showcases a clear negative trend. A vibrant red downward arrow icon serves as a potent indicator of decline, positioned prominently against a pristine white background. The simple, yet impactful, chart surrounding the arrow depicts a consistently sloping downward line, visually reinforcing the concept of a fall or decrease in value. This graphic serves as a
Free with trial Red bar chart displays performance metrics on a table ,Generative ai. Performance decrease illustrations Red bar chart illustrating performance metrics on a table, data analysis and visualization. Red bar chart displays performance metrics on a table ,Generative ai
Free with trial Growth decline graphs, market trends. Business performance symbols. Vector illustration. EPS 10. Stock image. Performance decrease vectors Growth decline graphs, market trends. Business performance symbols. Vector illustration. EPS 10.
Free with trial Business growth and decline icon set. Up and down trend chart symbol illustration. Increase and decrease bar graph concept. Performance decrease vectors Business growth and decline icon set. Up and down trend chart symbol. Increase and decrease bar graph concept
Free with trial A vibrant red arrow points downward against a minimalistic, clean solid background, effectively conveying a message of decline or drop in values, trends, or performance metrics. Performance decrease illustrations Bright red downward arrow on a smooth, clean, solid background indicating a decline or decrease. A vibrant red arrow points downward against a minimalistic, clean solid background, effectively conveying a message of decline or drop in values, trends, or performance metrics.
Free with trial A bold red arrow points downward, symbolizing a negative trend or decline, often associated with financial or performance metrics. This visual representation is commonly used in reports. Performance decrease vectors Red downward arrow indicating decline in trends or performance metrics across data visuals. A bold red arrow points downward, symbolizing a negative trend or decline, often associated with financial or performance metrics. This visual representation is commonly used in reports.
Free with trial A character is grasping a big red arrow that points downward, symbolizing decline or decrease against a plain white backdrop. Performance decrease illustrations Character Holding a Large Red Downward Arrow on a White Background Indicating Decline or Decrease. A character is grasping a big red arrow that points downward, symbolizing decline or decrease against a plain white backdrop
Free with trial A close-up, angled view of a digital stock market ticker board. The screen displays rows of numbers in vibrant red and green LED lights against a dark background. Red numbers typically indicate a price decrease or negative performance, while green signifies an increase or positive performance. The display shows various financial data, including stock prices, trading volumes, and potentially chart lines, creating a dynamic and abstract representation of financial markets and trading. Performance decrease illustrations Stock Market Ticker Display with Red and Green Numbers. A close-up, angled view of a digital stock market ticker board. The screen displays rows of numbers in vibrant red and green LED lights against a dark background. Red numbers typically indicate a price decrease or negative performance, while green signifies an increase or positive performance. The display shows various financial data, including stock prices, trading volumes, and potentially chart lines, creating a dynamic and abstract representation of financial markets and trading.
Free with trial Stock market chart analysis displayed on computer screen showing growth and performance ,Generative ai. Performance decrease illustrations Stock market analysis chart displayed on computer screen showing growth and investment performance. Stock market chart analysis displayed on computer screen showing growth and performance ,Generative ai
Free with trial Inflation or interest rate falling down, decrease or reduction, profit fall in economic recession, stock market value loss, FED reduce interest rate, businessman on percentage sign with falling down. Performance decrease vectors Inflation or interest rate falling down, decrease or reduction, profit fall in economic recession, stock market value loss, FED
Free with trial Inflation or interest rate falling down, decrease or reduction, profit fall in economic recession, stock market value loss, FED reduce interest rate, businessman on percentage sign with falling down. Performance decrease vectors Inflation or interest rate falling down, decrease or reduction, profit fall in economic recession, stock market value loss, FED
Free with trial Business Analytics And Data Visualization Line Icon Set. Financial Growth, Market Trends, And Performance Analysis Outline Symbol Collection. Editable Stroke. Isolated Vector Illustration. Performance decrease vectors Business Analytics And Data Visualization Line Icon Set. Financial Growth, Market Trends, And Performance Analysis
Free with trial The image depicts a business professional in a suit interacting with a transparent digital chart displaying a declining trend in business performance. The visualization includes green bar charts and a line graph, complemented by a prominent downward arrow and percentage symbol indicating a decrease. This modern digital interface symbolizes data-driven decision-making, financial analysis, and real-time monitoring of business metrics for strategic planning. Performance decrease illustrations Business Performance Decline Visualization with Interactive Data Analytics and Percentage Drop Indicator. The image depicts a business professional in a suit interacting with a transparent digital chart displaying a declining trend in business performance. The visualization includes green bar charts and a line graph, complemented by a prominent downward arrow and percentage symbol indicating a decrease. This modern digital interface symbolizes data-driven decision-making, financial analysis, and real-time monitoring of business metrics for strategic planning.
Free with trial This dynamic 3D visualization showcases a dramatic downward trend, depicted by numerous red arrows pointing downwards. The graphic effectively illustrates a decline in various economic indicators, such as stock market performance, negative growth, and business loss. The intense red color strongly emphasizes the negative impact, suggesting a potential stock market crash, a significant economic. Performance decrease illustrations 3D Rendered Red Arrow Graph Visualizing a Downward Trend in Financial Markets and Business Performance. This dynamic 3D visualization showcases a dramatic downward trend, depicted by numerous red arrows pointing downwards. The graphic effectively illustrates a decline in various economic indicators, such as stock market performance, negative growth, and business loss. The intense red color strongly emphasizes the negative impact, suggesting a potential stock market crash, a significant economic
Free with trial This sales graph clearly illustrates a concerning downward trend. The visualization displays a significant decline in sales figures over a specified period, potentially indicating a market downturn or other factors impacting business performance. Careful analysis of this data is crucial for understanding the underlying causes. Are sales decreasing across all product lines or specific segments. Performance decrease illustrations Analyzing Declining Sales Trends A Deep Dive into Market Performance and Potential Recovery Strategies. This sales graph clearly illustrates a concerning downward trend. The visualization displays a significant decline in sales figures over a specified period, potentially indicating a market downturn or other factors impacting business performance. Careful analysis of this data is crucial for understanding the underlying causes. Are sales decreasing across all product lines or specific segments
Free with trial Bar Chart Growth And Decline Line And Solid Icon Set. Financial Performance, Economic Trends, Business Analysis Symbol Collection. Data Visualization And Market Trends. Isolated Vector Illustration. Performance decrease vectors Bar Chart Growth And Decline Line And Solid Icon Set. Financial Performance, Economic Trends, Business Analysis Symbol
Free with trial Business growth and decline icon in circular outline. Up and down trend chart symbol illustration. Increase and decrease bar graph concept. Performance decrease vectors Business growth and decline icon in circular outline. Up and down trend chart symbol. Increase and decrease bar graph concept
Free with trial Bar Chart With Arrows Line And Solid Icon Set. Data Analysis, Trend Indication, Business Performance Tracking Symbols. Visual Representation Of Growth And Decline. Isolated Vector Illustration. Performance decrease vectors Bar Chart With Arrows Line And Solid Icon Set. Data Analysis, Trend Indication, Business Performance Tracking Symbols
Free with trial A hand with a pen analyzes financial charts on a digital screen, highlighting investment trends, market analysis, and economic growth using visual representation of performance. Performance decrease illustrations Analyzing financial data with pen on digital screen, showing investment trends and growth. Chart displays performance. A hand with a pen analyzes financial charts on a digital screen, highlighting investment trends, market analysis, and economic growth using visual representation of performance
Free with trial Colorful data visualization with various charts and graphs. Visual representation of growth and performance metrics, breathtaking wallpaper background Generative AI. Performance decrease illustrations Colorful data visualization with various charts and graphs. Visual representation of growth and performance metrics
Free with trial This compelling stock image showcases a stark red arrow pointing downwards, a powerful visual representation of decline. The minimalist design focuses solely on the downward trend, making the message of negative movement immediately apparent. Perfect for conveying a range of concepts, from a downturn in business performance to a falling market share or a project that's fallen behind schedule. Performance decrease illustrations Visualizing Declining Trends A Minimalist Stock Photo of a Dramatic Red Arrow Down Illustrating Business Performance. This compelling stock image showcases a stark red arrow pointing downwards, a powerful visual representation of decline. The minimalist design focuses solely on the downward trend, making the message of negative movement immediately apparent. Perfect for conveying a range of concepts, from a downturn in business performance to a falling market share or a project that's fallen behind schedule.
Free with trial Line Graph Chart Icon. Data Analysis, Business Growth, And Statistical Trends Outline Symbol. Financial Performance Tracking. Editable Stroke. Isolated Vector Illustration. Performance decrease vectors Line Graph Chart Icon. Data Analysis, Business Growth, And Statistical Trends Outline Symbol. Financial Performance
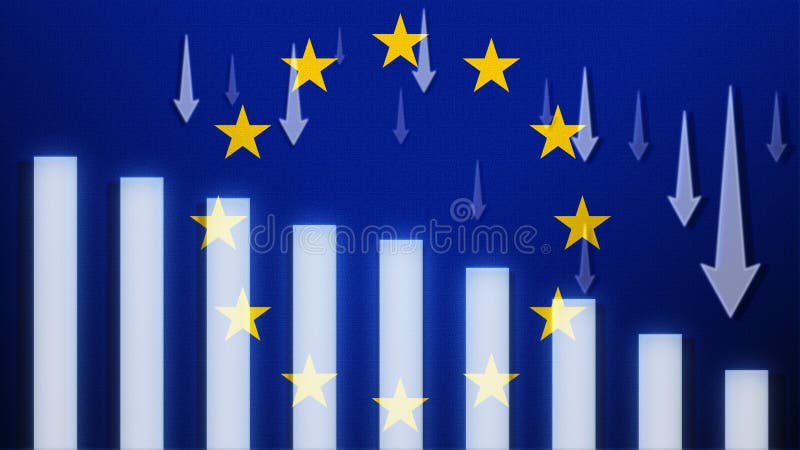
Free with trial EU flag with a declining bar chart and down arrows, symbolizing decline in data, performance, or various indicators. Performance decrease illustrations Flag with a declining bar chart and down arrows, symbolizing decline in data, performance, or various indicators in the country. EU flag with a declining bar chart and down arrows, symbolizing decline in data, performance, or various indicators
Free with trial A business professional is seen working with a laptop and analyzing data charts to optimize performance The image showcases the concepts of quality improvement cost reduction strategic planning and target achievement highlighting the importance of data analysis and technology in modern business. Performance decrease illustrations Business professional optimizes performance with technology achieving quality improvement and cost reduction with data analysis. A business professional is seen working with a laptop and analyzing data charts to optimize performance The image showcases the concepts of quality improvement cost reduction strategic planning and target achievement highlighting the importance of data analysis and technology in modern business
Free with trial Muscle Fatigue - decrease in maximal force or power production in response to contractile activity, text concept background. Performance decrease illustrations Muscle Fatigue - decrease in maximal force or power production in response to contractile activity, text concept background
Free with trial A percentage graph visually represents statistical data, showcasing trends, growth, and performance metrics for analysis and decision-making processes. Performance decrease vectors Vector art of a percentage graph illustrates statistical data, representing growth, progress, and performance analysis in a visual. A percentage graph visually represents statistical data, showcasing trends, growth, and performance metrics for analysis and decision-making processes
Free with trial Flag with a declining bar chart and down arrows, symbolizing decline in data, performance, or various national indicators in the. Performance decrease illustrations Flag with a declining bar chart and down arrows, symbolizing decline in data, performance, or various national indicators in the
Free with trial Gambia flag with a declining bar chart and down arrows, symbolizing decline in data, performance, or various national indicators. Performance decrease illustrations Flag with a declining bar chart and down arrows, symbolizing decline in data, performance, or various national indicators in the
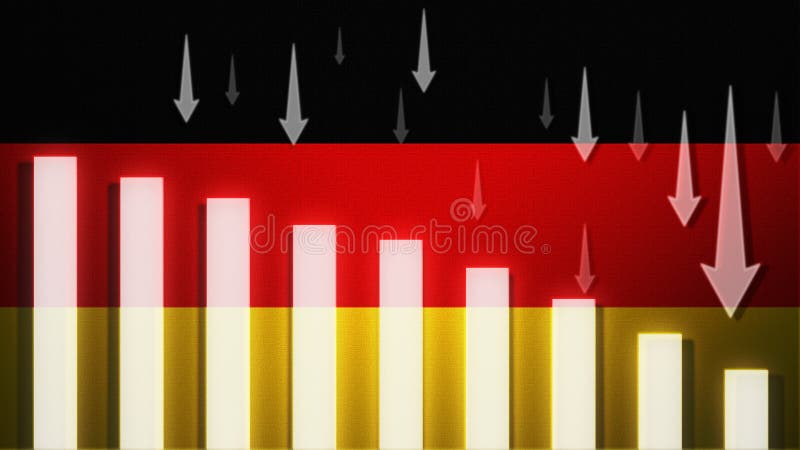
Free with trial Germany flag with a declining bar chart and down arrows, symbolizing decline in data, performance, or various national indicators. Performance decrease illustrations Flag with a declining bar chart and down arrows, symbolizing decline in data, performance, or various national indicators in the