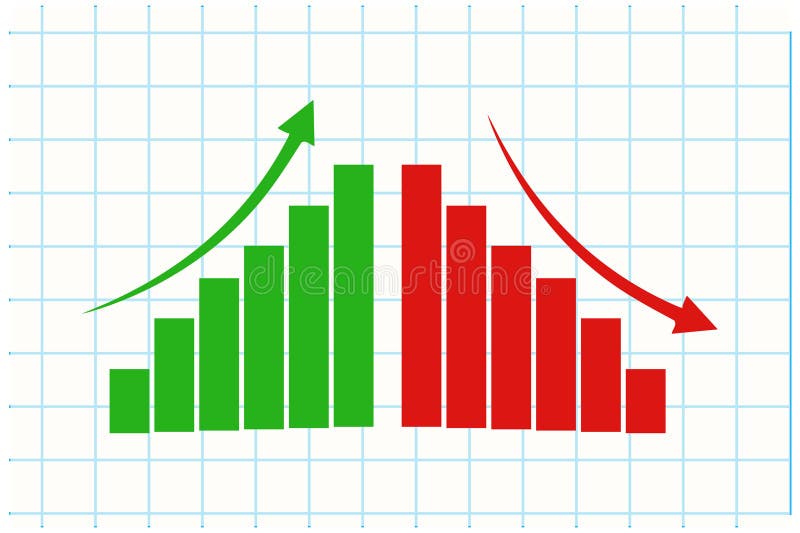
Free with trial Stock and economic crisis graph background. Trade exchange, financial decrease, bed business strategy, digital asset, loss investment fund, online broker, stock collapse and crisis concept. Progress decrease illustrations Stock and economic crisis graph background. Trade exchange, financial decrease
Free with trial A hand holds a glowing digital display showing a percentage increase in quality and a percentage decrease in cost symbolizing business success and efficiency. Progress decrease illustrations Business growth conceptual hand displaying quality percentage increase and cost percentage decrease. A hand holds a glowing digital display showing a percentage increase in quality and a percentage decrease in cost symbolizing business success and efficiency
Free with trial Laptop financial loss. Screen dollar decrease. Business decline graph. Vector economy illustration. EPS 10. Progress decrease vectors Laptop financial loss. Screen dollar decrease. Business decline graph. Vector economy illustration.
Free with trial Dynamic CO2 reduction icon symbolizes environmental sustainability and carbon footprint decrease for eco-conscious solutions. Progress decrease illustrations Dynamic CO2 reduction icon symbolizes environmental sustainability and carbon footprint decrease for eco-conscious solutions
Free with trial Decrease : Decrease represents a reduction in value, profit, or financial performance over a specific period. Progress decrease vectors Illustration of Decrease. Decrease : Decrease represents a reduction in value, profit, or financial performance over a specific period.
Free with trial The image displays an abstract logo combining a stylized green leaf with four horizontal bars that decrease in length and shade from dark to light green. This design effectively symbolizes concepts of sustainability progress and ecological data visualization. Rendered by Ai, the clean vector graphic is ideal for environmental consulting growth tracking or organic brand identity. It conveys both. Progress decrease illustrations Abstract green leaf data progress bar symbol. The image displays an abstract logo combining a stylized green leaf with four horizontal bars that decrease in length and shade from dark to light green. This design effectively symbolizes concepts of sustainability progress and ecological data visualization. Rendered by Ai, the clean vector graphic is ideal for environmental consulting growth tracking or organic brand identity. It conveys both
Free with trial Decrease: Decrease represents a reduction in value, amount, or performance over time. Progress decrease illustrations Illustration of Decrease. Decrease: Decrease represents a reduction in value, amount, or performance over time.
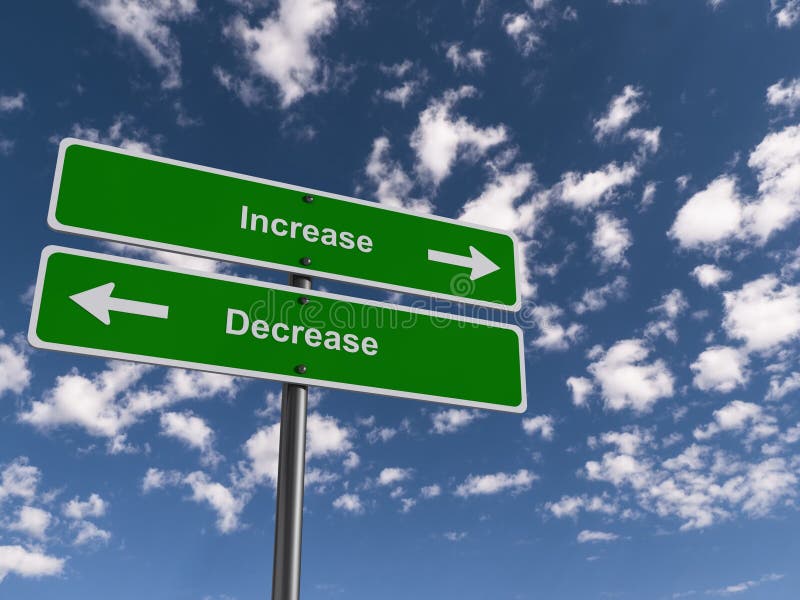
Free with trial Increase decrease traffic sign on blue sky background. Progress decrease illustrations Increase decrease traffic sign on blue sky
Free with trial A modern flat design graphic set featuring two icons: opposing arrows indicating increase decrease and a bar chart showing financial growth or decline, perfect for business concepts. Progress decrease vectors Increase and decrease arrows with bar chart icon. A modern flat design graphic set featuring two icons: opposing arrows indicating increase decrease and a bar chart showing financial growth or decline, perfect for business concepts
Free with trial Simple black and white vector illustration showing bar charts indicating increase and decrease, perfect for financial or data concepts. Progress decrease vectors Bar chart icon showing increase and decrease data. Simple black and white vector illustration showing bar charts indicating increase and decrease, perfect for financial or data concepts
Free with trial Bar chart showing stock market increase and decrease. Progress decrease vectors Bar chart showing stock market increase and decrease.
Free with trial Decrease bar chart icon on circle line. Statistic sign symbol illustration. Progress decrease vectors Decrease bar chart icon on circle line. Statistic sign symbol
Free with trial A simple flat design graphic features a red arrow pointing down and a green arrow pointing up, symbolizing increase and decrease. Ideal for business and finance concepts. Progress decrease vectors Directional arrows indicating increase and decrease. A simple flat design graphic features a red arrow pointing down and a green arrow pointing up, symbolizing increase and decrease. Ideal for business and finance concepts
Free with trial Two opposing arrows, a clock, and a growth chart with an upward trend. Ideal for business, productivity, time management, performance, progress efficiency and decision-making. A simple flat. Progress decrease illustrations Upward and Downward Arrows with Clock and Growth Chart Representing Time and Progress. Two opposing arrows, a clock, and a growth chart with an upward trend. Ideal for business, productivity, time management, performance, progress efficiency and decision-making. A simple flat
Free with trial This graphic displays two circular icons, one depicting a downward-pointing arrow with a dollar sign, symbolizing a decrease in value, and the other an upward arrow with a dollar sign, representing an increase. Progress decrease vectors Cost decrease or increase icon. Downward vs upward dollar signs. This graphic displays two circular icons, one depicting a downward-pointing arrow with a dollar sign, symbolizing a decrease in value, and the other an upward arrow with a dollar sign, representing an increase.
Free with trial Decrease and increase chart icon with arrow. Negative and positive trend symbol illustration. Progress decrease vectors Decrease and increase chart icon with arrow. Negative and positive trend symbol
Free with trial The graph displays two lines, one green and one red. The green line is ascending, indicating growth or progress, while the red line is descending, suggesting a decline or decrease. Progress decrease illustrations A graph with a green line and a red line. The graph displays two lines, one green and one red. The green line is ascending, indicating growth or progress, while the red line is descending, suggesting a decline or decrease
Free with trial Intersecting colorful lines trending up and down across a graph illustrate weekly progress from monday to sunday, capturing fluctuations in performance over time. Progress decrease vectors Intersecting colorful lines trending up and down across a graph illustrate weekly progress from monday to sunday
Free with trial Set line Mind map infographic, Financial growth decrease and icon. Vector. Progress decrease illustrations Set line Mind map infographic, Financial growth decrease and icon. Vector
Free with trial Business finance and growth icons illustrating statistics charts trends progress and success. Progress decrease vectors Finance and growth icons showing progress and business performance blue navy. Business finance and growth icons illustrating statistics charts trends progress and success
Free with trial Building wooden bar graph with hand, representing growth and progress -. Progress decrease illustrations Building wooden bar graph with hand, representing growth and progress
Free with trial Dynamic blue arrow signifies downward motion and speed, representing decline, download, or business progress. Bold design for concepts of change and data. Progress decrease vectors Dynamic blue downward arrow with speed streaks, business progress. Dynamic blue arrow signifies downward motion and speed, representing decline, download, or business progress. Bold design for concepts of change and data
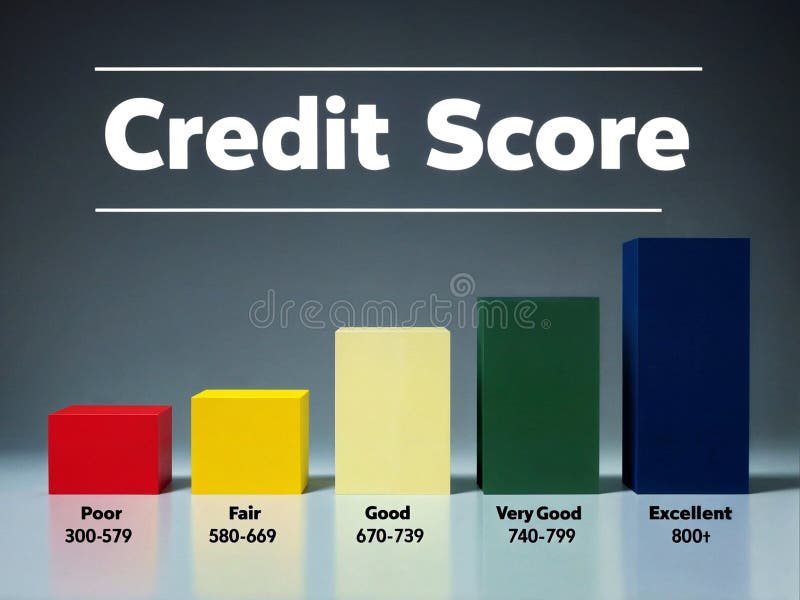
Free with trial 3d render illustration of increasing progress bar of indicating poor, fair, good, very good and excellent level of creditworthiness. Progress decrease illustrations 3d illustration render progress bars indicating credit score level. 3d render illustration of increasing progress bar of indicating poor, fair, good, very good and excellent level of creditworthiness
Free with trial An illustrative bar graph on a dark purple background depicts a clear downward trend using yellow bars and a prominent descending arrow. The text "Debt Reduction" is displayed below the chart. This visual metaphor effectively represents the successful management and decrease of financial obligations, highlighting progress in financial health. It is ideal for use in financial planning, economic reports, personal finance articles, business presentations, or any content related to improving financial stability and reducing liabilities. The clean, flat design makes it versatile for various digital and print media. Progress decrease vectors Debt Reduction Bar Graph with Downward Trend. An illustrative bar graph on a dark purple background depicts a clear downward trend using yellow bars and a prominent descending arrow. The text "Debt Reduction" is displayed below the chart. This visual metaphor effectively represents the successful management and decrease of financial obligations, highlighting progress in financial health. It is ideal for use in financial planning, economic reports, personal finance articles, business presentations, or any content related to improving financial stability and reducing liabilities. The clean, flat design makes it versatile for various digital and print media.
Free with trial A single, large, shiny green arrow curves downwards on a white background. The arrow has a smooth, glossy surface that reflects light, giving it a three-dimensional appearance. The arrowhead points directly downwards, indicating a direction of descent or decrease. The vibrant green color and polished finish make the arrow stand out prominently. Progress decrease illustrations Shiny Green Downward Curved Arrow on a White Background direction decrease. A single, large, shiny green arrow curves downwards on a white background. The arrow has a smooth, glossy surface that reflects light, giving it a three-dimensional appearance. The arrowhead points directly downwards, indicating a direction of descent or decrease. The vibrant green color and polished finish make the arrow stand out prominently
Free with trial Percentage arrow. rate increase and decrease concept. Progress decrease vectors Percentage arrow. rate increase and decrease concept.
Free with trial Isometric gear wheel with a downward pointing arrow and falling droplets symbolizes a system or process of reduction, decrease, or falling metrics within a mechanical or digital context. Progress decrease vectors Gear mechanism indicating metric data decrease process. Isometric gear wheel with a downward pointing arrow and falling droplets symbolizes a system or process of reduction, decrease, or falling metrics within a mechanical or digital context
Free with trial Pop art Financial growth decrease icon isolated on color background. Increasing revenue. Vector. Progress decrease vectors Pop art Financial growth decrease icon isolated on color background. Increasing revenue. Vector
Free with trial Two bold, three-dimensional red arrows are positioned vertically side-by-side against a clean white background. The left arrow points upwards, signifying increase, progress, or ascent. The right arrow points downwards, representing decrease, decline, or descent. Their contrasting directions and vibrant color make them a strong visual metaphor for opposing forces, change, or directional choices. Progress decrease illustrations Red Up and Down Arrows Symbolizing Direction and Contrast on White Background image photo. Two bold, three-dimensional red arrows are positioned vertically side-by-side against a clean white background. The left arrow points upwards, signifying increase, progress, or ascent. The right arrow points downwards, representing decrease, decline, or descent. Their contrasting directions and vibrant color make them a strong visual metaphor for opposing forces, change, or directional choices
Free with trial A pair of three-dimensional arrows, rendered in shades of gray, are presented against a white background. One arrow points upwards, signifying growth or progress, while the other points downwards, indicating decline or a decrease. The arrows are constructed from layered chevron shapes, creating a textured and modern appearance. Progress decrease illustrations 3D rendering of an upward and downward pointing chevron arrow pair on a white background. A pair of three-dimensional arrows, rendered in shades of gray, are presented against a white background. One arrow points upwards, signifying growth or progress, while the other points downwards, indicating decline or a decrease. The arrows are constructed from layered chevron shapes, creating a textured and modern appearance
Free with trial Business growth and decline icon in black circle. Up and down trend chart symbol illustration. Increase and decrease bar graph concept. Progress decrease vectors Business growth and decline icon in black circle. Up and down trend chart symbol. Increase and decrease bar graph concept
Free with trial Set line Pie chart infographic, Financial growth increase, decrease and Old hourglass with sand icon. Vector. Progress decrease vectors Set line Pie chart infographic, Financial growth increase, decrease and Old hourglass with sand icon. Vector
Free with trial Green Financial growth decrease icon isolated on black background. Increasing revenue. Black square button. Vector. Progress decrease vectors Green Financial growth decrease icon isolated on black background. Increasing revenue. Black square button. Vector
Free with trial Pink Financial growth decrease icon isolated on pink background. Increasing revenue. Minimalism concept. 3D render illustration. Progress decrease illustrations Pink Financial growth decrease icon isolated on pink background. Increasing revenue. Minimalism concept. 3D render
Free with trial This image depicts a visual representation of financial or business growth and decline using a series of ascending and descending three-dimensional bar charts, where the left side shows smaller bars gradually increasing in height, transitioning through a central flat bar, and shifting to taller bars on the right side that progressively decrease, all set against a plain white background to. Progress decrease illustrations Growth and progress concept with ascending and descending bar charts illustrating business success and financial improvement over. This image depicts a visual representation of financial or business growth and decline using a series of ascending and descending three-dimensional bar charts, where the left side shows smaller bars gradually increasing in height, transitioning through a central flat bar, and shifting to taller bars on the right side that progressively decrease, all set against a plain white background to
Free with trial Percent Arrow Icons Set: Growth, Increase, Decrease Filled Up and Down Arrows. Progress decrease vectors Percent Arrow Icons Set: Growth, Increase, Decrease Filled Up and Down Arrows
Free with trial Graph with decrease report. Business and finance vector illustration. Diagram with recession and bankruptcy progress. Progress decrease vectors Graph with decrease report. Business and finance vector illustration. Diagram with recession and bankruptcy
Free with trial Battery status set. Power level icon. Energy progress Vector. Outline charge symbol. Manual vector only. No autotrace used. EPS 10. Progress decrease vectors Battery status set. Power level icon. Energy progress Vector. Outline charge symbol. Manual vector only. No autotrace used
Free with trial Grey Financial growth decrease icon isolated on purple-blue background. Increasing revenue. Minimalism concept. 3D render illustration. Progress decrease illustrations Grey Financial growth decrease icon isolated on purple-blue background. Increasing revenue. Minimalism concept. 3D
Free with trial Purple-blue Financial growth decrease icon isolated on grey background. Increasing revenue. Minimalism concept. 3D render illustration. Progress decrease illustrations Purple-blue Financial growth decrease icon isolated on grey background. Increasing revenue. Minimalism concept. 3D
Free with trial Logotype line Financial growth decrease icon isolated on grey background. Increasing revenue. Logo design template element. Vector. Progress decrease illustrations Logotype line Financial growth decrease icon isolated on grey background. Increasing revenue. Logo design template
Free with trial White Financial growth decrease icon isolated with long shadow background. Increasing revenue. Circle button. Vector. Progress decrease vectors White Financial growth decrease icon isolated with long shadow background. Increasing revenue. Circle button. Vector.
Free with trial Line Financial growth decrease icon isolated on white background. Increasing revenue. Colorful outline concept. Vector. Progress decrease illustrations Line Financial growth decrease icon isolated on white background. Increasing revenue. Colorful outline concept. Vector
Free with trial A simple yet effective downward sloping arrow indicating a declining trend or negative progress. This infographic element is ideal for business reports, financial charts, educational materials, or presentations needing to visualize a decrease in value or performance over time. vector design Generative AI. Progress decrease vectors Downward Sloping Graph Arrow for Declining Trends, vector design Generative AI. A simple yet effective downward sloping arrow indicating a declining trend or negative progress. This infographic element is ideal for business reports, financial charts, educational materials, or presentations needing to visualize a decrease in value or performance over time. vector design Generative AI
Free with trial Isometric line Financial growth decrease icon isolated on pink and blue background. Increasing revenue. Square button. Vector. Progress decrease vectors Isometric line Financial growth decrease icon isolated on pink and blue background. Increasing revenue. Square button
Free with trial Line Financial growth decrease icon isolated on black background. Increasing revenue. Colorful outline concept. Vector. Progress decrease illustrations Line Financial growth decrease icon isolated on black background. Increasing revenue. Colorful outline concept. Vector
Free with trial Two distinct 3D arrows are presented against a white background. One arrow points directly upwards, while the other points directly downwards, symbolizing opposing directions or concepts such as progress and decline, or growth and decrease. Both arrows feature a layered, chevron-like design, giving them a modern and geometric appearance. Progress decrease illustrations Two 3D Arrows, One Pointing Up and One Pointing Down, with Layered Design on White Background. Two distinct 3D arrows are presented against a white background. One arrow points directly upwards, while the other points directly downwards, symbolizing opposing directions or concepts such as progress and decline, or growth and decrease. Both arrows feature a layered, chevron-like design, giving them a modern and geometric appearance
Free with trial Reduce risk level concept or decrease stress anxiety meter. Effort and drive as a person pushes a big gauge toward green, symbolizing reduce risk or stress level. Progress decrease vectors Reduce risk level concept or decrease stress anxiety meter
Free with trial A bold red arrow pointing downwards along a slope, indicating a negative trend, decrease, or decline. This clear visual indicator is perfect for financial reports, data visualizations, educational presentations, or any graphic where a reduction in value or progress needs to be highlighted. vector design Generative AI. Progress decrease vectors Red Downward Slope Arrow for Negative Trend Indicator, vector design Generative AI. A bold red arrow pointing downwards along a slope, indicating a negative trend, decrease, or decline. This clear visual indicator is perfect for financial reports, data visualizations, educational presentations, or any graphic where a reduction in value or progress needs to be highlighted. vector design Generative AI
Free with trial Data Stats Board Display Icon Downward Down Trend Statistic Performance Market Decline Economy Downturn Bar Graph Progress Sign Symbol Presentation. Progress decrease vectors Data Stats Board Display Icon Downward Down Trend Statistic Performance Market Decline Economy Downturn Bar Graph Progress
Free with trial Profit icon. Coin growth vector illustration. Investment increase and decrease infographic. Statistic arrow symbol. Financial chart sign. Stock graph pictogram isolated. Progress decrease vectors Profit icon. Coin growth vector illustration. Investment increase and decrease infographic. Statistic arrow symbol. Financial
Free with trial A vibrant green arrow points upwards indicating progress or increase, while a glossy red arrow points downwards symbolizing decline or decrease, representing directional changes. Progress decrease illustrations Green up arrow and red down arrow icons symbolizing directional movement and change white background. A vibrant green arrow points upwards indicating progress or increase, while a glossy red arrow points downwards symbolizing decline or decrease, representing directional changes
Free with trial Four vibrant lines undulating on a dark dashboard, illustrating progress over time while emphasizing key data points with distinct circles for enhanced clarity and analysis. Progress decrease vectors Four vibrant lines undulating on a dark dashboard, illustrating progress over time while emphasizing key data points
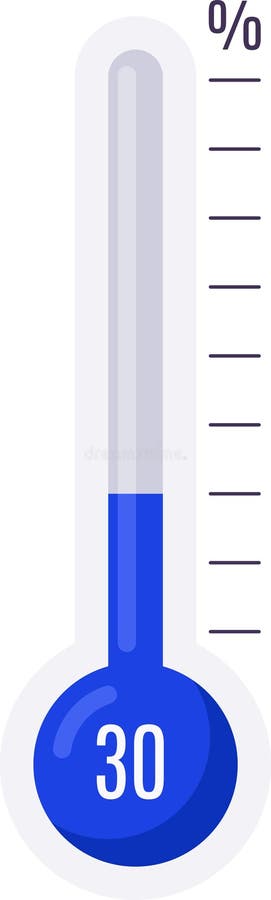
Free with trial Thermometer indicating 30 percent, symbolizing progress, achievement, temperature measurement, or goal completion within a specific range. Progress decrease vectors Thermometer indicating 30 percent, symbolizing progress, achievement, temperature measurement, or goal completion within
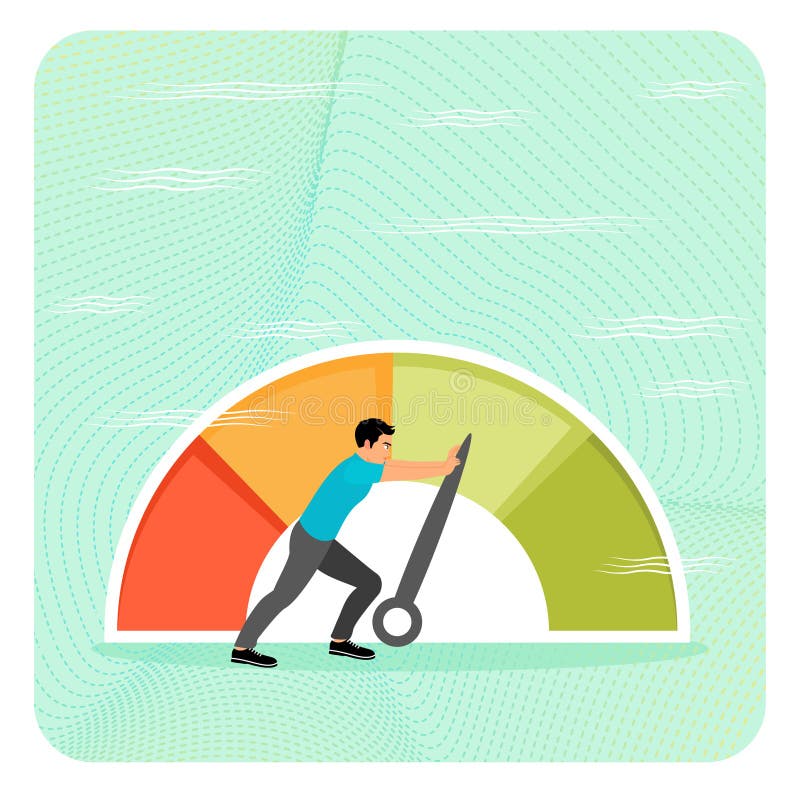
Free with trial Reduce risk level or decrease stress anxiety meter concept. Determined businessman pulling the needle on a multicolored gauge scale, representing effort to reduce risk or stress level. Progress decrease vectors Reduce risk level or decrease stress anxiety meter concept. Businessman pull meter. Reduce risk level or decrease stress anxiety meter concept. Determined businessman pulling the needle on a multicolored gauge scale, representing effort to reduce risk or stress level
Free with trial Downward Trend Chart Illustration with Bars and Arrow Signifying Decrease Business and Finance Data. Progress decrease vectors Downward Trend Chart Illustration with Bars and Arrow Signifying Decrease Business and Finance Data
Free with trial This graphic features two distinct 3D arrows. A vibrant green arrow points upward, symbolizing increase, progress, or positive movement. Alongside it, a bold red arrow points downward, indicating a decrease, decline, or negative trend. Progress decrease illustrations Green up arrow and red down arrow symbols representing growth and decline finances or data white background. This graphic features two distinct 3D arrows. A vibrant green arrow points upward, symbolizing increase, progress, or positive movement. Alongside it, a bold red arrow points downward, indicating a decrease, decline, or negative trend
Free with trial A vector graphic of a line graph showing a downward trend with an arrow. Represents decline, loss, decrease, negative progress, or recession. Useful graphic for financial reports, statistics, or negative outcomes. Illustrating a drop in value, vector design Generative AI. Progress decrease vectors Downward Trend Arrow Vector Graphic, Decline and Loss Icon, vector design Generative AI. A vector graphic of a line graph showing a downward trend with an arrow. Represents decline, loss, decrease, negative progress, or recession. Useful graphic for financial reports, statistics, or negative outcomes. Illustrating a drop in value, vector design Generative AI
Free with trial A bold, glossy red arrow curves downwards, signifying a decrease in business performance, economic downturn, or negative trend. Its sleek design conveys a clear message of decline. Progress decrease illustrations Glossy red downward arrow symbolizing decline progress and business trends. A bold, glossy red arrow curves downwards, signifying a decrease in business performance, economic downturn, or negative trend. Its sleek design conveys a clear message of decline
Free with trial This image features two prominent arrows pointing upwards one green and one red symbolizing contrasting financial performance or progress in different areas. Progress decrease illustrations Two upward arrows green and red showing growth progress and contrasting trends. This image features two prominent arrows pointing upwards one green and one red symbolizing contrasting financial performance or progress in different areas
Free with trial A vivid red arrow signifies a downward trend or negative movement. This impactful graphic represents decline loss decrease and is ideal for illustrating financial reports or data trends. Progress decrease illustrations Bold red arrow points downward showing decline loss decrease trend direction. A vivid red arrow signifies a downward trend or negative movement. This impactful graphic represents decline loss decrease and is ideal for illustrating financial reports or data trends
Free with trial There are 40 different types of increase and decrease icon set. Progress decrease vectors Increase and decrease icon set collection. There are 40 different types of increase and decrease icon set.
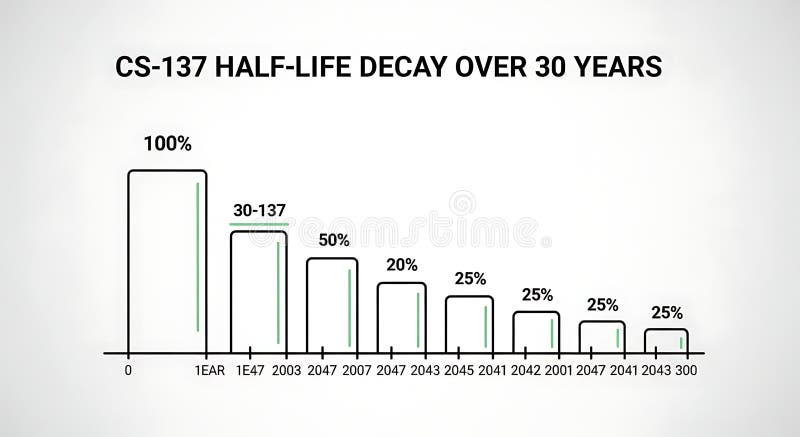
Free with trial A line graph illustrating the decrease in half-life over 30 years with bars representing percentage decay at different years, demonstrating long-term decline suitable for scientific, educational, or research presentations. Progress decrease illustrations Half-life Decay Over 30 Years Chart Showing Decrease in Value or Effectiveness. A line graph illustrating the decrease in half-life over 30 years with bars representing percentage decay at different years, demonstrating long-term decline suitable for scientific, educational, or research presentations
Free with trial This vibrant 3D bar chart illustrates strong business growth and upward progress. The colorful, glossy bars represent data points, clearly showing an increase. Ideal for presentations and reports. Progress decrease illustrations Colorful 3D Bar Chart Showing Business Growth and Progress. This vibrant 3D bar chart illustrates strong business growth and upward progress. The colorful, glossy bars represent data points, clearly showing an increase. Ideal for presentations and reports.
Free with trial This image shows a colorful 3D bar graph representing growth or progress. The bars increase in height, then decrease slightly before another sharp increase, indicating fluctuations in data. The wooden background adds a rustic and visually appealing contrast. Progress decrease illustrations Colorful Bar Graph on Wooden Background. This image shows a colorful 3D bar graph representing growth or progress. The bars increase in height, then decrease slightly before another sharp increase, indicating fluctuations in data. The wooden background adds a rustic and visually appealing contrast.
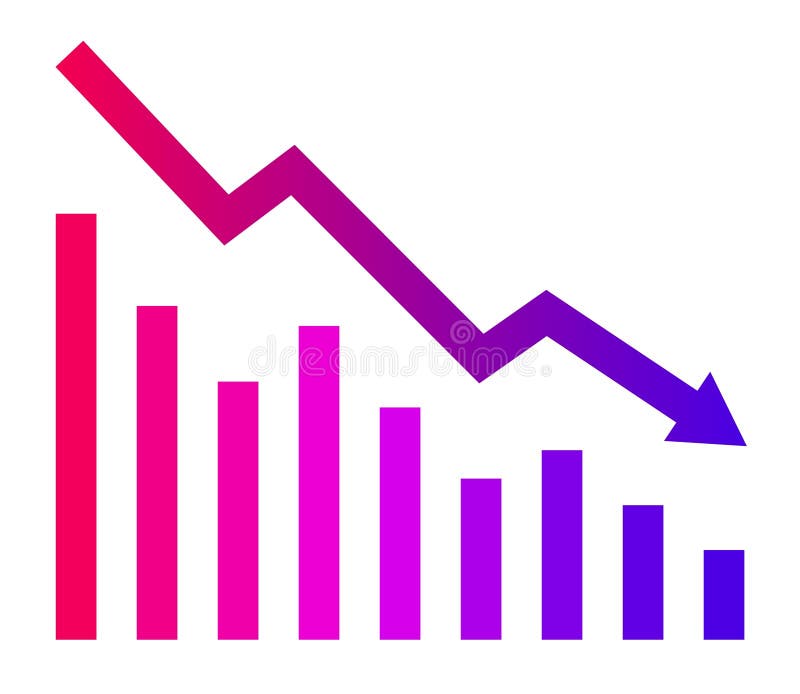
Free with trial A flat vector icon showing a line graph with a distinct downward trend. Represents decline, decrease, negative growth, or falling performance. Suitable for business analysis, financial reports, or graphics illustrating negative progress or statistics, vector design Generative AI. Progress decrease vectors Downward line graph icon representing negative trend decline, vector design Generative AI. A flat vector icon showing a line graph with a distinct downward trend. Represents decline, decrease, negative growth, or falling performance. Suitable for business analysis, financial reports, or graphics illustrating negative progress or statistics, vector design Generative AI
Free with trial Viewing Progress Icon Line Design Style Finance and Business Symbol Vector Illustrations. Progress decrease vectors Viewing Progress Icon Line Design Style Finance and Business Symbol
Free with trial A vibrant red, three-dimensional arrow pointing both upward and downward. This graphic represents direction, progress, choices, decisions, and concepts like increase and decrease. Ideal for visual communication. Perfect for websites and presentations. Progress decrease illustrations Up and Down Directional Arrow Graphic in a Modern 3D Style Indicating Movement and Orientation. A vibrant red, three-dimensional arrow pointing both upward and downward. This graphic represents direction, progress, choices, decisions, and concepts like increase and decrease. Ideal for visual communication. Perfect for websites and presentations.
Free with trial Geometric, abstract design composed of a series of overlapping, outlined arrows pointing to the right against a white background. Arrows decrease in size as they progress, creating a sense of movement or flow. The design alternates between black and gray outlines, enhancing visual contrast and depth. Simple yet modern illustration emphasizing direction and progression. Progress decrease illustrations Geometric, abstract design composed of a series of overlapping, outlined arrows
Free with trial Declining steps with downward arrow symbolizing business market decrease economic downturn. Progress decrease vectors Declining steps with downward arrow symbolizing business market decrease economic downturn
Free with trial Bar chart with a declining arrow, representing decrease, business, finance, economic recession. Progress decrease vectors Bar chart with a declining arrow, representing decrease, business, finance, economic recession
Free with trial A simple, clean graphic featuring two bold, black outline arrows on a white background. One arrow points directly upwards, symbolizing progress, increase, or ascent. The other arrow points directly downwards, representing decline, decrease, or descent. This versatile icon is ideal for representing opposing directions, choices, or data trends in various digital and print applications. Progress decrease illustrations Up and Down Arrows Icon. A simple, clean graphic featuring two bold, black outline arrows on a white background. One arrow points directly upwards, symbolizing progress, increase, or ascent. The other arrow points directly downwards, representing decline, decrease, or descent. This versatile icon is ideal for representing opposing directions, choices, or data trends in various digital and print applications.
Free with trial A stark bar graph illustrates a clear downward trend, symbolized by a descending arrow. This image represents decline, decrease, or negative progression in data. Progress decrease vectors Vector art of bar graph with a downward trend line indicating decline or decrease in data. A stark bar graph illustrates a clear downward trend, symbolized by a descending arrow. This image represents decline, decrease, or negative progression in data
Free with trial A clean, minimalist icon representing a decrease of ten percent, symbolized by a down arrow and the -10% sign. Perfect for financial reports, data analysis, or any context requiring a visual representation of decline. Progress decrease vectors Simple Outline Decrease Percentage Ten Percent Drop Down Arrow Icon. A clean, minimalist icon representing a decrease of ten percent, symbolized by a down arrow and the -10% sign. Perfect for financial reports, data analysis, or any context requiring a visual representation of decline.
Free with trial Growth and reduction arrow, up and down, line icon set. Rise and fall, increase and decrease. Graphic signs. Vector flat illustration. Progress decrease illustrations Growth and reduction arrow, up and down, line icon set. Rise and fall, increase and decrease. Graphic signs. Vector illustration
Free with trial A minimalist black icon depicting an arrow that features a distinct wavy, oscillating curve before straightening and pointing downwards. This graphic symbolizes a fluctuating decline, an unstable downward trend, or a challenging path with variations. Ideal for illustrating concepts such as market volatility, data fluctuations, difficult progress, or any process involving an unstable decrease. Isolated on a white background for versatile use in web, print, and presentations. Generated by AI. Progress decrease vectors Black Wavy Down Arrow Icon. A minimalist black icon depicting an arrow that features a distinct wavy, oscillating curve before straightening and pointing downwards. This graphic symbolizes a fluctuating decline, an unstable downward trend, or a challenging path with variations. Ideal for illustrating concepts such as market volatility, data fluctuations, difficult progress, or any process involving an unstable decrease. Isolated on a white background for versatile use in web, print, and presentations. Generated by AI
Free with trial Graph growth with arrow up and reduction with arrow down, line chart icon. Financial invest, fall, increase and decrease. Statistics and analytics. Vector flat illustration. Progress decrease vectors Graph growth with arrow up and reduction with arrow down, line chart icon. Financial invest, fall, increase and decrease
Free with trial Graph growth with arrow up and reduction with arrow down, line chart icon. Financial invest, fall, increase and decrease. Statistics and analytics. Vector flat illustration. Progress decrease vectors Graph growth with arrow up and reduction with arrow down, line chart icon. Financial invest, fall, increase and decrease