Free with trial A set of linear icons depicting financial growth, including upward arrows, charts, and currency symbols, representing economic progress and investment trends on white. Progress decrease vectors Vector art of financial growth icons a collection of symbols representing economic progress, investment, and market trends. A set of linear icons depicting financial growth, including upward arrows, charts, and currency symbols, representing economic progress and investment trends on white
Free with trial A minimalist graphic featuring two opposing arrows, one pointing up and the other down, separated by a thick vertical line. The upward-pointing arrow is composed of a dark gray triangle atop a lighter gray rectangle, while the downward-pointing arrow consists of a dark blue triangle below a light blue rectangle. This clean design symbolizes concepts like comparison, contrast, growth, decline, progress, and regression, making it ideal for presentations, infographics, and digital interfaces. Progress decrease illustrations Up and Down Arrows with Vertical Divider. A minimalist graphic featuring two opposing arrows, one pointing up and the other down, separated by a thick vertical line. The upward-pointing arrow is composed of a dark gray triangle atop a lighter gray rectangle, while the downward-pointing arrow consists of a dark blue triangle below a light blue rectangle. This clean design symbolizes concepts like comparison, contrast, growth, decline, progress, and regression, making it ideal for presentations, infographics, and digital interfaces.
Free with trial Set of circular dollar currency icons with up and down arrows representing profit, loss, exchange and rate changes flat and glyph styles in black, red and green for business and finance use. Progress decrease vectors Money Currency Icons With Up And Down Arrows Showing Increase And Decrease Financial Trends. Set of circular dollar currency icons with up and down arrows representing profit, loss, exchange and rate changes flat and glyph styles in black, red and green for business and finance use.
Free with trial Isometric Financial growth decrease icon isolated on pink, yellow and blue background. Increasing revenue. Square button. Vector. Progress decrease vectors Isometric Financial growth decrease icon isolated on pink, yellow and blue background. Increasing revenue. Square button
Free with trial Line Financial growth decrease icon isolated on white background. Increasing revenue. Abstract banner with liquid shapes. Vector. Progress decrease illustrations Line Financial growth decrease icon isolated on white background. Increasing revenue. Abstract banner with liquid shapes
Free with trial Decrease and increase percentage business concept. Words "INCREASE" on wooden block changing to "DECREASE," turning by hand with percentage symbol, growth and down chart graph icon on BLUE background. Progress decrease illustrations Words 'INCREASE' on wooden block changing to 'DECREASE,' turning by hand with percentage symbol, growth and down chart graph icon. Decrease and increase percentage business concept. Words "INCREASE" on wooden block changing to "DECREASE," turning by hand with percentage symbol, growth and down chart graph icon on BLUE background.
Free with trial Line Financial growth decrease icon isolated on white and black background. Increasing revenue. Colorful outline concept. Vector. Progress decrease vectors Line Financial growth decrease icon isolated on white and black background. Increasing revenue. Colorful outline concept
Free with trial Red arrow graph indicates stock market decline, real estate downturn, financial loss. 3d illustration visualizes business concept of negative progress, sale reduction, profit decrease. Progress decrease illustrations Red arrow graph indicates stock market decline, real estate downturn, financial loss. 3d illustration visualizes business concept
Free with trial Colorful Financial growth decrease icon isolated on white background. Increasing revenue. Minimalism concept. 3D render illustration. Progress decrease illustrations Colorful Financial growth decrease icon isolated on white background. Increasing revenue. Minimalism concept. 3D render
Free with trial Glowing neon line Financial growth decrease icon isolated on black background. Increasing revenue. Vector. Progress decrease illustrations Glowing neon line Financial growth decrease icon isolated on black background. Increasing revenue. Vector
Free with trial Glowing neon line Financial growth decrease icon isolated on black background. Increasing revenue. Vector. Progress decrease vectors Glowing neon line Financial growth decrease icon isolated on black background. Increasing revenue. Vector
Free with trial Black Financial growth decrease icon isolated on yellow background. Increasing revenue. Warning sign. Vector. Progress decrease vectors Black Financial growth decrease icon isolated on yellow background. Increasing revenue. Warning sign. Vector
Free with trial Set line Financial growth decrease icon isolated on white background. Increasing revenue. Vector. Progress decrease illustrations Set line Financial growth decrease icon isolated on white background. Increasing revenue. Vector
Free with trial White line Financial growth decrease icon isolated on blue background. Increasing revenue. Vector. Progress decrease vectors White line Financial growth decrease icon isolated on blue background. Increasing revenue. Vector
Free with trial Set line Financial growth decrease icon isolated on white background. Increasing revenue. Set icons colorful. Vector. Progress decrease vectors Set line Financial growth decrease icon isolated on white background. Increasing revenue. Set icons colorful. Vector
Free with trial Set line Financial growth decrease icon isolated on white background. Increasing revenue. Set icons colorful. Vector. Progress decrease vectors Set line Financial growth decrease icon isolated on white background. Increasing revenue. Set icons colorful. Vector
Free with trial Colorful Financial growth decrease icon isolated on white background. Increasing revenue. Circle button. 3D render illustration. Progress decrease illustrations Colorful Financial growth decrease icon isolated on white background. Increasing revenue. Circle button. 3D render
Free with trial Filled outline Financial growth decrease icon isolated on blue background. Increasing revenue. Vector. Progress decrease vectors Filled outline Financial growth decrease icon isolated on blue background. Increasing revenue. Vector
Free with trial Filled outline Financial growth decrease icon isolated on blue background. Increasing revenue. Vector. Progress decrease illustrations Filled outline Financial growth decrease icon isolated on blue background. Increasing revenue. Vector
Free with trial Filled outline Financial growth decrease icon isolated on white background. Increasing revenue. Vector. Progress decrease vectors Filled outline Financial growth decrease icon isolated on white background. Increasing revenue. Vector
Free with trial Glowing neon Financial growth decrease icon isolated on brick wall background. Increasing revenue. Vector. Progress decrease vectors Glowing neon Financial growth decrease icon isolated on brick wall background. Increasing revenue. Vector
Free with trial Colorful Financial growth decrease icon isolated on white background. Increasing revenue. Minimalism concept. 3D render illustration. Progress decrease illustrations Colorful Financial growth decrease icon isolated on white background. Increasing revenue. Minimalism concept. 3D render
Free with trial This image presents a detailed timeline infographic illustrating the archaeological dig restoration process spanning from 2004 to 2005, divided into six distinct color-coded sections that visually represent different procedural steps using blue, green, yellow, and orange hues to track the steady increase and subsequent decrease in dig records over time, featuring a bold white title reading. Progress decrease illustrations Archaeological dig restoration process timeline infographic showing progress from 2004 to 2005 with color-coded sections and. This image presents a detailed timeline infographic illustrating the archaeological dig restoration process spanning from 2004 to 2005, divided into six distinct color-coded sections that visually represent different procedural steps using blue, green, yellow, and orange hues to track the steady increase and subsequent decrease in dig records over time, featuring a bold white title reading
Free with trial 2026. Decrease chart. Red color. 3d illustration. Progress decrease illustrations 2026. Decrease chart. Red color.
Free with trial 3D Red arrow pointing down, illustrating financial loss and recession. Gold coins arranged in decreasing stacks, symbolizing money decrease. Vector illustration. Progress decrease vectors 3D Red arrow and coins pointing down. 3D Red arrow pointing down, illustrating financial loss and recession. Gold coins arranged in decreasing stacks, symbolizing money decrease. Vector illustration
Free with trial 3D Red down arrow showing declining trend. Business stock market decrease symbol. Economic crisis concept. Vector illustration. Progress decrease vectors 3D Red down arrow showing declining trend
Free with trial A clean, minimalist icon representing an analytics graph. It features a series of vertical bars of varying heights, symbolizing data or trends. A line graph with circular data points connects the tops of some of the bars, illustrating growth, progress, or fluctuations over time. This graphic is ideal for representing business intelligence, financial data, research, or any concept related to data analysis and performance. Progress decrease vectors Analytics Graph Icon with Data Points. A clean, minimalist icon representing an analytics graph. It features a series of vertical bars of varying heights, symbolizing data or trends. A line graph with circular data points connects the tops of some of the bars, illustrating growth, progress, or fluctuations over time. This graphic is ideal for representing business intelligence, financial data, research, or any concept related to data analysis and performance.
Free with trial Arrow curving downward with rough striped texture and tapered point, hand drawn and bold. Symbol of decline, drop, decrease, downturn, and direction for charts. Cartoon vector illustration. Progress decrease vectors Arrow Bending Down Hand Drawn. Arrow curving downward with rough striped texture and tapered point, hand drawn and bold. Symbol of decline, drop, decrease, downturn, and direction for charts. Cartoon vector illustration.
Free with trial A minimalist black and white icon featuring a lightning bolt symbol within a circle. A jagged arrow, representing a downward trend or decline, originates from the top of the circle and points towards the bottom right. The lightning bolt is positioned to the left of the arrow's path. This graphic symbolizes concepts like energy loss, power decrease, economic downturn, or a negative trend in performance. Its clean design makes it suitable for various digital and print applications. Progress decrease vectors Lightning Bolt Downward Trend Icon. A minimalist black and white icon featuring a lightning bolt symbol within a circle. A jagged arrow, representing a downward trend or decline, originates from the top of the circle and points towards the bottom right. The lightning bolt is positioned to the left of the arrow's path. This graphic symbolizes concepts like energy loss, power decrease, economic downturn, or a negative trend in performance. Its clean design makes it suitable for various digital and print applications.
Free with trial A clean and modern vector illustration featuring two prominent white arrows, one pointing upwards and the other downwards, enclosed within a blue square with rounded corners. The arrows have a distinct black outline, creating a clear and versatile icon. This graphic effectively represents concepts such as upload and download, increase and decrease, directional movement, data transfer, or sorting. Ideal for web design, mobile applications, user interfaces, infographics, and any project requiring clear transactional or navigational indicators with a flat design aesthetic. Progress decrease vectors Up and Down Arrows Icon for Upload Download Direction. A clean and modern vector illustration featuring two prominent white arrows, one pointing upwards and the other downwards, enclosed within a blue square with rounded corners. The arrows have a distinct black outline, creating a clear and versatile icon. This graphic effectively represents concepts such as upload and download, increase and decrease, directional movement, data transfer, or sorting. Ideal for web design, mobile applications, user interfaces, infographics, and any project requiring clear transactional or navigational indicators with a flat design aesthetic.
Free with trial Analysis audit sales growth report icon vector modern comparing with loss failure statistics business data performance set sign symbol, progress assessment strategy vs recession decrease graph clipart. Progress decrease vectors Analysis audit sales growth report icon vector modern comparing with loss failure statistics business data performance set sign. Symbol, progress assessment. Analysis audit sales growth report icon vector modern comparing with loss failure statistics business data performance set sign symbol, progress assessment strategy vs recession decrease graph clipart
Free with trial Simple black vector icons depict an upward arrow with a percentage sign and a downward arrow with a percentage sign, symbolizing financial growth and decline in a flat design. Progress decrease vectors Black percentage increase and decrease icons. Simple black vector icons depict an upward arrow with a percentage sign and a downward arrow with a percentage sign, symbolizing financial growth and decline in a flat design
Free with trial A minimalist flat design vector illustration featuring red circle with downward arrow and green circle with upward arrow, symbolizing contrast. Progress decrease vectors Increase and decrease arrows for data trends. A minimalist flat design vector illustration featuring red circle with downward arrow and green circle with upward arrow, symbolizing contrast
Free with trial Blue arrow pointing down symbolizes decrease, globe indicates world aspect, pendulum reflects instability. Ideal for economy, finance, global change, risk, analysis, prediction simple flat metaphor. Progress decrease vectors Downward Arrow with Globe and Pendulum Representing Global Decline and Impact. Blue arrow pointing down symbolizes decrease, globe indicates world aspect, pendulum reflects instability. Ideal for economy, finance, global change, risk, analysis, prediction simple flat metaphor
Free with trial Chart with upward trend and happy face, red cross symbol indicating decline, and a small cloud shape. Ideal for analytics, progress, performance, feedback, warning, balance simple flat metaphor. Progress decrease vectors Positive Data Trends with happy Face, Decline Warning, and Cloud Element. Chart with upward trend and happy face, red cross symbol indicating decline, and a small cloud shape. Ideal for analytics, progress, performance, feedback, warning, balance simple flat metaphor
Free with trial Woman working on laptop atop bar graph, large downward arrow symbolizing decrease, airplane highlighting travel or aviation. Ideal for business trends, travel industry, finance, productivity. Progress decrease vectors Woman with Laptop Sitting on Bar Graph with Downward Arrow and Airplane in Blue Circle. Woman working on laptop atop bar graph, large downward arrow symbolizing decrease, airplane highlighting travel or aviation. Ideal for business trends, travel industry, finance, productivity
Free with trial Percentage symbol integrated within a purple circular arrow indicating process, loading, progress, updates, or a discount calculation, symbolizing a dynamic financial or data operation. Progress decrease illustrations Percentage icon with circular loading process arrow. Percentage symbol integrated within a purple circular arrow indicating process, loading, progress, updates, or a discount calculation, symbolizing a dynamic financial or data operation
Free with trial Minimalistic human head profile alongside descending bar chart, showcasing analysis, statistics, and progress trends. Ideal for business, evaluation, decision-making, trends, growth performance. Progress decrease illustrations Human Profile Beside Downward Bar Chart Representing Analytics and Performance Trends. Minimalistic human head profile alongside descending bar chart, showcasing analysis, statistics, and progress trends. Ideal for business, evaluation, decision-making, trends, growth performance
Free with trial A versatile set of black and white vector icons depicting financial growth, decline, and market trends. Perfect for business, analytics, and finance presentations. Progress decrease vectors Set of increase and decrease financial data icons. A versatile set of black and white vector icons depicting financial growth, decline, and market trends. Perfect for business, analytics, and finance presentations
Free with trial A diverse set of graphic icons representing financial growth, decline, and market trends with clear up and down arrows, bar charts, and coin stacks. Flat design. Progress decrease vectors Collection of colorful increase and decrease icons. A diverse set of graphic icons representing financial growth, decline, and market trends with clear up and down arrows, bar charts, and coin stacks. Flat design
Free with trial A flat design vector illustration showing a graph with rising and falling bars, marked by green and red arrows indicating increase and decrease. Ideal for financial concepts. Progress decrease vectors Bar chart showing positive and negative data trends. A flat design vector illustration showing a graph with rising and falling bars, marked by green and red arrows indicating increase and decrease. Ideal for financial concepts
Free with trial Person seated on bar chart with laptop, upward and downward arrows, cloud element. Ideal for data trends, analytics, cloud computing, statistics, progress tracking, career growth simple flat. Progress decrease vectors Woman Analyzing Data on Laptop, Representing Cloud-Based Growth and Decline Trends. Person seated on bar chart with laptop, upward and downward arrows, cloud element. Ideal for data trends, analytics, cloud computing, statistics, progress tracking, career growth simple flat
Free with trial Illustration of a descending bar graph with an arrow signifying decline. Percentage symbol indicates decrease. Minimalist flat style, on black background. Progress decrease vectors Declining bar graph with percentage drop indicator icon. Illustration of a descending bar graph with an arrow signifying decline. Percentage symbol indicates decrease. Minimalist flat style, on black background.
Free with trial Downward trend line on grid chart with sad face and progress icon signaling mediocre results or declining metrics. Ideal for failure, analytics, market loss, strategy, performance, results, simple. Progress decrease illustrations Declining Trend on Graph with Sad Face Symbolizing Negative Results or Performance. Downward trend line on grid chart with sad face and progress icon signaling mediocre results or declining metrics. Ideal for failure, analytics, market loss, strategy, performance, results, simple
Free with trial A clear, minimalist illustration featuring two distinct arrows on a clean white background. On the left, a blue arrow points downwards, symbolizing concepts like decrease, decline, or negative trends. On the right, a vibrant green arrow points upwards, representing increase, growth, improvement, or positive movement. Rendered in a modern flat design style, this versatile graphic is ideal for conveying directional changes, comparisons, data trends, or navigation in user interfaces, presentations, infographics, and educational content. Progress decrease illustrations Green Up and Blue Down Arrows. A clear, minimalist illustration featuring two distinct arrows on a clean white background. On the left, a blue arrow points downwards, symbolizing concepts like decrease, decline, or negative trends. On the right, a vibrant green arrow points upwards, representing increase, growth, improvement, or positive movement. Rendered in a modern flat design style, this versatile graphic is ideal for conveying directional changes, comparisons, data trends, or navigation in user interfaces, presentations, infographics, and educational content.
Free with trial Collection of hand-drawn sketch-style icons featuring staircases and arrows. Set illustrates concepts of progress, career growth, success, decline, and step-by-step movement. Ideal for business presentations, infographics, and web design. Progress decrease vectors Hand-drawn staircase with arrows set. Up and down stairs business concept icons. Collection of hand-drawn sketch-style icons featuring staircases and arrows. Set illustrates concepts of progress, career growth, success, decline, and step-by-step movement. Ideal for business presentations, infographics, and web design.
Free with trial A simple and clean line art icon of a graph, isolated on a white background. This vector illustration features a line chart with axes, showing a fluctuating trend with distinct data points. The minimalist design makes it perfect for various applications related to business, finance, and data analysis. Ideal for use in presentations, infographics, websites, mobile apps, and user interfaces to represent concepts like statistics, growth, market trends, performance reports, and financial analytics. A versatile symbol for progress and data visualization. Progress decrease illustrations Analytics Line Graph Vector Icon. A simple and clean line art icon of a graph, isolated on a white background. This vector illustration features a line chart with axes, showing a fluctuating trend with distinct data points. The minimalist design makes it perfect for various applications related to business, finance, and data analysis. Ideal for use in presentations, infographics, websites, mobile apps, and user interfaces to represent concepts like statistics, growth, market trends, performance reports, and financial analytics. A versatile symbol for progress and data visualization.
Free with trial CO2 footprint, thermometer with a down arrow, document, upward arrows symbolizing growth. Ideal for sustainability, carbon impact, environmental responsibility, climate change, energy efficiency. Progress decrease vectors Carbon Footprint Measurement with Decreasing Impact and Sustainability Progress Visualized. CO2 footprint, thermometer with a down arrow, document, upward arrows symbolizing growth. Ideal for sustainability, carbon impact, environmental responsibility, climate change, energy efficiency
Free with trial Rocket taking off next to upward and downward arrows and a percentage sign. Ideal for growth, progress, performance, finance, business, fluctuation, and innovation themes. Simple flat metaphor. Progress decrease vectors Rocket Launching Amid Upward and Downward Arrows with Percentage Symbol Emphasizing Growth Dynamics. Rocket taking off next to upward and downward arrows and a percentage sign. Ideal for growth, progress, performance, finance, business, fluctuation, and innovation themes. Simple flat metaphor
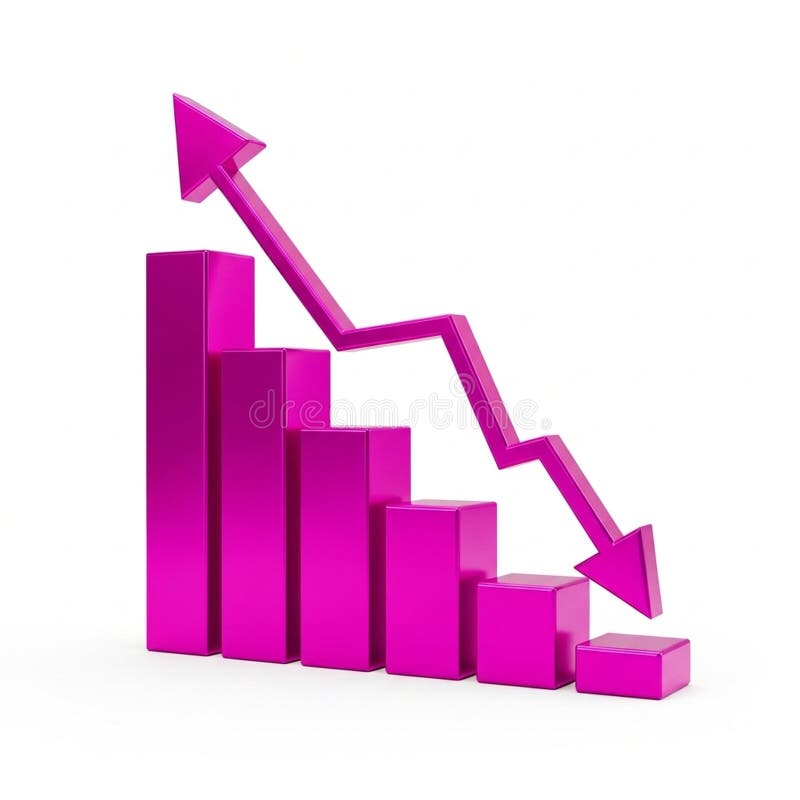
Free with trial A vibrant pink 3D bar chart illustrates financial data with a prominent downward-trending arrow superimposed. The bars decrease in height from left to right, signifying a decline. An upward-pointing arrow is positioned at the top left, indicating a contrasting upward trend. The graphic is isolated on a white background, making it suitable for presentations on financial performance, market trends,. Progress decrease illustrations 3D Pink Bar Chart with Downward Trend Arrow and Upward Trend Arrow graph statistics. A vibrant pink 3D bar chart illustrates financial data with a prominent downward-trending arrow superimposed. The bars decrease in height from left to right, signifying a decline. An upward-pointing arrow is positioned at the top left, indicating a contrasting upward trend. The graphic is isolated on a white background, making it suitable for presentations on financial performance, market trends,
Free with trial Modern flat icon set featuring solid black arrows in various directions, vector illustration isolated on white background for commercial use. Progress decrease vectors Flat design arrow icons set progress direction growth vector illustration. Modern flat icon set featuring solid black arrows in various directions, vector illustration isolated on white background for commercial use
Free with trial A simple illustration of a declining blue bar graph against a black background. Represents loss or decrease. Progress decrease vectors Declining bar graph demonstrating financial loss and recession illustration. A simple illustration of a declining blue bar graph against a black background. Represents loss or decrease.
Free with trial A simple graphic illustrating debt reduction. The image features a line graph with a downward trend, transitioning from green to blue, culminating in an arrow pointing downwards towards a horizontal line. The text "5. Debt Reduction" is placed above the graph. This visual can be used to represent financial improvement, debt management, or economic progress. Progress decrease vectors Debt Reduction Chart with Downward Arrow. A simple graphic illustrating debt reduction. The image features a line graph with a downward trend, transitioning from green to blue, culminating in an arrow pointing downwards towards a horizontal line. The text "5. Debt Reduction" is placed above the graph. This visual can be used to represent financial improvement, debt management, or economic progress.
Free with trial A visual representation of an energy efficiency rating system is displayed on a white background. It consists of seven horizontal arrows, each labeled with a letter from A (green) at the top to G (red) at the bottom. The arrows decrease in size as they go down the scale, with intermediate colors like yellow and orange representing intermediate ratings. Progress decrease illustrations Energy Efficiency Rating Chart with Colored Arrows from A to G graph. A visual representation of an energy efficiency rating system is displayed on a white background. It consists of seven horizontal arrows, each labeled with a letter from A (green) at the top to G (red) at the bottom. The arrows decrease in size as they go down the scale, with intermediate colors like yellow and orange representing intermediate ratings
Free with trial A bright red, three-dimensional arrow is depicted pointing directly downwards. The arrow has a glossy, reflective surface and is presented in isolation against a stark white background. This visual element commonly represents a downward trend, decrease, or negative movement. Progress decrease illustrations Shiny Red 3D Arrow Pointing Downwards on a White Background direction. A bright red, three-dimensional arrow is depicted pointing directly downwards. The arrow has a glossy, reflective surface and is presented in isolation against a stark white background. This visual element commonly represents a downward trend, decrease, or negative movement
Free with trial This striking abstract vector illustration features a dynamic spiral composed entirely of black squares, set against a clean white background. The squares decrease in size and density as they converge towards the center, creating a mesmerizing sense of depth and movement. This minimalist geometric design evokes concepts of progress, technology, data flow, and infinite expansion. Ideal for modern branding, corporate presentations, web backgrounds, app icons, or any project requiring a sleek, contemporary, and visually engaging graphic element. Progress decrease vectors Geometric Black Square Spiral Abstract Design. This striking abstract vector illustration features a dynamic spiral composed entirely of black squares, set against a clean white background. The squares decrease in size and density as they converge towards the center, creating a mesmerizing sense of depth and movement. This minimalist geometric design evokes concepts of progress, technology, data flow, and infinite expansion. Ideal for modern branding, corporate presentations, web backgrounds, app icons, or any project requiring a sleek, contemporary, and visually engaging graphic element.
Free with trial Business charts, data visualization, financial analysis, progress tracking, statistics, graphs, analysis, charts bar in line, orange. Progress decrease vectors Collection of diverse orange bar charts and line graph against a white background. Business charts, data visualization, financial analysis, progress tracking, statistics, graphs, analysis, charts bar in line, orange
Free with trial A 3D bar chart rendered in a vibrant pink color illustrates a significant downward trend. The bars decrease in height from left to right, culminating in a very short bar. A bold pink arrow, also in 3D, starts high on the left and sharply descends to the right, mirroring the decline shown by the bars. The entire graphic is isolated on a clean white background. Progress decrease illustrations Pink 3D Bar Chart Showing a Downward Trend with an Arrow graph decline. A 3D bar chart rendered in a vibrant pink color illustrates a significant downward trend. The bars decrease in height from left to right, culminating in a very short bar. A bold pink arrow, also in 3D, starts high on the left and sharply descends to the right, mirroring the decline shown by the bars. The entire graphic is isolated on a clean white background
Free with trial A comprehensive collection of 12 modern, abstract vector icons designed for business, finance, and data analytics themes. This vibrant set features geometric shapes, upward-trending bar charts, risk indicators, decision-making prompts like "YES" and "NO," and numerical data representations. Perfect for enhancing presentations, reports, websites, mobile applications, and infographics, these versatile symbols convey concepts of growth, strategy, risk management, market analysis, and progress with a clean, contemporary aesthetic. Progress decrease vectors Business and Data Analytics Abstract Icon Set. A comprehensive collection of 12 modern, abstract vector icons designed for business, finance, and data analytics themes. This vibrant set features geometric shapes, upward-trending bar charts, risk indicators, decision-making prompts like "YES" and "NO," and numerical data representations. Perfect for enhancing presentations, reports, websites, mobile applications, and infographics, these versatile symbols convey concepts of growth, strategy, risk management, market analysis, and progress with a clean, contemporary aesthetic.
Free with trial A vibrant green 3D arrow is depicted pointing downwards, with a layered or stepped design. The arrow has a smooth, glossy finish and casts a subtle shadow on the white background. This visual element represents concepts of decrease, decline, or downward movement. Progress decrease illustrations Green 3D arrow pointing downwards with layered effect direction movement. A vibrant green 3D arrow is depicted pointing downwards, with a layered or stepped design. The arrow has a smooth, glossy finish and casts a subtle shadow on the white background. This visual element represents concepts of decrease, decline, or downward movement
Free with trial A minimalist flat design icon featuring a vertical separator bar. On the left, an upward-pointing arrow and a dark grey triangle symbolize "up" or "upload. " On the right, a downward-pointing arrow and an inverted dark grey triangle represent "down" or "download. " This versatile vector illustration is ideal for user interface elements, web design, mobile applications, data transfer concepts, navigation, or indicating directional movement and progress. Progress decrease illustrations Up Down Arrows Icon for Upload Download Concept. A minimalist flat design icon featuring a vertical separator bar. On the left, an upward-pointing arrow and a dark grey triangle symbolize "up" or "upload." On the right, a downward-pointing arrow and an inverted dark grey triangle represent "down" or "download." This versatile vector illustration is ideal for user interface elements, web design, mobile applications, data transfer concepts, navigation, or indicating directional movement and progress.
Free with trial A comprehensive vector icon set depicting various aspects of online video content creation and social media analytics. This collection includes symbols for growth charts, play buttons, speech bubbles representing comments or chat, subscriber counts, watch time indicators, and percentage-based progress arrows. Ideal for illustrating concepts related to video platforms, digital marketing, content creator dashboards, performance reports, and online engagement strategies. The modern flat design makes it suitable for websites, mobile applications, and presentations. Progress decrease vectors Video Content and Social Media Analytics Icon Set. A comprehensive vector icon set depicting various aspects of online video content creation and social media analytics. This collection includes symbols for growth charts, play buttons, speech bubbles representing comments or chat, subscriber counts, watch time indicators, and percentage-based progress arrows. Ideal for illustrating concepts related to video platforms, digital marketing, content creator dashboards, performance reports, and online engagement strategies. The modern flat design makes it suitable for websites, mobile applications, and presentations.
Free with trial A bold, glossy green arrow is depicted pointing directly downwards. The arrow has a smooth, reflective surface and is presented in a studio shot against a clean white background, making it isolated. Its clear directional cue makes it suitable for representing concepts of decline, decrease, or downward movement. Progress decrease illustrations A large, glossy green arrow pointing downwards on a white background direction. A bold, glossy green arrow is depicted pointing directly downwards. The arrow has a smooth, reflective surface and is presented in a studio shot against a clean white background, making it isolated. Its clear directional cue makes it suitable for representing concepts of decline, decrease, or downward movement
Free with trial Gold coins with arrows and graphs pointing up or down. Financial growth. Market decline. Crisis and recession. Statistics chart. Finance success. Increase or decrease cash infographic. Vector concept. Progress decrease vectors Gold coins with arrows and graphs pointing up or down. Financial growth. Market decline. Crisis and recession. Statistics chart
Free with trial A simple illustration depicting flat business growth. A horizontal arrow points to the right, indicating stagnation or no significant increase. The chart is clean and minimalist, suitable for presentations, reports, and articles discussing economic challenges or business performance. The image can be used to represent a lack of progress, a plateau in growth, or a need for strategic change. Progress decrease illustrations Flat Business Growth Chart. A simple illustration depicting flat business growth. A horizontal arrow points to the right, indicating stagnation or no significant increase. The chart is clean and minimalist, suitable for presentations, reports, and articles discussing economic challenges or business performance. The image can be used to represent a lack of progress, a plateau in growth, or a need for strategic change.
Free with trial A comprehensive vector icon set featuring essential symbols for business, finance, and data analysis. This collection includes various arrows for indicating growth and decline, wavy lines representing market trends, checkmarks for success or approval, X marks for errors or rejection, stopwatches for time management and efficiency, and stacks of coins with dollar signs for financial concepts. Ideal for presentations, infographics, web design, and reports to visually communicate progress, status, and economic indicators. Progress decrease vectors Business, Finance, and Data Analytics Vector Icon Set. A comprehensive vector icon set featuring essential symbols for business, finance, and data analysis. This collection includes various arrows for indicating growth and decline, wavy lines representing market trends, checkmarks for success or approval, X marks for errors or rejection, stopwatches for time management and efficiency, and stacks of coins with dollar signs for financial concepts. Ideal for presentations, infographics, web design, and reports to visually communicate progress, status, and economic indicators.
Free with trial Gear mechanism with people icons falling beneath a large down arrow, illustrating decrease in metrics, performance decline, workflow reduction and lowered efficiency in business or system settings. Progress decrease vectors Gear mechanism indicating reducing downward process. Gear mechanism with people icons falling beneath a large down arrow, illustrating decrease in metrics, performance decline, workflow reduction and lowered efficiency in business or system settings
Free with trial A cartoon-style illustration of a bar graph displayed on a presentation screen. The graph shows three bars of different heights and colors (green, orange, and yellow), indicating growth or progress. The image is clean and simple, suitable for illustrating business, finance, or educational concepts in a visually appealing way. Progress decrease illustrations Cartoon Bar Graph Presentation. A cartoon-style illustration of a bar graph displayed on a presentation screen. The graph shows three bars of different heights and colors (green, orange, and yellow), indicating growth or progress. The image is clean and simple, suitable for illustrating business, finance, or educational concepts in a visually appealing way.
Free with trial A shiny golden arrow forms a path that initially moves upward, then dips down, and finally turns upward again, presented in a 3D render against a clean white background. This abstract representation symbolizes financial growth, market fluctuations, and business progress. Progress decrease illustrations Golden Arrow Graph Showing Upward Trend and Downturn on White Background chart. A shiny golden arrow forms a path that initially moves upward, then dips down, and finally turns upward again, presented in a 3D render against a clean white background. This abstract representation symbolizes financial growth, market fluctuations, and business progress
Free with trial A striking red 3D arrow is constructed from a series of connected cubes that gradually decrease in size as they form the arrow's shaft. The arrow points downwards and to the right, suggesting a trend or decline. The entire object is rendered in sharp detail against a clean white background. Progress decrease illustrations Red 3D Arrow Composed of Cubes Progressing Downward on White Background blocks. A striking red 3D arrow is constructed from a series of connected cubes that gradually decrease in size as they form the arrow's shaft. The arrow points downwards and to the right, suggesting a trend or decline. The entire object is rendered in sharp detail against a clean white background
Free with trial Gear mechanism showing a large downward arrow surrounded by smaller blue figures, illustrating a concept of decline, decrease, or negative trend within a system or process. Progress decrease vectors Economic downfall concept with downward arrow in gear. Gear mechanism showing a large downward arrow surrounded by smaller blue figures, illustrating a concept of decline, decrease, or negative trend within a system or process
Free with trial A bold, three-dimensional red arrow depicted in a downward curve, signifying a negative trend, decline, or decrease, isolated against a clean white background for clear visual emphasis. Progress decrease illustrations Red arrow curving downwards isolated on white background. A bold, three-dimensional red arrow depicted in a downward curve, signifying a negative trend, decline, or decrease, isolated against a clean white background for clear visual emphasis
Free with trial A three-dimensional bar graph composed of translucent blue bars illustrates a significant downward trend. The bars decrease in height from left to right, and a large, transparent blue arrow points downwards, reinforcing the concept of decline. The graph is set against a gradient blue background, creating a sense of depth and focus on the data visualization. Progress decrease illustrations A3D Rendered Blue Bar Graph Showing a Downward Trend with a Falling Arrow chart data. A three-dimensional bar graph composed of translucent blue bars illustrates a significant downward trend. The bars decrease in height from left to right, and a large, transparent blue arrow points downwards, reinforcing the concept of decline. The graph is set against a gradient blue background, creating a sense of depth and focus on the data visualization
Free with trial A simple hand-drawn illustration of a bar chart or graph. The chart is rendered in black lines on a white background, with the lower portions of the bars filled with diagonal hatching. This image can be used to represent data, statistics, growth, progress, or analysis in a visually appealing and informal way. Suitable for presentations, reports, or website graphics. Progress decrease illustrations Hand-Drawn Bar Chart Illustration. A simple hand-drawn illustration of a bar chart or graph. The chart is rendered in black lines on a white background, with the lower portions of the bars filled with diagonal hatching. This image can be used to represent data, statistics, growth, progress, or analysis in a visually appealing and informal way. Suitable for presentations, reports, or website graphics.
Free with trial Close-up of a hand gripping a bright red marker pen, drawing a clear red line on a pristine white surface. This imagery symbolizes emphasis, correction, or charting progress. Progress decrease illustrations Hand holding a red marker pen drawing a downward arrow line. Close-up of a hand gripping a bright red marker pen, drawing a clear red line on a pristine white surface. This imagery symbolizes emphasis, correction, or charting progress
Free with trial A diverse collection of downward-pointing arrows presented against a clean, light grey background. The arrows vary in style, including solid black, outlined, and shaded grey designs. This graphic element is ideal for representing direction, decline, progress, or a list of instructions. Its versatile design makes it suitable for web graphics, presentations, infographics, and print materials. Progress decrease vectors Collection of Downward Arrows in Various Styles. A diverse collection of downward-pointing arrows presented against a clean, light grey background. The arrows vary in style, including solid black, outlined, and shaded grey designs. This graphic element is ideal for representing direction, decline, progress, or a list of instructions. Its versatile design makes it suitable for web graphics, presentations, infographics, and print materials.
Free with trial This image visually represents financial growth and achievement, featuring a collection of coins with glowing neon percentage signs overlaid. The percentages range from 1% to 100%, suggesting progress, milestones, and reaching financial goals. The vibrant neon colors and the metallic sheen of the coins create a modern and dynamic feel, ideal for concepts related to investment, savings, business success, and financial planning. Progress decrease illustrations Percentage Growth and Financial Success. This image visually represents financial growth and achievement, featuring a collection of coins with glowing neon percentage signs overlaid. The percentages range from 1% to 100%, suggesting progress, milestones, and reaching financial goals. The vibrant neon colors and the metallic sheen of the coins create a modern and dynamic feel, ideal for concepts related to investment, savings, business success, and financial planning.
Free with trial A horizontal layout of multiple data visualizations illustrates key trends in HIV treatment and diagnosis, featuring line and bar graphs with upward and downward trajectories indicating changes in patient numbers, diagnosis percentages, and global infection rates, where a blue line graph shows increasing patient counts, a second bar chart reflects diagnosed case percentages, a third displays. Progress decrease illustrations HIV treatment progress dashboard with statistical graphs showing patient growth, diagnosis rates, and global trends. A horizontal layout of multiple data visualizations illustrates key trends in HIV treatment and diagnosis, featuring line and bar graphs with upward and downward trajectories indicating changes in patient numbers, diagnosis percentages, and global infection rates, where a blue line graph shows increasing patient counts, a second bar chart reflects diagnosed case percentages, a third displays
Free with trial A stylized, flat design illustration of a bar chart depicting a downward trend. The bars are colored red, yellow, and blue, arranged in decreasing height from left to right. A prominent red arrow points downwards across the chart, emphasizing the decline. The graphic is set against a clean white background, making it ideal for presentations, reports, and financial concepts related to loss, decrease, or negative performance. Progress decrease illustrations Declining Bar Chart with Downward Arrow. A stylized, flat design illustration of a bar chart depicting a downward trend. The bars are colored red, yellow, and blue, arranged in decreasing height from left to right. A prominent red arrow points downwards across the chart, emphasizing the decline. The graphic is set against a clean white background, making it ideal for presentations, reports, and financial concepts related to loss, decrease, or negative performance.
Free with trial This visually striking image depicts a futuristic financial concept. Scattered coins on a dark surface are illuminated by glowing neon percentages (1%, 10%, 20%, 30%, 50%, 100%). A subtle network of lines and lights in the background suggests a digital or abstract representation of data and growth. The composition evokes themes of investment, progress, and financial targets, suitable for business, finance, and technology-related content. Progress decrease illustrations Digital Growth and Financial Percentages. This visually striking image depicts a futuristic financial concept. Scattered coins on a dark surface are illuminated by glowing neon percentages (1%, 10%, 20%, 30%, 50%, 100%). A subtle network of lines and lights in the background suggests a digital or abstract representation of data and growth. The composition evokes themes of investment, progress, and financial targets, suitable for business, finance, and technology-related content.