Free with trial A 3D render of a business chart illustrating a financial decline with a visual representation of falling data, presented on an artist's easel. Concept for economic downturn. Sales decrease vectors 3d business graph showing a downward trend with bar chart and line on an easel stand transparent background. A 3D render of a business chart illustrating a financial decline with a visual representation of falling data, presented on an artist's easel. Concept for economic downturn
Free with trial Beautiful, meticulously designed Sales decrease report icon. Sales decrease vectors Sales decrease report icon
Free with trial Sales line icons. linear set. quality vector line set such as contactless, contactless, sale, decrease, sales, launch, sales, sale. Sales decrease vectors Sales line icons. linear set. quality vector line set such as contactless, contactless, sale, decrease, sales, launch, sales, sale
Free with trial Hand Drawn Graphic Chart Showing Initial Growth then Downward Trend to Final State Illustrating Business Cycle. Sales decrease vectors Hand Drawn Graphic Chart Showing Initial Growth then Downward Trend to Final State Illustrating Business Cycle
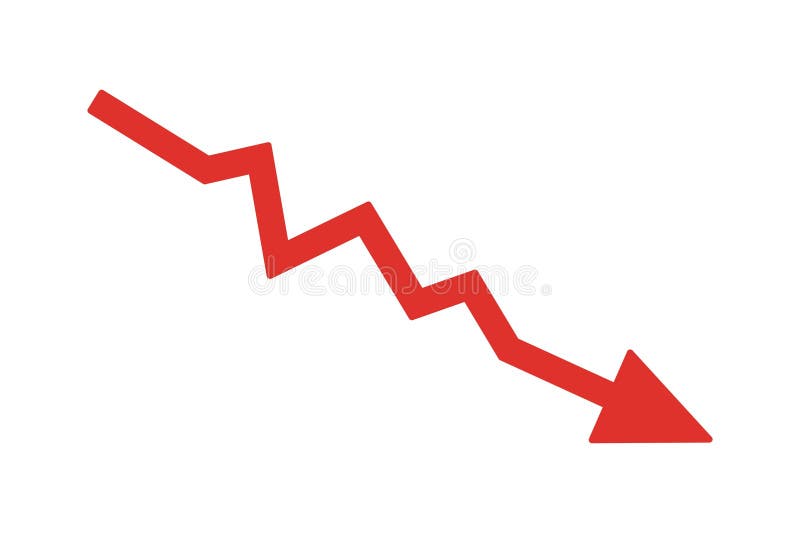
Free with trial This infographic illustrates a crucial aspect of data analysis: recognizing and interpreting downward trends. The chart clearly displays a decreasing arrow, highlighting a negative slope and a reduction in value over time. Understanding these downward trends is critical in various fields, from finance and business to investment and market analysis. The visual representation aids in quickly. Sales decrease illustrations Analyzing Downward Trends in Data A Comprehensive Guide to Understanding Decreasing Charts and Graphs in Business. This infographic illustrates a crucial aspect of data analysis: recognizing and interpreting downward trends. The chart clearly displays a decreasing arrow, highlighting a negative slope and a reduction in value over time. Understanding these downward trends is critical in various fields, from finance and business to investment and market analysis. The visual representation aids in quickly
Free with trial Business icons collection is a vector illustration with editable stroke. Sales decrease vectors Business icons collection is a vector illustration with editable stroke.
Free with trial Colorful data visualization with various charts and graphs. Visual representation of growth and performance metrics, breathtaking wallpaper background Generative AI. Sales decrease illustrations Colorful data visualization with various charts and graphs. Visual representation of growth and performance metrics
Free with trial Hand interacting with a declining chart, symbolizing market trends and financial analysis ,Generative ai. Sales decrease illustrations Declining chart and hand interaction, visualizing market trends financial analysis for strategic decisionmaking. Hand interacting with a declining chart, symbolizing market trends and financial analysis ,Generative ai
Free with trial This vibrant bar chart infographic is a powerful tool for communicating complex data in a clear and engaging way. Ideal for business presentations, reports, and marketing materials, this visually appealing design highlights key performance indicators and trends. The clean, modern aesthetic ensures your message stands out, while the colorful bars and clear labels make understanding the statistics. Sales decrease illustrations Colorful Bar Chart Infographic Diagram A Modern Effective Data Visualization Template for Business Presentations. This vibrant bar chart infographic is a powerful tool for communicating complex data in a clear and engaging way. Ideal for business presentations, reports, and marketing materials, this visually appealing design highlights key performance indicators and trends. The clean, modern aesthetic ensures your message stands out, while the colorful bars and clear labels make understanding the statistics
Free with trial Stock market is on sale, finance manager pointing at most reduced with deal sticker price on securities exchange diagram. Sales decrease vectors Stock market is on sale, finance manager pointing at most reduced with deal sticker price on securities exchange diagram
Free with trial Digital tablet icon displaying a bar chart with a downward trend arrow and percentage sign, indicating decline or loss. Sales decrease vectors Digital tablet icon displaying a bar chart with a downward trend arrow and percentage sign, indicating decline or loss
Free with trial A vibrant infographic visualizes global consumption trends using circular graphs and colorful gradients This modern data visualization effectively presents worldwide consumption patterns, highlighting key insights for business analysis, market research, and economic reporting Ideal for presentations and publications, its design ensures easy data comprehension AI Generative. Sales decrease illustrations Abstract Infographic Global Consumption Trends Visualization with Circular Graphs and Colorful Gradients Modern Data Visualization. A vibrant infographic visualizes global consumption trends using circular graphs and colorful gradients This modern data visualization effectively presents worldwide consumption patterns, highlighting key insights for business analysis, market research, and economic reporting Ideal for presentations and publications, its design ensures easy data comprehension AI Generative
Free with trial Abstract red background, black graph line, decline, instability, financial crisis. Symbolizes risk, uncertainty, downward trend. Can be used for display or montage your products. Generative AI. Sales decrease illustrations Red Market Trend Abstract red background black graph line decline instability financial crisis Symbolizes risk uncertainty. Abstract red background, black graph line, decline, instability, financial crisis. Symbolizes risk, uncertainty, downward trend. Can be used for display or montage your products. Generative AI
Free with trial Data funnel filtering process showing percentage drop in prices or conversion rate on isolated black and white design. AI generated. Sales decrease vectors Data funnel filtering process showing percentage drop in prices or conversion rate on isolated black and white design. AI generated
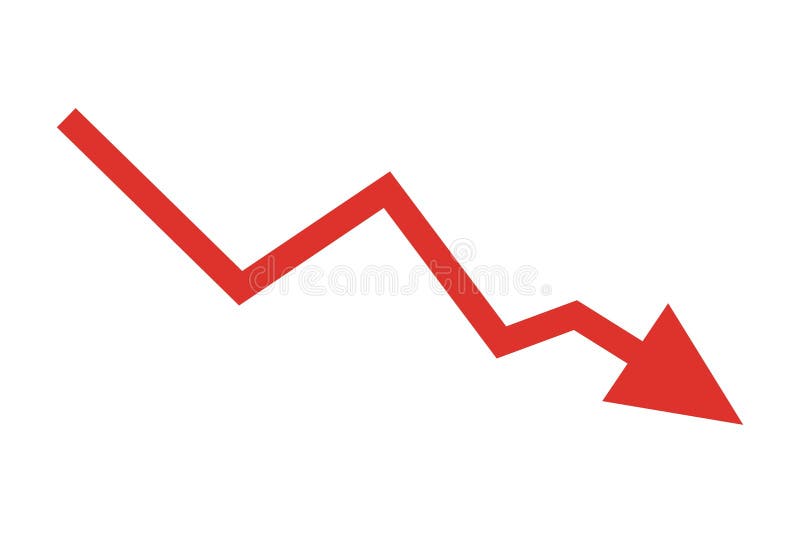
Free with trial This vibrant red downward arrow graphic is perfectly isolated against a clean white background, making it ideal for various visual communication applications. The sharp, defined lines and bold color create a striking and impactful directional symbol, perfect for highlighting downward trends, discounts, or calls to action. Its simple, yet powerful design makes it suitable for use in presentations. Sales decrease illustrations Red Downward Arrow Icon Isolated on White Background Downloadable Stock Photo for Presentations Websites and Graphic. This vibrant red downward arrow graphic is perfectly isolated against a clean white background, making it ideal for various visual communication applications. The sharp, defined lines and bold color create a striking and impactful directional symbol, perfect for highlighting downward trends, discounts, or calls to action. Its simple, yet powerful design makes it suitable for use in presentations
Free with trial Wooden blocks stacked coins illustrate rising inflation and economic growth concept economy. Sales decrease illustrations Rising Inflation Economic Growth Financial Crisis Concept Wooden Blocks Stacked Coins Business Chart Graph red risk cost. Wooden blocks stacked coins illustrate rising inflation and economic growth concept economy
Free with trial Shopping cart with red downward arrow illustrating consumer spending drop and economic concern on turquoise background. Sales decrease illustrations Shopping cart with red downward arrow illustrating consumer spending drop and economic concern on turquoise background
Free with trial Colorful 3D bar chart illustration on blue background with red, orange, yellow, turquoise bars. Simple, clean geometric shapes represent statistics, business data for reports. Sales decrease illustrations Colorful 3D bar chart illustration on blue background with red, orange, yellow, turquoise bars. Simple, clean geometric shapes
Free with trial 3D Illustration Business Graph Chart Growth Success Analysis Finance Investment Strategy Data Market Stock Economy Trading Financial Progress Report. Sales decrease illustrations 3D Illustration Business Graph Chart Growth Success Analysis Finance Investment Strategy Data Market Stock Economy Trading
Free with trial Reduction chart icon vector icon on white background. EPS10. Sales decrease vectors Reduction chartline in Thin line black color. flat simple vector symbols illustration. Reduction chart icon vector icon on white background. EPS10
Free with trial Reduction chart icon vector icon on white background. EPS10. Sales decrease vectors Reduction chartline in Thin line black color. flat simple vector symbols illustration. Reduction chart icon vector icon on white background. EPS10
Free with trial Reduction chart icon vector icon on white background. EPS10. Sales decrease vectors Reduction chartline in Thin line black color. flat simple vector symbols illustration. Reduction chart icon vector icon on white background. EPS10
Free with trial Reduction chart icon vector icon on white background. EPS10. Sales decrease vectors Reduction chartline in Thin line black color. flat simple vector symbols illustration. Reduction chart icon vector icon on white background. EPS10
Free with trial Reduction chart icon vector icon on white background. EPS10. Sales decrease vectors Reduction chartline in Thin line black color. flat simple vector symbols illustration. Reduction chart icon vector icon on white background. EPS10
Free with trial Reduction chart icon vector icon on white background. EPS10. Sales decrease vectors Reduction chartline in Thin line black color. flat simple vector symbols illustration. Reduction chart icon vector icon on white background. EPS10
Free with trial Reduction chart icon vector icon on white background. EPS10. Sales decrease vectors Reduction chartline in Thin line black color. flat simple vector symbols illustration. Reduction chart icon vector icon on white background. EPS10
Free with trial Reduction chart icon vector icon on white background. EPS10. Sales decrease vectors Reduction chartline in Thin line black color. flat simple vector symbols illustration. Reduction chart icon vector icon on white background. EPS10
Free with trial Reduction chart icon vector icon on white background. EPS10. Sales decrease vectors Reduction chartline in Thin line black color. flat simple vector symbols illustration. Reduction chart icon vector icon on white background. EPS10
Free with trial Closeup view of a pen resting on graph, suggesting data analysis or business planning ,Generative AI. Sales decrease illustrations Detailed view of a pen placed on graph, depicting financial analysis, business planning, and data interpretation for strategic. Closeup view of a pen resting on graph, suggesting data analysis or business planning ,Generative AI
Free with trial Declining bar graph illustration showing negative trend of business or economic recession or market crash with downward arrow. Sales decrease vectors Declining bar graph illustration showing negative trend of business or economic recession or market crash with downward arrow
Free with trial Red arrow going down stock icon on white background. Bankruptcy, financial market crash icon for your web site design, logo, app, UI. graph chart down trend symbol. chart going down sign. Sales decrease vectors Red arrow going down stock icon on white background. Bankruptcy, financial market crash icon for your web site design
Free with trial Red arrow going down stock icon on white background. Bankruptcy, financial market crash icon for your web site design, logo, app, UI. graph chart down trend symbol. chart going down sign. Sales decrease vectors Red arrow going down stock icon on white background. Bankruptcy, financial market crash icon for your web site design
Free with trial Cost reduction chart displayed on a mobile phone held by a person in a suit shows a downward trend representing financial analysis business strategy and investment planning for economic forecasting d. Sales decrease illustrations Cost reduction chart financial analysis business strategy investment planning market trend economic forecast data. Cost reduction chart displayed on a mobile phone held by a person in a suit shows a downward trend representing financial analysis business strategy and investment planning for economic forecasting d
Free with trial Cost reduction chart displayed on a mobile device held by a hand shows a declining trend representing financial analysis business strategy and investment planning indicating potential market downturn. Sales decrease illustrations Cost reduction chart financial analysis business strategy investment planning market trend economic forecast data. Cost reduction chart displayed on a mobile device held by a hand shows a declining trend representing financial analysis business strategy and investment planning indicating potential market downturn
Free with trial Simple black arrow points down on plain white background. Minimalist design suggests direction. Illustration suitable for graphic design projects, business presentations tech. Sales decrease illustrations Simple black arrow points down on plain white background. Minimalist design suggests direction. Illustration suitable for graphic
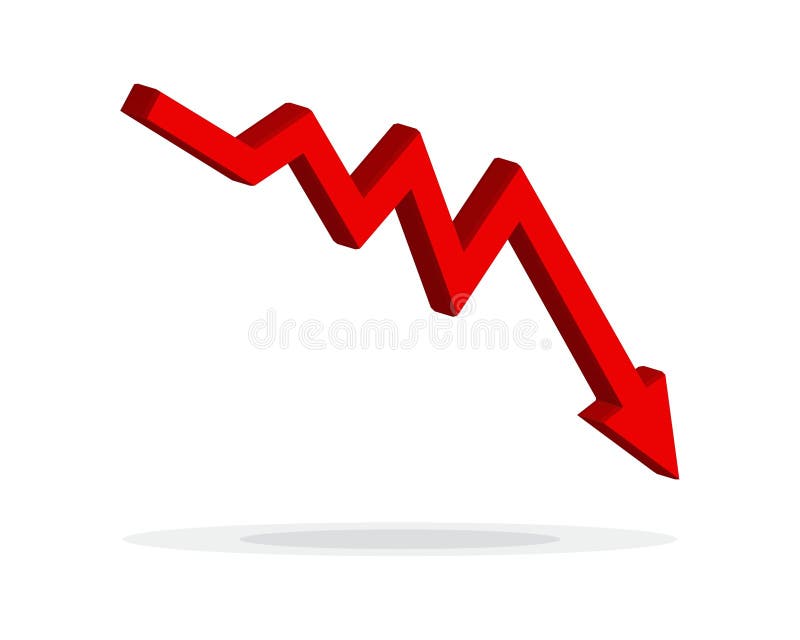
Free with trial Red 3d arrow going down stock icon on white background. Bankruptcy, financial market crash icon for your web site design, logo, app, UI. graph chart downtrend symbol. chart going down sign. Sales decrease vectors Red 3d arrow going down stock icon on white background. Bankruptcy, financial market crash icon for your web site design. Red 3d arrow going down stock icon on white background. Bankruptcy, financial market crash icon for your web site design, logo, app, UI. graph chart downtrend symbol.chart going down sign.
Free with trial Red 3d arrow going down stock icon on white background. Bankruptcy, financial market crash icon for your web site design, logo, app, UI. graph chart downtrend symbol. chart going down sign. Sales decrease vectors Red 3d arrow going down stock icon on white background. Bankruptcy, financial market crash icon for your web site design. Red 3d arrow going down stock icon on white background. Bankruptcy, financial market crash icon for your web site design, logo, app, UI. graph chart downtrend symbol.chart going down sign.
Free with trial Red 3d arrow going down stock icon on white background. Bankruptcy, financial market crash icon for your web site design, logo, app, UI. graph chart downtrend symbol. chart going down sign. Sales decrease vectors Red 3d arrow going down stock icon on white background. Bankruptcy, financial market crash icon for your web site design
Free with trial Red 3d arrow going down stock icon on white background. Bankruptcy, financial market crash icon for your web site design, logo, app, UI. graph chart downtrend symbol. chart going down sign. Sales decrease vectors Red 3d arrow going down stock icon on white background. Bankruptcy, financial market crash icon for your web site design. Red 3d arrow going down stock icon on white background. Bankruptcy, financial market crash icon for your web site design, logo, app, UI. graph chart downtrend symbol.chart going down sign.
Free with trial Red 3d arrow going down stock icon on white background. Bankruptcy, financial market crash icon for your web site design, logo, app, UI. graph chart downtrend symbol. chart going down sign. Sales decrease vectors Red 3d arrow going down stock icon on white background. Bankruptcy, financial market crash icon for your web site design. Red 3d arrow going down stock icon on white background. Bankruptcy, financial market crash icon for your web site design, logo, app, UI. graph chart downtrend symbol.chart going down sign.
Free with trial Wooden cubes with TSA, tax sheltered annuary text. Financial, Management, Economic. close up of wooden cubes,Business Concept. 3D rendering on orange background. Sales decrease illustrations Wooden cubes with TSA, tax sheltered annuary text. Financial, Management, Economic.close up of wooden cubes
Free with trial Colorful line graph showing growth and decline of different data from 2018, 2019 and 2020, providing a visual representation of performance trends over time. Sales decrease vectors Colorful line graph showing growth and decline of different data from 2018, 2019 and 2020, providing a visual
Free with trial Reduction chart icon isolated on white background. Eps 10. Sales decrease vectors Reduction Chart Icon Set. Downward graph vector symbol in a black filled and outlined style. Decline Trend Sign. Reduction chart icon isolated on white background. Eps 10
Free with trial Charts and diagrams icon collection. Duotone color. Vector illustration. Containing graphic, infographic, graph, pie chart, graphs, bar chart, circular diagram, diagram, decrease, increase, with three design. Sales decrease vectors Economics strategy, analysis of sales, statistic, data statistic illustration set or collection for banner, landing web page. Charts and diagrams icon collection. Duotone color. Vector illustration. Containing graphic, infographic, graph, pie chart, graphs, bar chart, circular diagram, diagram, decrease, increase, with three design
Free with trial Charts and diagrams icon collection. Duotone color. Vector illustration. Containing graphic, infographic, graph, pie chart, graphs, bar chart, circular diagram, diagram, decrease, increase, with three design. Sales decrease vectors Economics strategy, analysis of sales, statistic, data statistic illustration set or collection for banner, landing web page. Charts and diagrams icon collection. Duotone color. Vector illustration. Containing graphic, infographic, graph, pie chart, graphs, bar chart, circular diagram, diagram, decrease, increase, with three design
Free with trial Charts and diagrams icon collection. Duotone color. Vector illustration. Containing graphic, infographic, graph, pie chart, graphs, bar chart, circular diagram, diagram, decrease, increase, with three design. Sales decrease vectors Economics strategy, analysis of sales, statistic, data statistic illustration set or collection for banner, landing web page. Charts and diagrams icon collection. Duotone color. Vector illustration. Containing graphic, infographic, graph, pie chart, graphs, bar chart, circular diagram, diagram, decrease, increase, with three design
Free with trial Charts and diagrams icon collection. Duotone color. Vector illustration. Containing graphic, infographic, graph, pie chart, graphs, bar chart, circular diagram, diagram, decrease, increase, with three design. Sales decrease vectors Economics strategy, analysis of sales, statistic, data statistic illustration set or collection for banner, landing web page. Charts and diagrams icon collection. Duotone color. Vector illustration. Containing graphic, infographic, graph, pie chart, graphs, bar chart, circular diagram, diagram, decrease, increase, with three design
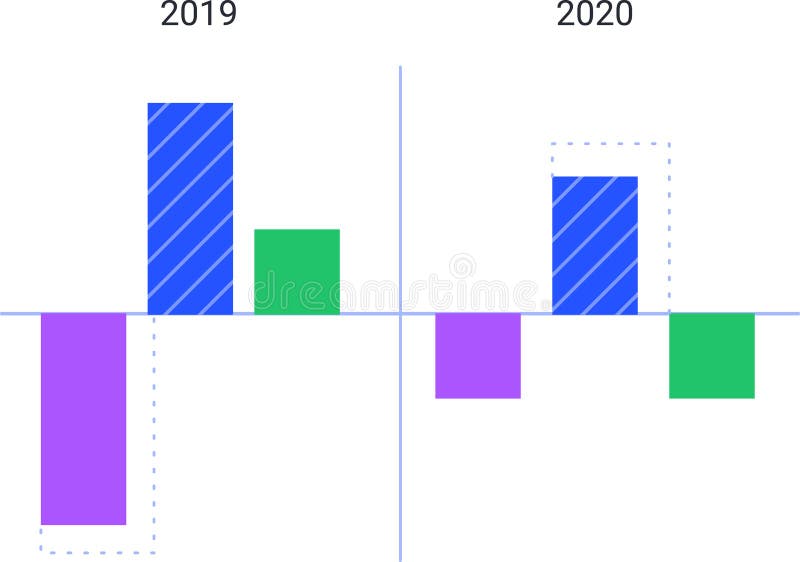
Free with trial Colorful bar charts are comparing data from 2019 and 2020, visualizing trends and statistics with positive and negative values represented by upward and downward bars. Sales decrease vectors Colorful bar charts are comparing data from 2019 and 2020, visualizing trends and statistics with positive and negative
Free with trial Colorful bar charts are comparing data from 2019 and 2020, visualizing trends and statistics with positive and negative values represented by upward and downward bars. Sales decrease illustrations Colorful bar charts are comparing data from 2019 and 2020, visualizing trends and statistics with positive and negative
Free with trial Job ID: fba8760d-e973-412d-9011-a0e8d72a93ed. Sales decrease illustrations Colorful Bar Graph with Flags: Abstract Representation of Data and Trends. Job ID: fba8760d-e973-412d-9011-a0e8d72a93ed
Free with trial Botswana oil industry concept, industrial illustration - lowering down chart on Botswana flag background. 3D Illustration. Sales decrease illustrations Lowering down chart on Botswana flag background - industrial illustration of Botswana oil industry or market concept. 3D. Botswana oil industry concept, industrial illustration - lowering down chart on Botswana flag background. 3D Illustration
Free with trial Barbados oil industry concept, industrial illustration - lowering down chart on Barbados flag background. 3D Illustration. Sales decrease illustrations Lowering down chart on Barbados flag background - industrial illustration of Barbados oil industry or market concept. 3D. Barbados oil industry concept, industrial illustration - lowering down chart on Barbados flag background. 3D Illustration
Free with trial Decrease icon vector from sales concept. Thin line illustration of decrease editable stroke. decrease linear sign for use on web and mobile apps, logo, print media. Sales decrease vectors Decrease icon vector from sales concept. Thin line illustration of decrease editable stroke. decrease linear sign for use on web
Free with trial Decrease icon vector from sales concept. Thin line illustration of decrease editable stroke. decrease linear sign for use on web and mobile apps, logo, print media. Sales decrease vectors Decrease icon vector from sales concept. Thin line illustration of decrease editable stroke. decrease linear sign for use on web
Free with trial Sales line icons. linear set. quality vector line set such as sale, low prices, sale, targeted marketing, decrease, analytics, sale, dollar. Sales decrease vectors Sales line icons. linear set. quality vector line set such as sale, low prices, sale, targeted marketing, decrease, analytics
Free with trial Beautiful, meticulously designed Sales decrease report icon. Sales decrease vectors Sales decrease report icon
Free with trial Sales line icons. linear set. quality vector line set such as online sales, decrease, sale. Sales decrease vectors Sales line icons. linear set. quality vector line set such as online sales, decrease, sale
Free with trial Vector illustration of sales increase and decrease data, data analysis, sales statistics, businessman, presentation. Sales decrease vectors Vector illustration of sales increase and decrease data, data analysis, sales statistics
Free with trial Sales line icons. linear set. quality vector line set such as sale, decrease, sale, vase, sale, law, discount. Sales decrease vectors Sales line icons. linear set. quality vector line set such as sale, decrease, sale, vase, sale, law, discount
Free with trial Sales line icons. linear set. quality vector line set such as analytics, exchange, sales, sale, movie, sales, sale, decrease, percentage. Sales decrease vectors Sales line icons. linear set. quality vector line set such as analytics, exchange, sales, sale, movie, sales, sale, decrease
Free with trial Sales line icons. linear set. quality vector line set such as sale, remove from cart, sale, vase, contactless, decrease, increase, marketing. Sales decrease vectors Sales line icons. linear set. quality vector line set such as sale, remove from cart, sale, vase, contactless, decrease, increase
Free with trial Illustration of decreasing grow sales. Sales decrease vectors Sales decrease. Illustration of decreasing grow sales
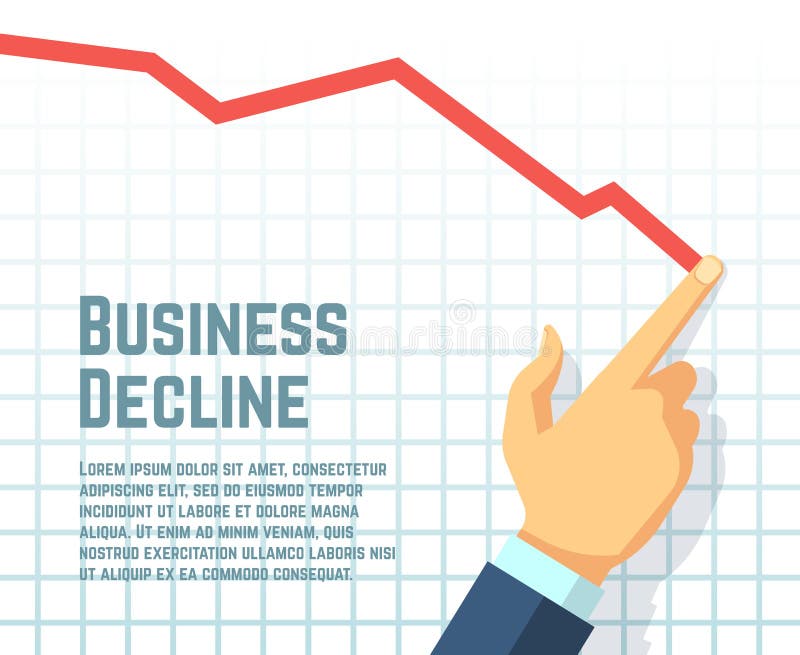
Free with trial Businessmans hand drawing decrease graph. Profit decline and downward sales business vector concept. Business graph and chart, finance decrease diagram, financial bankruptcy illustration. Sales decrease vectors Businessmans hand drawing decrease graph. Profit decline and downward sales business vector concept
Free with trial Sales decrease Lower than the target , vector illustration business cartoon concept. Sales decrease vectors Sales decrease Lower than the target
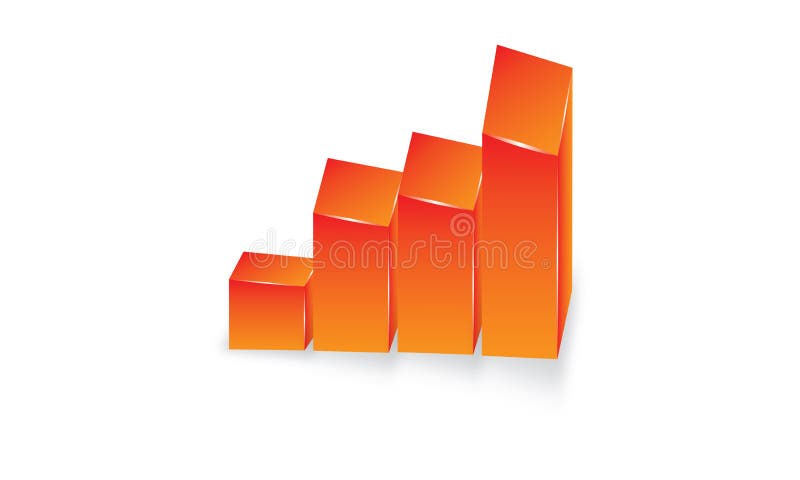
Free with trial 3d colorful bar chart increase decrease sales or purchase diagram. statistic information chart diagrams. Sales decrease vectors 3D Vector Colorful Increase Decrease Bar Chart Diagram. 3d colorful bar chart increase decrease sales or purchase diagram . statistic information chart diagrams
Free with trial Website with financial decrease statistics line icon. linear style sign for mobile concept and web design. Online sales decrease graph outline vector icon. Symbol, logo illustration. Vector graphics. Sales decrease vectors Website with financial decrease statistics line icon
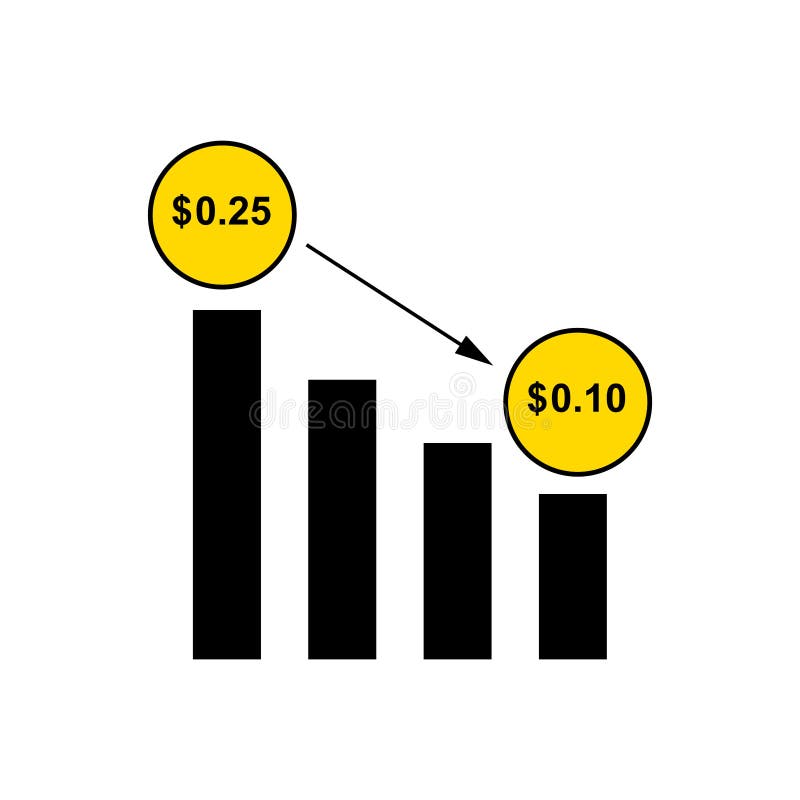
Free with trial Vector illustration of a decrease in sales price from $ 0. 25 to $ 0. 10. Sales decrease vectors Illustration of a decrease in sales price
Free with trial Sad businessman because decrease sales presentation report on whiteboard. business finance crisis concept. lost crisis bankrupt declining. cost reduction. loss of income. vector illustration. Sales decrease vectors Sad businessman because decrease sales presentation report on whiteboard. business finance crisis concept. lost crisis bankrupt
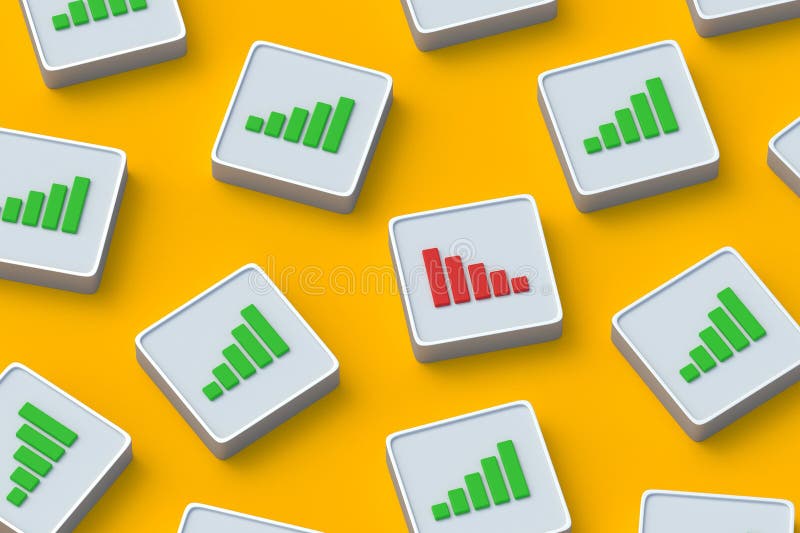
Free with trial Decrease in sales. Statistical data. Negative report. Investment analysis. Risk assessment. Reduced efficiency. Financial crisis concept. Red declining graph among green on buttons. 3d render. Sales decrease illustrations Decrease in sales. Statistical data. Negative report. Investment analysis
Free with trial A downward stock market trend. Chart decrease graph. Sales chart report. Stock Market Trend. Sales decrease vectors Chart decrease graph.Sales chart report.Stock Market Trend.
Free with trial Website with financial decrease statistics vector icon. filled flat sign for mobile concept and web design. Online sales decrease graph glyph icon. Symbol, logo illustration. Vector graphics. Sales decrease vectors Website with financial decrease statistics vector icon
Free with trial Increase and decrease in prices on money and commodity goods. money trading to determine percentage of currency, concept vector illustration. can use for ui, web, mobile app, poster, banner, website, can be used for various businesses, needs and uses ranging from sales marketing advertisements and others. can also be used for UI ux presentation banners, poster documents, mobile web websites apps, applications, flayer. and can be used for print and online needs. Sales decrease vectors Increase and decrease in prices on money and commodity goods. money trading to determine percentage of currency, concept vector il
Free with trial Word "RISK" on decrease business graph step, finance diagram with down arrows on white blocks on red background. Financial crisis, bankruptcy, loss investment economic recession sales risk concepts. Sales decrease illustrations Word \'RISK\' on decrease business graph step, finance diagram with down arrows on white blocks on red background. Word "RISK" on decrease business graph step, finance diagram with down arrows on white blocks on red background. Financial crisis, bankruptcy, loss investment economic recession sales risk concepts.
Free with trial A downward stock market trend. Chart decrease graph. Sales chart report. Stock Market Trend. Sales decrease vectors Chart decrease graph.Sales chart report.Stock Market Trend.
Free with trial Set line Data analysis Financial growth Folder and lock decrease Sales funnel with chart Cloud shield and Server icon. Vector. Sales decrease vectors Set line Data analysis, Financial growth, Folder and lock, decrease, Sales funnel with chart, Cloud shield and Server
Free with trial Set Coal mine trolley Server Cloud download and upload Pie chart infographic Financial growth decrease Sales funnel with Data analysis and icon. Vector. Sales decrease vectors Set Coal mine trolley, Server, Cloud download and upload, Pie chart infographic, Financial growth decrease, Sales funnel. Set Coal mine trolley Server Cloud download and upload Pie chart infographic Financial growth decrease Sales funnel with Data analysis and icon. Vector.
Free with trial A downward stock market trend. Chart decrease graph. Sales chart report. Stock Market Trend. Sales decrease vectors Chart decrease graph.Sales chart report.Stock Market Trend.
Free with trial Set Financial growth Data analysis Sales funnel with chart Server security padlock decrease Search data and icon. Vector. Sales decrease vectors Set Financial growth, Data analysis, Sales funnel with chart, Server security padlock, decrease, Search data and icon
Free with trial A downward stock market trend. Chart decrease graph. Sales chart report. Stock Market Trend. Sales decrease vectors Chart decrease graph.Sales chart report.Stock Market Trend.
Free with trial Set Financial growth decrease, Sales funnel with chart, Pie infographic and Mind map icon. Vector. Sales decrease vectors Set Financial growth decrease, Sales funnel with chart, Pie infographic and Mind map icon. Vector