Free with trial Colorful crisis financial bar diagram with red arrow down 3d. Sales decrease illustrations Colorful crisis financial bar diagram with red arrow down
Free with trial Blue arrow chart drop as symbol of decline and economic recession. Sales decrease illustrations Blue arrow chart drop as symbol of financial crisis. Blue arrow chart drop as symbol of decline and economic recession
Free with trial Two broken trend lines with arrows are going up and down, 3d illustration with cloudy sky photo background. Sales decrease illustrations Two trend lines with arrows are going up and down. Two broken trend lines with arrows are going up and down, 3d illustration with cloudy sky photo background
Free with trial Crisis in the money market/business market - isolated diagram (with vector EPS format). Sales decrease vectors Crisis in the money market/business market
Free with trial Stock market quotes graph chart loss crisis. Sales decrease illustrations Stock market quotes graph loss crisis.
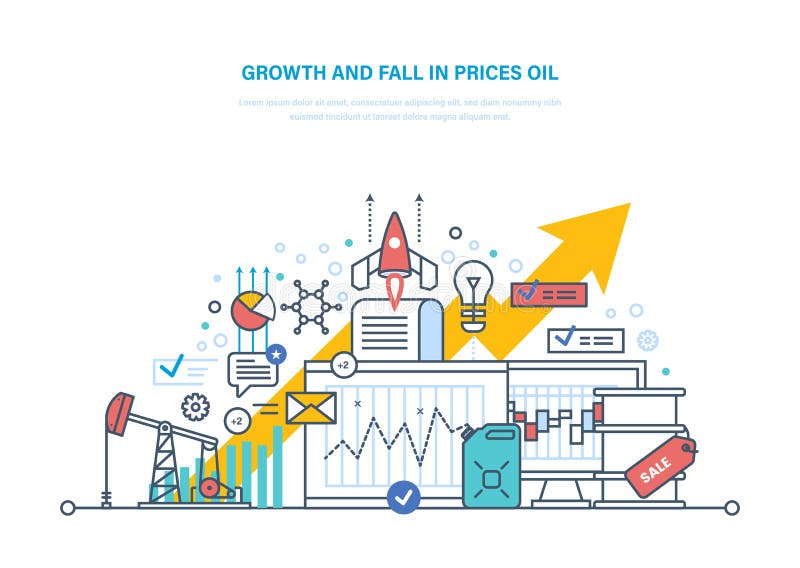
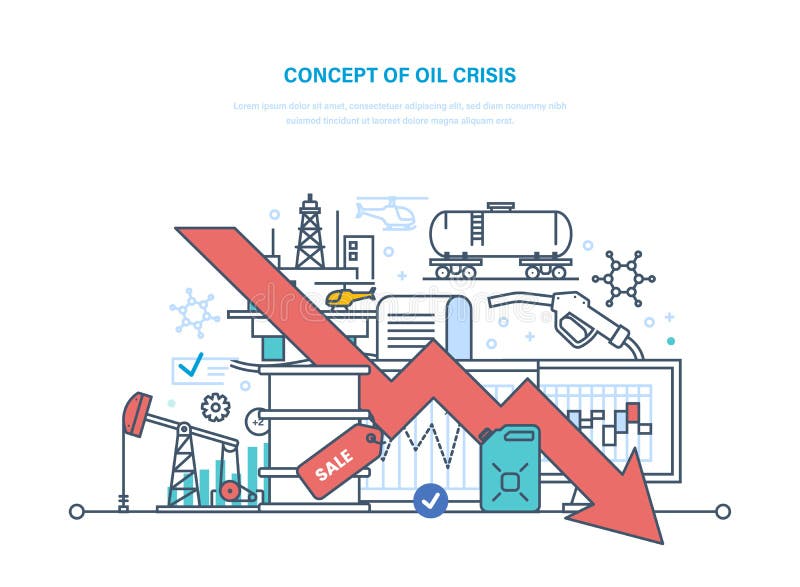
Free with trial Concept of oil crisis. Dynamics growth and fall in prices oil, sale. Oil industry, pipe, gasoline tank, industrial plant. Extraction and transportation of resources. Illustration thin line design. Sales decrease vectors Oil crisis. Dynamics growth and fall in prices oil, sale.
Free with trial Concept of oil crisis. Oil industry, pipe, gasoline tank, industrial plant. Extraction and transportation of resources. Dynamics rise and fall prices, sale. Illustration thin line design. Sales decrease vectors Concept of oil crisis. Dynamics rise and fall prices, sale. Concept of oil crisis. Oil industry, pipe, gasoline tank, industrial plant. Extraction and transportation of resources. Dynamics rise and fall prices, sale. Illustration thin line design.
Free with trial Stat bars and falling arrow showing a downward trend. 3D illustration. Sales decrease illustrations Stat bars and falling arrow showing a downward trend. 3D illustration
Free with trial A computer generated illustration image of a three dimensional view of a chart with colorful bars against a white backdrop. Sales decrease illustrations A three dimensional view of a chart with colorful bars
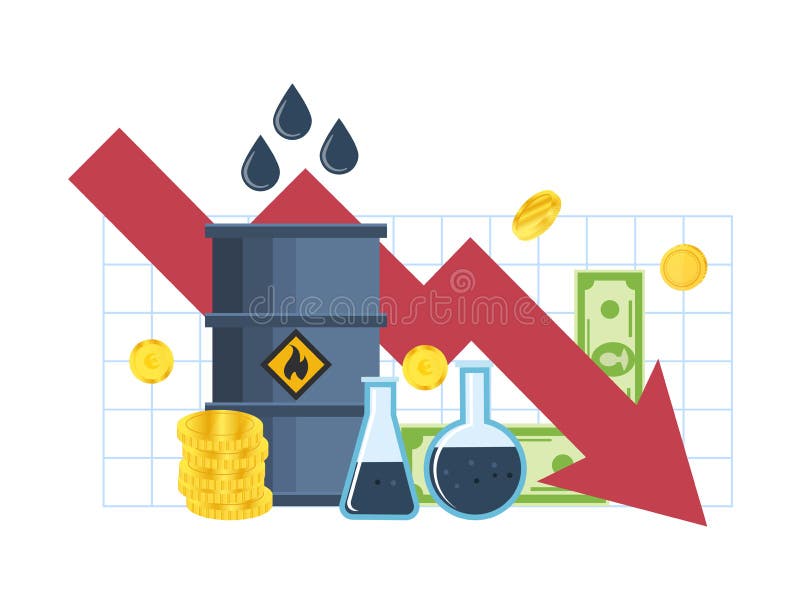
Free with trial Concept of the crisis, the drop in incomes and profits, fall in the cost of oil. Fall in prices for gasoline and oil, trading pricing courses, investments, management. Vector illustration isolated. Sales decrease vectors Crisis, drop in incomes, profits, fall in cost of oil. Concept of the crisis, the drop in incomes and profits, fall in the cost of oil. Fall in prices for gasoline and oil, trading pricing courses, investments, management. Vector illustration isolated.
Free with trial Vector decreasing red pencils on the chart. Sales decrease vectors Vector decreasing chart. Vector decreasing red pencils on the chart
Free with trial Chart with donwards arrow over a map of Asia. Sales decrease illustrations Chart Asia down. Chart with donwards arrow over a map of Asia
Free with trial Arrow Falling On Smartphone Shows Risky Investments Or Financial Troubles. Sales decrease illustrations Arrow Falling On Smartphone Shows Risky Investments
Free with trial 3D decreasing red arrow on the chart. Sales decrease illustrations Decreasing red arrow on the chart
Free with trial Graph going up and down sign isolated vector illustration on white background. Sales decrease vectors Graph going up and down sign isolated vector illustration. Graph going up and down sign isolated vector illustration on white background
Free with trial Continuous one line drawing of up and down arrows. Minimalist vector illustration of business growth graph symbol. Single line art icon representing increase and decrease trends. Sales decrease vectors Continuous one line drawing of up and down arrows. Minimalist vector illustration of business growth graph symbol. Single line art. Icon representing increase
Free with trial Broken trend line with arrow on the end is going down, 3d illustration with cloudy sky photo background. Sales decrease illustrations Broken trend line with arrow on the end is going down
Free with trial Chart graph. Black Icon growth and downward with arrow isolated on background. Hologram positive, fall percentage. Design business concept direction growth, recession. Analysis. Vector illustration. Sales decrease vectors Chart graph. Black Icon growth and downward with arrow. Hologram positive, fall percentage. Design business. Vector illustration. Chart graph. Black Icon growth and downward with arrow isolated on background. Hologram positive, fall percentage. Design business concept direction growth, recession. Analysis. Vector illustration
Free with trial Crisis concept - graph falls down and businessman is falling. Sales decrease vectors Graph falls down
Free with trial Unhappy businessman hold arrow facing down distressed with business crisis or failure. Upset stressed man CEO frustrated with economic recession. Bankruptcy concept. Flat vector illustration. Sales decrease vectors Unhappy businessman stressed with business crisis. Unhappy businessman hold arrow facing down distressed with business crisis or failure. Upset stressed man CEO frustrated with economic recession. Bankruptcy concept. Flat vector illustration.
Free with trial Researching the market: positive and negative graphs under zoom, isolated on white. Sales decrease illustrations Researching: positive and negative graphs. Researching the market: positive and negative graphs under zoom, isolated on white
Free with trial Businessman design of computer web design and office. Sales decrease vectors Businessman design
Free with trial Icon pile of cash red recession graph with downward arrow. Green dollar and gold coins. Vector illustration. Sales decrease illustrations Icon pile of cash red recession graph with downward arrow. Green dollar and gold coins. Vector illustration
Free with trial A sad asian guy raising his two arms surrendering causing of his failed business. Graph arrow down, shares fall. Unsuccessful business concept. A contemporary style with pastel palette soft blue tinted background. Vector flat design illustration. Horizontal layout with text space in right side. Sales decrease vectors Guy raising his arms with arrow down graph. A sad asian guy raising his two arms surrendering causing of his failed business. Graph arrow down, shares fall. Unsuccessful business concept. A contemporary style with pastel palette soft blue tinted background. Vector flat design illustration. Horizontal layout with text space in right side.
Free with trial Falling chart icon on white background. flat style. falling chart icon for your web site design, logo, app, UI. falling arrow chart symbol. Declining bar chart sign. Sales decrease illustrations Falling chart icon on white background. flat style. falling chart icon for your web site design, logo, app, UI. falling arrow
Free with trial Cartoon businessman of computer web design and office. Sales decrease vectors Cartoon businessman
Free with trial Cartoon businessman of computer web design and office. Sales decrease vectors Cartoon businessman
Free with trial Two broken trend lines with arrows are going up and down, 3d illustration on white background. Sales decrease illustrations Two broken trend lines are going up and down. Two broken trend lines with arrows are going up and down, 3d illustration on white background
Free with trial Red Graph moving down on chart as recession or financial crisis 3d render, illustration. Sales decrease illustrations Red Graph moving down on chart as recession or financial crisis
Free with trial Cartoon businessman of computer web design and office. Sales decrease vectors Cartoon businessman
Free with trial Cartoon pencil work of computer web design and office. Sales decrease vectors Cartoon pencil work
Free with trial German tax cut on value-added tax VAT. 3D render of 16 percent symbol. Sales decrease illustrations Duty and taxes. German tax cut on value-added tax VAT. 3D render of 16 percent symbol
Free with trial Punisher hand of computer web design and office. Sales decrease vectors Punisher hand
Free with trial The graph shows the fall and profits decline. Loss of points Currency. Falling through asset outflows. Red background. dollar symbol. minimal. Outline. Sales decrease vectors Loss of points Currency
Free with trial Vector illustration. Investment management, the company is engaged in joint problem solving, sales decline, downward decline. Sales decrease vectors Vector illustration. Investment management
Free with trial Decline Graph, Chart with bars declining, Chart icon on white background. Sales decrease vectors Decline Graph, Chart with bars declining, Chart icon
Free with trial Chart with downwards arrow over a map of Africa. Sales decrease illustrations Chart Africa down. Chart with downwards arrow over a map of Africa
Free with trial Cartoon businessman of computer web design and office. Sales decrease vectors Cartoon businessman
Free with trial Cartoon businessman of computer web design and office. Sales decrease vectors Cartoon businessman
Free with trial Cartoon businessman of computer web design and office. Sales decrease vectors Cartoon businessman
Free with trial Vector illustration. Investment management, the company is engaged in joint problem solving, sales decline, downward decline. Sales decrease vectors Vector illustration. Investment management
Free with trial Business positive arrow vector graph, set colorful. Sales decrease vectors Business positive arrow vector graph
Free with trial Distressed man in stack of money hold arrow facing down frustrated with business problems and failures. Unhappy businessman experience company financial crisis or bankruptcy. Vector illustration. Sales decrease vectors Unhappy businessman hold arrow facing down. Distressed man in stack of money hold arrow facing down frustrated with business problems and failures. Unhappy businessman experience company financial crisis or bankruptcy. Vector illustration.
Free with trial Red Graph moving down on chart as recession or financial crisis 3d render, illustration. Sales decrease illustrations Red Graph moving down on chart as recession or financial crisis
Free with trial Chart with bars declining on white background. Chart icon. chart icon for your web site design, logo, app, UI. flat style. Sales decrease vectors Chart with bars declining on white background. Chart icon. chart icon for your web site design, logo, app, UI. flat style
Free with trial Negative trend. Declining graph, red arrow Vector illustration. Sales decrease vectors Negative trend icon. Negative trend. Declining graph, red arrow Vector illustration
Free with trial Cartoon businessman of computer web design and office. Sales decrease vectors Cartoon businessman
Free with trial Cartoon businessman of computer web design and office. Sales decrease vectors Cartoon businessman
Free with trial Cartoon businessman of computer web design and office. Sales decrease vectors Cartoon businessman
Free with trial Covid19 coronavirus global economy downfall arrow background vector. Sales decrease vectors Covid19 coronavirus global economy downfall arrow background
Free with trial Cartoon businessman of computer web design and office. Sales decrease vectors Cartoon businessman
Free with trial Red 3d arrow going down stock icon on white background. Bankruptcy, financial market crash icon for your web site design, logo, app, UI. graph chart downtrend symbol. chart going down sign. Sales decrease vectors Red 3d arrow going down stock icon on white background. Bankruptcy, financial market crash icon
Free with trial Two lines are representing increasing and declining trends over a grid background, symbolizing market analysis, financial performance, or business progress. Sales decrease vectors Two lines are representing increasing and declining trends over a grid background, symbolizing market analysis
Free with trial Reduction symbol of background, 3d render. Sales decrease illustrations Reduction symbol of background, 3d
Free with trial UK. London Stock Exchange market crisis red market price down chart fall / Stock analysis or forex charts graph Business and finance money crisis background red negative drop in sales economic fall. Sales decrease illustrations UK. London Stock Exchange market crisis red market price down chart fall Business and finance money crisis background red negative. UK. London Stock Exchange market crisis red market price down chart fall / Stock analysis or forex charts graph Business and finance money crisis background red negative drop in sales economic fall
Free with trial Decline Graph, Chart with bars declining, Chart icon on white background. Sales decrease vectors Decline Graph, Chart with bars declining, Chart icon
Free with trial Decline chart icon isolated on dark background. Simple vector logo. Sales decrease vectors Decline chart icon isolated on dark background
Free with trial The growth and decline concept with businessmen. Sales decrease illustrations The growth and decline concept with businessmen
Free with trial Growth graph, business decline graph or diagram with arrow up, down icon design black symbol isolated on white background. Vector EPS 10. Sales decrease vectors Growth graph, business decline graph or diagram with arrow up, down icon design black symbol isolated on white background. Vector
Free with trial Decreasing stocks bars graphic icon in trendy design style. decreasing stocks bars graphic icon isolated on white background. decreasing stocks bars graphic vector icon simple and modern flat symbol. Sales decrease vectors Decreasing stocks bars graphic icon in trendy design style. decreasing stocks bars graphic icon isolated on white background.
Free with trial Money loss. Cash with down arrow stocks graph, concept of financial crisis, market fall, bankruptcy. Vector stock illustration. Sales decrease vectors Money loss. Cash with down arrow stocks graph, concept of financial crisis, market fall, bankruptcy. Vector stock
Free with trial Like, Update data and Graph chart icons simple set. Halftone dots button. Customisation sign. Social media likes, Sales chart, Growth report. Settings. Technology set. Classic flat like icon. Vector. Sales decrease vectors Like, Update data and Graph chart icons set. Customisation sign. Vector. Like, Update data and Graph chart icons simple set. Halftone dots button. Customisation sign. Social media likes, Sales chart, Growth report. Settings. Technology set. Classic flat like icon. Vector
Free with trial Linear finances statistics descending bars graphic icon from Business outline collection. Thin line finances statistics descending bars graphic icon. Sales decrease vectors Linear finances statistics descending bars graphic icon from Business outline collection. Thin line finances statistics descending
Free with trial Fixed costs symbol with a dollar symbol in a padlock on a balance scale. Easy to use for your website or presentation. Sales decrease vectors Fixed costs symbol with a dollar symbol in a padlock on a balance scale
Free with trial Trend down isolated icon. Business graph line vector icon for websites and mobile 3d design. Sales decrease vectors Trend down isolated icon. Business graph line vector icon for websites and mobile 3d design.
Free with trial Rocket business of computer web design and office. Sales decrease vectors Rocket business
Free with trial Bars descending graph vector line icon, sign, illustration on white background, editable strokes. Sales decrease vectors Bars descending graph vector line icon, sign, illustration on background, editable strokes
Free with trial Covid-19 or Corona virus on ecomonic impacts. 3d rendering. Sales decrease illustrations Covid-19 or Corona virus on ecomonic impacts
Free with trial Cartoon businessman of computer web design and office. Sales decrease vectors Cartoon businessman
Free with trial Bar chart or bar graph decreasing vector icon with drop down arrow. Statistical data of stock, financial in business to loss, negative, decline or crisis. Graphic for report, presentation. 48x48 px. n. Sales decrease vectors Bar chart or bar graph decreasing vector icon with drop down arrow. 48x48 pixel perfect and editable stroke. Bar chart or bar graph decreasing vector icon with drop down arrow. Statistical data of stock, financial in business to loss, negative, decline or crisis. Graphic for report, presentation. 48x48 px.n
Free with trial Rendered illustration of a three dimensional pie chart in five colors. Sales decrease illustrations Three dimensional pie chart in five colors.
Free with trial Graph going up and down sign with arrow vector illustration on white background. Sales decrease vectors Graph going up and down sign with arrow vector illustration
Free with trial Bar chart or bar graph decreasing vector icon with drop down arrow. Statistical data of stock, financial in business to loss, negative, decline or crisis. Graphic for report, presentation. 48x48 px. n. Sales decrease illustrations Bar chart or bar graph decreasing vector icon with drop down arrow. 48x48 pixel perfect and editable stroke. Bar chart or bar graph decreasing vector icon with drop down arrow. Statistical data of stock, financial in business to loss, negative, decline or crisis. Graphic for report, presentation. 48x48 px.n
Free with trial Decreasing bars chart icon vector isolated on white background for your web and mobile app design, Decreasing bars chart logo concept. Sales decrease vectors Decreasing bars chart icon vector sign and symbol isolated on white background, Decreasing bars chart logo concept. Decreasing bars chart icon vector isolated on white background for your web and mobile app design, Decreasing bars chart logo concept
Free with trial Growth vector icon. Graph or diagram with arrow going up and down. Vector illustration. Sales decrease vectors Growth vector icon. Graph or diagram with arrow going up and down. Vector
Free with trial Growth vector icon. Graph or diagram with arrow going up and down. Vector illustration. Sales decrease vectors Growth vector icon. Graph or diagram with arrow going up and down. Vector
Free with trial Stock market decline downfall red falling arrow. Sales decrease vectors Stock market decline downfall red falling arrow