Free with trial Economic crisis Sri Lanka map and flag, recession. Sales decrease illustrations Economic crisis Sri Lanka map and flag
Free with trial COVID-19 Coronavirus Philippines Economic Impact Concept Image 3d created illustration. Sales decrease illustrations COVID-19 Coronavirus Philippines Economic Impact Concept Image
Free with trial COVID-19 Coronavirus New Zealand Economic Impact Concept Image 3d created illustration. Sales decrease illustrations COVID-19 Coronavirus New Zealand Economic Impact Concept Image
Free with trial Money loss. Cash with down arrow stocks graph, concept of financial crisis, market fall, bankruptcy. Vector stock illustration. Sales decrease vectors Money loss. Cash with down arrow stocks graph, concept of financial crisis, market fall, bankruptcy. Vector stock
Free with trial Dequalizer logo design template. Down arrow blend with equalizer design concept. Explain performance degradation, losses, recession and other related. Isolated on white background. Sales decrease vectors Dequalizer logo design template. Down arrow blend with equalizer design concept. Explain performance degradation, losses
Free with trial The business concept of both crisis and recovery. Sales decrease illustrations The business concept of both crisis and recovery
Free with trial On the blackboard analysis of the dynamics of the business, sales. Sales decrease vectors On the board an analysis of business activities. On the blackboard analysis of the dynamics of the business, sales
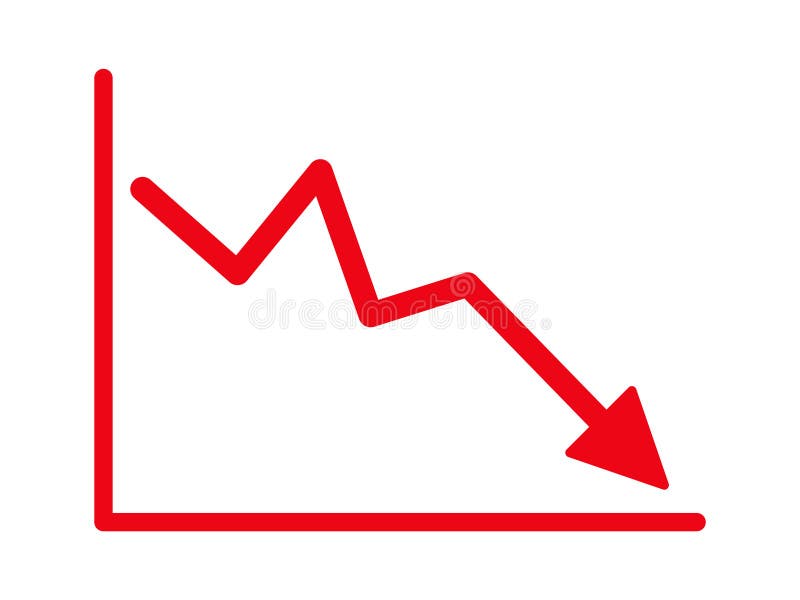
Free with trial Bar chart or bar graph decreasing vector icon with drop down arrow. Statistical data of stock, financial in business to loss, negative, decline or crisis. Graphic for report, presentation. 48x48 px. n. Sales decrease vectors Bar chart or bar graph decreasing vector icon with drop down arrow. 48x48 pixel perfect and editable stroke. Bar chart or bar graph decreasing vector icon with drop down arrow. Statistical data of stock, financial in business to loss, negative, decline or crisis. Graphic for report, presentation. 48x48 px.n
Free with trial Vector 3d red arrow going down stock icon. Bankruptcy, financial market crash icon. Graph chart downtrend symbol. chart going down sign. Realistic 3d Vector illustration isolated on white background. Sales decrease vectors Vector 3d red arrow going down stock icon. Bankruptcy, financial market crash icon. Graph chart downtrend symbol. chart
Free with trial Chart with down arrow icon collection in glyph style, solid color vector, version 1. Sales decrease vectors Chart with down arrow icon collection in glyph style
Free with trial Growth vector icon. Graph or diagram with arrow going up and down. Vector illustration. Sales decrease vectors Growth vector icon. Graph or diagram with arrow going up and down. Vector
Free with trial The businessman sliding down on chair in economic crisis concept. Sales decrease illustrations The businessman sliding down on chair in economic crisis concept
Free with trial Illustration Vector Graphic of Red and Black Color Cartoon down trending icon. Sales decrease illustrations Red and Black Color Cartoon down trending icon
Free with trial Start business, Report checklist and Graph chart icons simple set. Report document sign. Launch idea, Sales growth file, Growth chart. Education set. Speech bubble start business icon. Vector. Sales decrease vectors Start business, Report checklist and Graph chart icons set. Report document sign. Vector. Start business, Report checklist and Graph chart icons simple set. Report document sign. Launch idea, Sales growth file, Growth chart. Education set. Speech bubble start business icon. Vector
Free with trial Covid-19 or Corona virus global market impacts. Business concept economy graph chart down because of covid-19, corona virus. Stock market crisis red price arrow down chart fall. Sales decrease vectors Covid-19 or Corona virus global market impacts. Business concept economy graph chart down because of covid-19, corona virus
Free with trial Infographic diagram declining trend bar chart,illustration can be used as template in presentation,web banner design,business, economy,statistic flyer and slide. Sales decrease illustrations Infographic diagram declining trend bar chart,illustration can be used as template in presentation,web banner design,business
Free with trial Text sign showing low demand. Business photo text less consumer s is desire to purchase goods and services Colored memo reminder empty board blank space attach background rectangle. Sales decrease illustrations Text sign showing low demand. Conceptual photo less consumer s is desire to purchase goods and services Colored memo reminder. Text sign showing low demand. Business photo text less consumer s is desire to purchase goods and services Colored memo reminder empty board blank space attach background rectangle
Free with trial 3d model of financial graph with red backlight on blue background, stock market financing chart, economic boom and bust, investment bankruptcy and inflation, global rising and falling economy. 3D rendering. Sales decrease illustrations 3d model of financial graph with red backlight on blue background, stock market financing chart, economic boom and bust
Free with trial Red arrow going down stock icon on white background. Bankruptcy, financial market crash icon for your web site design, logo, app, UI. graph chart downtrend symbol. chart going down sign. Sales decrease vectors Red arrow going down stock icon on white background. Bankruptcy, financial market crash icon for your web site design. Red arrow going down stock icon on white background. Bankruptcy, financial market crash icon for your web site design, logo, app, UI. graph chart downtrend symbol.chart going down sign.
Free with trial Image representing American Profit and Financial Crisis. Sales decrease illustrations American Profit Crisis. Image representing American Profit and Financial Crisis
Free with trial Mexico economic crisis vector illustration Eps 10. Sales decrease vectors Mexico economic crisis vector illustration Eps 10
Free with trial Portugal economic crisis vector illustration Eps 10. Sales decrease vectors Portugal economic crisis vector illustration Eps 10
Free with trial Canada Stock Exchange market crisis red market price down chart fall / Stock analysis or forex charts graph Business and finance money crisis background red negative drop in sales economic fall. Sales decrease illustrations Canada Stock Exchange market crisis red market price down chart fall Business and finance money crisis background red negative. Canada Stock Exchange market crisis red market price down chart fall / Stock analysis or forex charts graph Business and finance money crisis background red negative drop in sales economic fall
Free with trial COVID-19 Coronavirus United States Economic Impact Concept Image 3d created illustration. Sales decrease illustrations COVID-19 Coronavirus United States Economic Impact Concept Image
Free with trial Sri Lanka economic crisis vector illustration Eps 10. Sales decrease vectors Sri Lanka economic crisis vector illustration Eps 10
Free with trial COVID-19 Coronavirus Romania Economic Impact Concept Image 3d created illustration. Sales decrease illustrations COVID-19 Coronavirus Romania Economic Impact Concept Image
Free with trial Economic crisis Philippines map and flag, recession. Sales decrease illustrations Economic crisis Philippines map and flag
Free with trial COVID-19 Coronavirus Canada Economic Impact Concept Image 3d created illustration. Sales decrease illustrations COVID-19 Coronavirus Canada Economic Impact Concept Image
Free with trial COVID-19 Coronavirus Greece Economic Impact Concept Image 3d created illustration. Sales decrease illustrations COVID-19 Coronavirus Greece Economic Impact Concept Image
Free with trial COVID-19 Coronavirus Austria Economic Impact Concept Image 3d created illustration. Sales decrease illustrations COVID-19 Coronavirus Austria Economic Impact Concept Image
Free with trial COVID-19 Coronavirus Slovenia Economic Impact Concept Image 3d created illustration. Sales decrease illustrations COVID-19 Coronavirus Slovenia Economic Impact Concept Image
Free with trial COVID-19 Coronavirus Australia Economic Impact Concept Image 3d created illustration. Sales decrease illustrations COVID-19 Coronavirus Australia Economic Impact Concept Image
Free with trial COVID-19 Coronavirus Netherlands Economic Impact Concept Image 3d created illustration. Sales decrease illustrations COVID-19 Coronavirus Netherlands Economic Impact Concept Image
Free with trial COVID-19 Coronavirus Bolivia Economic Impact Concept Image 3d created illustration. Sales decrease illustrations COVID-19 Coronavirus Bolivia Economic Impact Concept Image
Free with trial COVID-19 Coronavirus Nigeria Economic Impact Concept Image 3d created illustration. Sales decrease illustrations COVID-19 Coronavirus Nigeria Economic Impact Concept Image
Free with trial COVID-19 Coronavirus Italy Economic Impact Concept Image 3d created illustration. Sales decrease illustrations COVID-19 Coronavirus Italy Economic Impact Concept Image
Free with trial Germany oil industry concept, industrial illustration - lowering, falling graph on Germany flag background. 3D Illustration. Sales decrease illustrations Lowering, falling graph on Germany flag background - industrial illustration of Germany oil industry or market concept. 3D Illustr. Germany oil industry concept, industrial illustration - lowering, falling graph on Germany flag background. 3D Illustration
Free with trial Downward trend concept illustration on white background. Sales decrease illustrations Asia continent map with falling arrow. Financial stagnation, recession, crisis, business crash, stock markets down, economic colla. Downward trend concept illustration on white background
Free with trial German economy sees deepest decline on record. Sales decrease illustrations German economic growth expected to slow down in 2023. Supply chain crisis slows economic growth. German economy sees deepest decline on record.
Free with trial Decrease collapsing sales graph illustration drop fall, dip shrinkage, contraction plummet decrease collapsing sales graph. Sales decrease illustrations Decrease collapsing sales graph
Free with trial Decrease glowing style sales graph split illustration profit revenue, analysis forecast, growth decline decrease glowing style sales graph split. Sales decrease illustrations Decrease glowing style sales graph split
Free with trial A collection of icons Growth, loss, Upward report, Downward report, Sales decrease, Sales increase, icon. Sales decrease vectors Growth, loss, Upward report, Downward report, Sales decrease, Sales increase, icon
Free with trial A collection of icons Upward graph, Downward graph, Growth chart, Decrease chart, Sales Analysis, Progress graph, icon. Sales decrease vectors Upward graph, Downward graph, Growth chart, Decrease chart, Sales Analysis, Progress graph, icon
Free with trial Sad face beside sales trend line graph indicating decrease. Empty basket symbolizes low retail activity. Ideal for business decline, loss, market crisis, consumer struggle, analytics, recession. Sales decrease illustrations Declining Sales Chart with Sad Face and Empty Shopping Basket. Sad face beside sales trend line graph indicating decrease. Empty basket symbolizes low retail activity. Ideal for business decline, loss, market crisis, consumer struggle, analytics, recession
Free with trial Revenue flowing sales graph illustration growth metrics, visualization forecast, increase decrease revenue flowing sales graph. Sales decrease illustrations Revenue flowing sales graph
Free with trial Set Sales funnel with chart, Financial growth decrease, Server and Calculator icon. Vector. Sales decrease illustrations Set Sales funnel with chart, Financial growth decrease, Server and Calculator icon. Vector
Free with trial Connected cube network in blockchain style, sales decrease arrow, and analytics report. Ideal for blockchain, cryptocurrency, sales, technology, analytics, business data-driven decision-making. Sales decrease illustrations Blockchain Network with Sales Decline and Analytics Representation. Connected cube network in blockchain style, sales decrease arrow, and analytics report. Ideal for blockchain, cryptocurrency, sales, technology, analytics, business data-driven decision-making
Free with trial A striking 3D rendering illustrates a significant decline in consumer spending or retail sales. The image features a large green shopping bag followed by three progressively smaller white shopping bags, visually representing a reduction. A prominent red arrow, shaped like a downward trend graph, effectively symbolizes a market downturn, economic recession, or decrease in purchasing power. Set against a clean white background, this conceptual image is ideal for financial reports, business presentations, and articles discussing economic challenges, retail struggles, or market analysis. Sales decrease illustrations Retail Sales Decline and Economic Downturn. A striking 3D rendering illustrates a significant decline in consumer spending or retail sales. The image features a large green shopping bag followed by three progressively smaller white shopping bags, visually representing a reduction. A prominent red arrow, shaped like a downward trend graph, effectively symbolizes a market downturn, economic recession, or decrease in purchasing power. Set against a clean white background, this conceptual image is ideal for financial reports, business presentations, and articles discussing economic challenges, retail struggles, or market analysis.
Free with trial A magnifying glass focuses on a declining bar graph and a file folder, symbolizing a decrease in sales and the need for. Sales decrease illustrations Declining Sales Analysis Magnifying Glass, Downward Graph. A magnifying glass focuses on a declining bar graph and a file folder, symbolizing a decrease in sales and the need for.
Free with trial Set line Binary code, Browser with exclamation mark, Financial growth decrease and Sales funnel chart icon. Vector. Sales decrease illustrations Set line Binary code, Browser with exclamation mark, Financial growth decrease and Sales funnel chart icon. Vector
Free with trial Set Coal mine trolley Server Pie chart infographic Financial growth Data analysis decrease and Sales funnel with icon. Vector. Sales decrease vectors Set Coal mine trolley, Server, Pie chart infographic, Financial growth, Data analysis, decrease, and Sales funnel with. Set Coal mine trolley Server Pie chart. Set Coal mine trolley Server Pie chart infographic Financial growth Data analysis decrease and Sales funnel with icon. Vector.
Free with trial Set Financial growth decrease Cloud computing lock Pie chart infographic Server Sales funnel with and Data analysis icon. Vector. Sales decrease illustrations Set Financial growth decrease, Cloud computing lock, Pie chart infographic, Server, Sales funnel with, and Data analysis
Free with trial A compelling visual representation of declining retail sales or consumer spending, featuring a large green shopping bag alongside three progressively smaller white shopping bags. A prominent red arrow graphically illustrates a downward trend, symbolizing a decrease in market demand, economic downturn, or business loss. This 3D rendered image on a clean white background is ideal for financial reports, economic analysis, business presentations, or articles discussing retail challenges, recession, or reduced purchasing power. Sales decrease illustrations Retail Sales Decline Concept with Shopping Bags and Downward Arrow. A compelling visual representation of declining retail sales or consumer spending, featuring a large green shopping bag alongside three progressively smaller white shopping bags. A prominent red arrow graphically illustrates a downward trend, symbolizing a decrease in market demand, economic downturn, or business loss. This 3D rendered image on a clean white background is ideal for financial reports, economic analysis, business presentations, or articles discussing retail challenges, recession, or reduced purchasing power.
Free with trial A vector graphic of a line graph showing a downward trend. Represents decrease, decline, loss, or negative performance. In automotive context, could symbolize falling sales, decreasing fuel efficiency, or a system performance drop. A clear visual for illustrating negative trends, vector design Generative AI. Sales decrease vectors Downtrend graph icon, decrease decline loss symbol, vector design Generative AI. A vector graphic of a line graph showing a downward trend. Represents decrease, decline, loss, or negative performance. In automotive context, could symbolize falling sales, decreasing fuel efficiency, or a system performance drop. A clear visual for illustrating negative trends, vector design Generative AI
Free with trial A modern flat design concept illustrating business analytics and sales performance. The scene features a laptop and smartphone displaying a dashboard with various charts, graphs, and statistics for a Q3 report. A world map with a magnifying glass signifies global market analysis and regional breakdown. Additional elements like a checklist and growth decrease icons represent strategic planning, auditing, and financial review. This versatile vector illustration is perfect for presentations, marketing materials, and web design related to finance, data visualization, and business intelligence. Sales decrease illustrations Business Analytics and Sales Performance Report Dashboard. A modern flat design concept illustrating business analytics and sales performance. The scene features a laptop and smartphone displaying a dashboard with various charts, graphs, and statistics for a Q3 report. A world map with a magnifying glass signifies global market analysis and regional breakdown. Additional elements like a checklist and growth decrease icons represent strategic planning, auditing, and financial review. This versatile vector illustration is perfect for presentations, marketing materials, and web design related to finance, data visualization, and business intelligence.
Free with trial Sales word with a decrease chart. Financial crisis. Sales decrease illustrations Sales word with a decrease chart. Financial crisis
Free with trial Sales word with a decrease chart. Financial crisis. Sales decrease illustrations Sales word with a decrease chart. Financial crisis
Free with trial Sales word with a decrease chart. Financial crisis. Sales decrease illustrations Sales word with a decrease chart. Financial crisis
Free with trial Sales word with a decrease chart. Financial crisis. Sales decrease illustrations Sales word with a decrease chart. Financial crisis
Free with trial Sales word with a decrease chart. Financial crisis. Sales decrease illustrations Sales word with a decrease chart. Financial crisis
Free with trial Sales word with a decrease chart. Financial crisis. Sales decrease illustrations Sales word with a decrease chart. Financial crisis
Free with trial Sales word with a decrease chart. Financial crisis. Sales decrease illustrations Sales word with a decrease chart. Financial crisis
Free with trial Line art percentage icon set featuring discount tags and financial decrease symbols for sales, economics, and business. Sales decrease vectors Line art percentage icon set featuring discount tags and financial decrease symbols for sales, economics, and business
Free with trial Set line Financial growth decrease Sales funnel with chart Pie infographic and Binary code with long shadow. Red square button. Vector. Sales decrease illustrations Set line Financial growth decrease, Sales funnel with chart, Pie infographic and Binary code with long shadow. Red. Set line Financial growth decrease Sales funnel with chart Pie infographic and Binary code with long shadow. Red square button. Vector.
Free with trial A line art illustration of a man presenting a whiteboard with a large downward-pointing arrow. This graphic effectively represents a decrease, decline, or negative trend in sales, finance, or other data. Useful for business reports. vector design Generative AI. Sales decrease vectors Businessman Presenting a Chart with a Downward Arrow. Decrease. vector design Generative AI. A line art illustration of a man presenting a whiteboard with a large downward-pointing arrow. This graphic effectively represents a decrease, decline, or negative trend in sales, finance, or other data. Useful for business reports. vector design Generative AI
Free with trial The image depicts a series of vertical bars in teal color, showing a gradual decrease in height from left to right. A large red downward-pointing arrow overlays the bars, emphasizing the trend of decline in the data represented. This visual is commonly used to illustrate decreasing performance, sales, or other metrics over time. Sales decrease illustrations Declining bar chart with a downward arrow indicating a decrease in values. The image depicts a series of vertical bars in teal color, showing a gradual decrease in height from left to right. A large red downward-pointing arrow overlays the bars, emphasizing the trend of decline in the data represented. This visual is commonly used to illustrate decreasing performance, sales, or other metrics over time
Free with trial The image shows a series of vertical bars in descending order of height, colored from dark blue to light purple. A bold red diagonal arrow overlays the bars, pointing downward, symbolizing a decline or reduction in values over time. This visual is often used to represent a decrease in metrics such as sales, performance, or other quantifiable data trends. Sales decrease illustrations Declining bar chart with downward trend arrow indicating a decrease in values. The image shows a series of vertical bars in descending order of height, colored from dark blue to light purple. A bold red diagonal arrow overlays the bars, pointing downward, symbolizing a decline or reduction in values over time. This visual is often used to represent a decrease in metrics such as sales, performance, or other quantifiable data trends
Free with trial A line graph shows a steady increase in sales over the past five years while a corresponding bar graph demonstrates the decrease in operating expenses during the same period.. Vector. Sales decrease illustrations A line graph shows a steady increase in sales over the past five years while a corresponding bar graph demonstrates the
Free with trial This cartoon character holding a large red arrow pointing down represents the concept of decline or decrease. The character's sad expression and downward posture suggest a negative trend or loss in value. This image could be used to illustrate a variety of topics, such as declining sales, decreasing market share, or a drop in performance. The bold red arrow draws the viewer's attention and emphasizes the seriousness of the situation. Overall, this image effectively conveys the message of decline and can be a valuable asset in visual communication. Sales decrease illustrations Cartoon Character Holding Large Red Arrow Pointing Down - Concept of Decline or Decrease. This cartoon character holding a large red arrow pointing down represents the concept of decline or decrease. The character's sad expression and downward posture suggest a negative trend or loss in value. This image could be used to illustrate a variety of topics, such as declining sales, decreasing market share, or a drop in performance. The bold red arrow draws the viewer's attention and emphasizes the seriousness of the situation. Overall, this image effectively conveys the message of decline and can be a valuable asset in visual communication.
Free with trial Simple black and white icon of a store experiencing a decrease in sales. Sales decrease illustrations Arrows pointing down at store representing decreasing sales. Simple black and white icon of a store experiencing a decrease in sales
Free with trial This 3D rendering depicts a cartoon character holding a red arrow pointing downwards, symbolizing a decline or decrease in something. The character's expression appears concerned, as if they are troubled by the decline. The image could be used to convey a variety of themes, such as a drop in sales or profits, a decrease in productivity, or a decline in the economy. The bright colors and playful nature of the cartoon character may help to soften the impact of the negative message, making it a useful tool for presentations or marketing materials. Sales decrease illustrations Cartoon Character Holding Red Arrow Pointing Down - Concept of Decline or Decrease - 3D Rendering. This 3D rendering depicts a cartoon character holding a red arrow pointing downwards, symbolizing a decline or decrease in something. The character's expression appears concerned, as if they are troubled by the decline. The image could be used to convey a variety of themes, such as a drop in sales or profits, a decrease in productivity, or a decline in the economy. The bright colors and playful nature of the cartoon character may help to soften the impact of the negative message, making it a useful tool for presentations or marketing materials.
Free with trial Illustration of business downfall with a declining bar chart, downward arrow indicating decrease, and silhouette icons of people representing workforce or customer loss, signifying reduction. Sales decrease illustrations Bar chart with downward arrow and people icons showing decline in workforce or sales decrease business downfall illustration. Illustration of business downfall with a declining bar chart, downward arrow indicating decrease, and silhouette icons of people representing workforce or customer loss, signifying reduction
Free with trial Set Mind map infographic Pie chart Server Folder and lock Sales funnel with Financial growth decrease Data analysis and icon. Vector. Sales decrease vectors Set Mind map infographic, Pie chart, Server, Folder and lock, Sales funnel with, Financial growth decrease, Data. Set Mind map infographic Pie chart Server Folder and lock Sales funnel with Financial growth decrease Data analysis and icon. Vector.
Free with trial Downturn collapsing sales graph illustration slump decrease, drop fall, dip shrinkage downturn collapsing sales graph. Sales decrease illustrations Downturn collapsing sales graph
Free with trial Trend hand drawn style declining sales graph illustration decrease arrow, data analytics, visual report trend hand drawn style declining sales graph. Sales decrease illustrations Trend hand drawn style declining sales graph
Free with trial Down Trend Line Outline Arrow Pointing Downward Decrease Profits Sales Market Business Finance Black White Icon Sign Symbol Vector Illustration Artwork. Sales decrease vectors Down Trend Line Outline Arrow Pointing Downward Decrease Profits Sales Market Business Finance Black White Icon
Free with trial A digital representation of a sales funnel features a series of glowing, concentric circles in a gradient of pink to purple. At the top of the funnel stands a simplistic, icon-style human figure, symbolizing the target customer. The funnel is set against a dark blue background, enhancing the luminescent effect. The circles decrease in size as they descend, emphasizing the narrowing process of the sales stages. Sales decrease illustrations A sleek, minimalist sales funnel is depicted as a series of glowing, interconnected circles, each. A digital representation of a sales funnel features a series of glowing, concentric circles in a gradient of pink to purple. At the top of the funnel stands a simplistic, icon-style human figure, symbolizing the target customer. The funnel is set against a dark blue background, enhancing the luminescent effect. The circles decrease in size as they descend, emphasizing the narrowing process of the sales stages.
Free with trial A glossy green arrow pointing downwards, emblazoned with a white percentage symbol, symbolizing decreasing prices, financial decline, sales reduction, and negative economic trends. Sales decrease illustrations Green downward arrow with percentage symbol indicating sales decrease and financial growth decline. A glossy green arrow pointing downwards, emblazoned with a white percentage symbol, symbolizing decreasing prices, financial decline, sales reduction, and negative economic trends
Free with trial Set Financial growth decrease and Sales funnel with chart icon. Vector. Sales decrease illustrations Set Financial growth, decrease and Sales funnel with chart icon. Vector
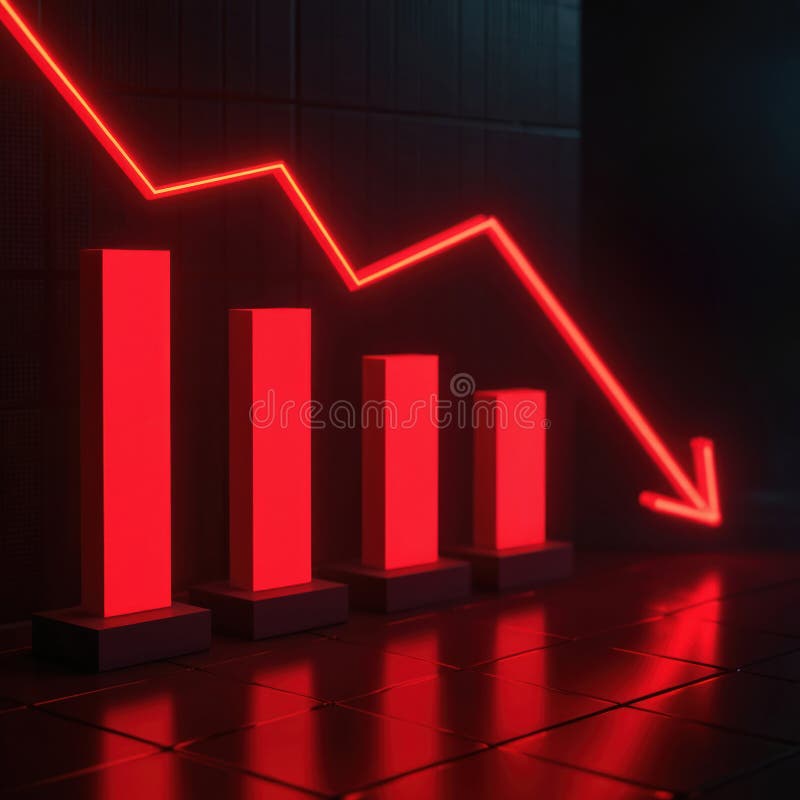
Free with trial Red glowing line graph shows market decline. Bar chart bars decrease, indicating falling sales, revenue loss. Financial report chart displays economic crisis, business downturn tech. Sales decrease illustrations Red glowing line graph shows market decline. Bar chart bars decrease, indicating falling sales, revenue loss. Financial report