Free with trial Set Bottle of wine Casino chips Calendar Money bag Wine glass Online sports betting slot machine with clover and Financial growth decrease icon. Vector. Set financial growth decrease vectors Set Bottle of wine, Casino chips, Calendar, Money bag, Wine glass, Online sports betting, slot machine with clover and. Set Bottle of wine Casino chips Calendar Money bag Wine glass Online sports betting slot machine with clover and Financial growth decrease icon. Vector.
Free with trial Set Cloud download and upload Browser with exclamation mark Pie chart infographic Folder lock Sales funnel and Financial growth decrease icon. Vector. Set financial growth decrease vectors Set Cloud download and upload, Browser with exclamation mark, Pie chart infographic, Folder lock, Sales funnel and. Set Cloud download and upload Browser with exclamation mark Pie chart infographic Folder lock Sales funnel and Financial growth decrease icon. Vector.
Free with trial Set Digital speed meter Browser with shield Create account screen Online shopping on Laptop browser window UI or UX design and Financial growth decrease icon. Vector. Set financial growth decrease illustrations Set Digital speed meter, Browser with shield, Create account screen, Online shopping on, Laptop browser window, UI or UX. Set Digital speed meter Browser with shield Create account screen Online shopping on Laptop browser window UI or UX design and Financial growth decrease icon. Vector.
Free with trial Set Wrench and gear Shopping bag with Sale Infographic element Light bulb Pie chart infographic Graph chart diagram and Financial growth decrease icon. Vector. Set financial growth decrease vectors Set Wrench and gear, Shopping bag with Sale, Infographic element, Light bulb, Pie chart infographic, Graph, chart. Set Wrench and gear Shopping bag with Sale Infographic element Light bulb Pie chart infographic Graph chart diagram and Financial growth decrease icon. Vector.
Free with trial Set Money plant in the pot payment transfer No money Diamond Stacks paper cash Treasure chest ATM and and Financial growth decrease icon. Vector. Set financial growth decrease illustrations Set Money plant in the pot, payment transfer, No money, Diamond, Stacks paper cash, Treasure chest, ATM and and. Set Money plant in the pot payment transfer No money Diamond Stacks paper cash Treasure chest ATM and and Financial growth decrease icon. Vector.
Free with trial Set Digital speed meter Location Delivery tracking Graph chart diagram Hierarchy organogram Infographic element and Financial growth decrease icon. Vector. Set financial growth decrease illustrations Set Digital speed meter, Location, Delivery tracking, Graph, chart, diagram, Hierarchy organogram, Infographic element. Set Digital speed meter Location Delivery tracking Graph chart diagram Hierarchy organogram Infographic element and Financial growth decrease icon. Vector.
Free with trial Set Website with stocks market developer programming code Create account screen Magnifying glass check Search engine Browser shield and Financial growth decrease icon. Vector. Set financial growth decrease vectors Set Website with stocks market, developer programming code, Create account screen, Magnifying glass check, Search engine. Set Website with stocks market developer programming code Create account screen Magnifying glass check Search engine Browser shield and Financial growth decrease icon. Vector.
Free with trial Set Project team base Arrow Percent up arrow Graph chart diagram Hierarchy organogram Mountains with flag and Financial growth decrease icon. Vector. Set financial growth decrease vectors Set Project team base, Arrow, Percent up arrow, Graph, chart, diagram, Hierarchy organogram, Mountains with flag and. Set Project team base Arrow Percent up arrow Graph chart diagram Hierarchy organogram Mountains with flag and Financial growth decrease icon. Vector.
Free with trial Cost efficiency, quality and costs as production optimization outline set. Labeled diagram with performance improvement and financial profit growth vector illustration. Reduce spending and expenses. Set financial growth decrease vectors Cost, efficiency and quality as production expenses optimization outline set. Cost efficiency, quality and costs as production optimization outline set. Labeled diagram with performance improvement and financial profit growth vector illustration. Reduce spending and expenses.
Free with trial A professional vector set of business chart icons showing both growth and decline trends. Includes bar charts and line graphs with upward and downward arrows, representing profit, loss, performance rise, and financial downfall. Perfect for business presentations, reports, websites, infographics, and more. Fully editable EPS file for scalable design use. Set financial growth decrease vectors . A professional vector set of business chart icons showing both growth and decline trends. Includes bar charts and line graphs with upward and downward arrows, representing profit, loss, performance rise, and financial downfall. Perfect for business presentations, reports, websites, infographics, and more. Fully editable EPS file for scalable design use.
Free with trial Money Transfer Icons Set, Currency Exchange Logo, Crypto Financial Services. Vector illustration. Set financial growth decrease vectors Money Transfer Icons Set, Currency Exchange Logo, Crypto Financial Services. Vector
Free with trial Money Transfer Icons Set, Currency Exchange Logo, Crypto Financial Services. Vector illustration. Set financial growth decrease vectors Money Transfer Icons Set, Currency Exchange Logo, Crypto Financial Services. Vector
Free with trial Increase and decrease related icons: thin vector icon set, black and white kit. Set financial growth decrease vectors Increase and decrease related icons
Free with trial A contrasting vector graphic set showing rising green bars with an upward arrow and falling red bars with a downward arrow, representing financial growth and decline. Set financial growth decrease vectors Business bar charts indicating growth and decline. A contrasting vector graphic set showing rising green bars with an upward arrow and falling red bars with a downward arrow, representing financial growth and decline
Free with trial A clean black and white set of nine vector icons showing growth, decline, stability, and financial trends for business presentations and reports. Set financial growth decrease vectors Economic trend icons set flat design vector illustration. A clean black and white set of nine vector icons showing growth, decline, stability, and financial trends for business presentations and reports.
Free with trial Modern black and white vector icons showing financial trends, growth, decline, and exchange for business presentations or reports. Set financial growth decrease vectors Financial trend icons set vector illustration flat design. Modern black and white vector icons showing financial trends, growth, decline, and exchange for business presentations or reports
Free with trial Money line icons. Settings gear, Message, Inflation icons. Finance, revenue reduction and financial benefit set. Economy, money savings and increase profit line icons. Vector. Set financial growth decrease vectors Money line icons. Finance, revenue reduction and financial benefit. App line icons. Vector. Money line icons. Settings gear, Message, Inflation icons. Finance, revenue reduction and financial benefit set. Economy, money savings and increase profit line icons. Vector
Free with trial Return of investment icon set. Dollar symbols with arrow. Cost of dollar with arrow down and up. Coin of dollar with loss or growth. Increase and low of revenue. Set financial growth decrease vectors Return of investment icon set. Dollar symbols with arrow. Cost of dollar with arrow down and up.
Free with trial Increasing and decreasing graph set. Red and blue arrows depict growth and recession business. Flat vector chart concept illustration as an element for web, publish infographic and social networks. Set financial growth decrease vectors Growth and Recession Business Concept. Increasing and decreasing graph set. Red and blue arrows depict growth and recession business. Flat vector chart concept illustration as an element for web, publish infographic and social networks.
Free with trial This image displays a set of stylized bar chart icons representing financial and business trends. The leftmost icon features green bars increasing in height, accompanied by a green upward-pointing arrow, symbolizing growth and success. The middle icon shows red bars decreasing in height, with a black downward-pointing arrow indicating decline and loss. The right side presents two smaller black and white bar charts, also depicting downward trends. These icons are ideal for illustrating concepts like profit, loss, market trends, economic performance, and data analysis. Set financial growth decrease illustrations Growth and Decline Bar Chart Icons. This image displays a set of stylized bar chart icons representing financial and business trends. The leftmost icon features green bars increasing in height, accompanied by a green upward-pointing arrow, symbolizing growth and success. The middle icon shows red bars decreasing in height, with a black downward-pointing arrow indicating decline and loss. The right side presents two smaller black and white bar charts, also depicting downward trends. These icons are ideal for illustrating concepts like profit, loss, market trends, economic performance, and data analysis.
Free with trial Money Transfer Icons Set, Currency Exchange Logo, Crypto Financial Services. Vector illustration. Set financial growth decrease vectors Money Transfer Icons Set, Currency Exchange Logo, Crypto Financial Services. Vector
Free with trial An abstract digital financial chart features multiple vibrant, fluctuating neon lines in blue, green, pink, and white, set against a dark grid background. Prominent red upward and downward arrows, along with a green downward arrow, clearly indicate market trends, growth, and decline. Interspersed geometric shapes connected by lines suggest complex data points and network connections. This dynamic visualization is ideal for illustrating concepts of stock market data, cryptocurrency trends, business analytics, investment volatility, big data, AI, and financial technology, suitable for modern business and tech-related projects. Set financial growth decrease illustrations Digital Financial Data Chart with Fluctuating Lines and Arrows. An abstract digital financial chart features multiple vibrant, fluctuating neon lines in blue, green, pink, and white, set against a dark grid background. Prominent red upward and downward arrows, along with a green downward arrow, clearly indicate market trends, growth, and decline. Interspersed geometric shapes connected by lines suggest complex data points and network connections. This dynamic visualization is ideal for illustrating concepts of stock market data, cryptocurrency trends, business analytics, investment volatility, big data, AI, and financial technology, suitable for modern business and tech-related projects.
Free with trial A clean and modern digital illustration of a financial candlestick chart, displaying market trends and stock performance. The graph features blue candlesticks indicating price movements over time, accompanied by a solid blue line graph and subtle dashed trend lines. Set against a crisp white background with a clear grid, this visualization is ideal for illustrating concepts related to finance, investment, business analytics, economic forecasts, and data reporting. It conveys growth, volatility, and strategic decision-making in the stock market. Set financial growth decrease illustrations Financial Candlestick Chart with Trend Line on White Background. A clean and modern digital illustration of a financial candlestick chart, displaying market trends and stock performance. The graph features blue candlesticks indicating price movements over time, accompanied by a solid blue line graph and subtle dashed trend lines. Set against a crisp white background with a clear grid, this visualization is ideal for illustrating concepts related to finance, investment, business analytics, economic forecasts, and data reporting. It conveys growth, volatility, and strategic decision-making in the stock market.
Free with trial Down payment, cash loan, credit approval, income growth, investment dividends, decrease and increase graph, refinance, cost calculating, interest rate, stock market, vector line icon set, thin stroke. Set financial growth decrease vectors Down payment, refinance loan, credit approval, investment dividends, decrease and increase graph, cost calculating, interest rate. Down payment, cash loan, credit approval, income growth, investment dividends, decrease and increase graph, refinance, cost calculating, interest rate, stock market, vector line icon set, thin stroke
Free with trial Increase and Decrease Stroke icon collections. Containing Increase, Decrease, Growth, Fall, up, down icons. Editable Stroke icon collections. Set financial growth decrease vectors Increase and Decrease Stroke icon collections.
Free with trial 24 line icons focused on finance, each featuring simplified designs depicting various financial concepts. Icons include currency symbols, wallet, hacker, exchange, mining, invoice mail, increase and decrease graphs, mobile banking, budget, precious metals, business, income, financial safe, piggy bank, and money bag. The icons are black and white with consistent line thickness, set against a plain background, and labeled with their respective terms, offering a clear and organized representation of financial elements. Set financial growth decrease vectors Set of collection line icons related finance, money, payment. 24 line icons focused on finance, each featuring simplified designs depicting various financial concepts. Icons include currency symbols, wallet, hacker, exchange, mining, invoice mail, increase and decrease graphs, mobile banking, budget, precious metals, business, income, financial safe, piggy bank, and money bag. The icons are black and white with consistent line thickness, set against a plain background, and labeled with their respective terms, offering a clear and organized representation of financial elements.
Free with trial Down payment, cash loan, credit approval, income growth, investment dividends, decrease and increase graph, refinance, cost calculating, interest rate, stock market, vector line icon set, thin stroke. Set financial growth decrease vectors Down payment, refinance loan, credit approval, investment dividends, decrease and increase graph, cost calculating, interest rate. Down payment, cash loan, credit approval, income growth, investment dividends, decrease and increase graph, refinance, cost calculating, interest rate, stock market, vector line icon set, thin stroke
Free with trial Financial risk icons. Decrease icon set. Vector illustration isolated on white background. Set financial growth decrease illustrations Financial risk icons
Free with trial Simple line art business icons set featuring a magnifying glass, minus symbol, pie chart, and rising bar graph for financial data analysis. Set financial growth decrease vectors Simple line art business icons set featuring a magnifying glass, minus symbol, pie chart, and rising bar graph for
Free with trial A minimalist graphic illustration of a downward financial trend features a green line graph with three vertical bars topped by dollar signs, where the first bar is green, the second yellow, and the third orange, symbolizing decreasing monetary value, set against a clean white background with scattered dollar signs emphasizing economic decline, conveying a clear message of financial loss, market. Set financial growth decrease illustrations Downward financial trend with colored dollar signs on white background. A minimalist graphic illustration of a downward financial trend features a green line graph with three vertical bars topped by dollar signs, where the first bar is green, the second yellow, and the third orange, symbolizing decreasing monetary value, set against a clean white background with scattered dollar signs emphasizing economic decline, conveying a clear message of financial loss, market
Free with trial Stock trading icons set in flat style. Bear and bull market, currency exchange, stock trading bot, increase and decrease, money flow, watch list signs. Money management pictograms for UX UI design. Set financial growth decrease vectors Stock trading icons set in flat style.
Free with trial A vibrant and playful collection of hand-drawn financial and business icons. The set includes a bar graph, gold bars, a downward arrow, calculators, a smiley face, and cartoon dollar bills. These icons are perfect for illustrating concepts related to finance, economics, investment, and business growth. The simple and cheerful design makes them ideal for educational materials, presentations, and websites. Set financial growth decrease vectors Finance and Business Icons Set. A vibrant and playful collection of hand-drawn financial and business icons. The set includes a bar graph, gold bars, a downward arrow, calculators, a smiley face, and cartoon dollar bills. These icons are perfect for illustrating concepts related to finance, economics, investment, and business growth. The simple and cheerful design makes them ideal for educational materials, presentations, and websites.
Free with trial A comprehensive collection of 16 black glyph icons on a clean white background, representing a wide range of concepts from business and technology to daily life and abstract ideas. This versatile set includes symbols for financial growth, strategic thinking, mobile alerts, religious symbols, and more. Ideal for web design, mobile applications, infographics, presentations, and any project requiring clear, minimalist, and modern visual communication. Perfect for conveying diverse messages efficiently. Set financial growth decrease vectors Diverse Universal Glyph Icons Set. A comprehensive collection of 16 black glyph icons on a clean white background, representing a wide range of concepts from business and technology to daily life and abstract ideas. This versatile set includes symbols for financial growth, strategic thinking, mobile alerts, religious symbols, and more. Ideal for web design, mobile applications, infographics, presentations, and any project requiring clear, minimalist, and modern visual communication. Perfect for conveying diverse messages efficiently.
Free with trial Simple line art business icons set featuring a magnifying glass, minus symbol, pie chart, and rising bar graph for financial data analysis. Set financial growth decrease vectors Simple line art business icons set featuring a magnifying glass, minus symbol, pie chart, and rising bar graph for
Free with trial This set includes 15 high-quality, vector business icons representing various aspects of finance, networking, and growth. Perfect for websites, presentations, and applications. These simple yet effective icons provide visual clarity and professionalism. Set financial growth decrease illustrations Business Icon Set. This set includes 15 high-quality, vector business icons representing various aspects of finance, networking, and growth. Perfect for websites, presentations, and applications. These simple yet effective icons provide visual clarity and professionalism.
Free with trial This vibrant image features a white cube with a prominent black percentage symbol, seemingly floating above a row of five identical white cubes, each displaying a clear black downward arrow. Set against a bright yellow background, the composition powerfully symbolizes a concept of reduction, decline, or decrease. It's ideal for illustrating topics such as falling interest rates, economic downturns, sales reductions, discounts, negative trends, or any financial or business concept involving a downward movement in percentages. The clean, minimalist design offers versatility for various editorial and commercial uses. Set financial growth decrease illustrations Percentage Decrease Concept with Downward Arrows. This vibrant image features a white cube with a prominent black percentage symbol, seemingly floating above a row of five identical white cubes, each displaying a clear black downward arrow. Set against a bright yellow background, the composition powerfully symbolizes a concept of reduction, decline, or decrease. It's ideal for illustrating topics such as falling interest rates, economic downturns, sales reductions, discounts, negative trends, or any financial or business concept involving a downward movement in percentages. The clean, minimalist design offers versatility for various editorial and commercial uses.
Free with trial A dynamic black and white background pattern featuring a collection of hand-drawn financial and economic elements. The design includes various currency symbols like the Dollar, Euro, and Yen, alongside upward and downward arrows, zig-zag lines representing market volatility, and simple bar charts indicating growth or decline. Scattered ink splatters add a grunge, artistic touch to the overall composition. This versatile illustration is ideal for conveying concepts related to global finance, business trends, investment, stock market fluctuations, economic data, and wealth management in a creative and engaging way. Set financial growth decrease vectors Hand Drawn Financial Market Elements Background Pattern. A dynamic black and white background pattern featuring a collection of hand-drawn financial and economic elements. The design includes various currency symbols like the Dollar, Euro, and Yen, alongside upward and downward arrows, zig-zag lines representing market volatility, and simple bar charts indicating growth or decline. Scattered ink splatters add a grunge, artistic touch to the overall composition. This versatile illustration is ideal for conveying concepts related to global finance, business trends, investment, stock market fluctuations, economic data, and wealth management in a creative and engaging way.
Free with trial A comprehensive set of black grunge-textured icons representing the US Dollar (USD) and its market dynamics. The collection features various symbols indicating upward trends, downward trends, stability, and currency exchange or circulation, often incorporating arrows and graph-like elements. Ideal for financial reports, economic analyses, investment platforms, business presentations, and any design requiring visual representation of money flow, market performance, or currency value changes in a distinct, distressed style. Set financial growth decrease vectors Grunge USD Dollar Market Movement and Exchange Icons Set. A comprehensive set of black grunge-textured icons representing the US Dollar (USD) and its market dynamics. The collection features various symbols indicating upward trends, downward trends, stability, and currency exchange or circulation, often incorporating arrows and graph-like elements. Ideal for financial reports, economic analyses, investment platforms, business presentations, and any design requiring visual representation of money flow, market performance, or currency value changes in a distinct, distressed style.
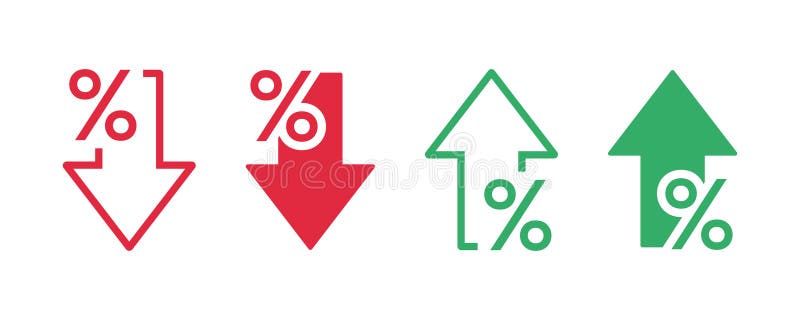
Free with trial Collection of red percentage signs with up and down arrows. Represents financial growth, decline, discounts, and sales. Set financial growth decrease vectors Percentage icon set, finance up and down arrows red symbols. Collection of red percentage signs with up and down arrows. Represents financial growth, decline. Collection of red percentage signs with up and down arrows. Represents financial growth, decline, discounts, and sales
Free with trial A collection of line icons representing various financial concepts, including money, bitcoin, shopping, and business growth, all in a simple black and white design. Set financial growth decrease vectors Financial Icons Set with Money, Bitcoin, and Business Symbols. A collection of line icons representing various financial concepts, including money, bitcoin, shopping, and business growth, all in a simple black and white design
Free with trial Increase decrease and arrow vector icon set design, 48x48 pixel perfect and editable stroke. Set financial growth decrease vectors Increase decrease icon. Increase decrease and arrow vector icon set design, 48x48 pixel perfect and editable stroke
Free with trial A set of solid black icons illustrating financial risk management and loss concepts, including money, wallet, business, investment, and protection. Set financial growth decrease vectors Financial Risk and Loss Management solid icon set. financial risk analysis loss management solid icons. A set of solid black icons illustrating financial risk management and loss concepts, including money, wallet, business, investment, and protection
Free with trial A shiny gold percentage symbol (%) set against a backdrop of red and blue financial graph lines, representing market trends, economic fluctuations, and investment analysis. Ideal for financial reports and business-related topics. Set financial growth decrease illustrations Gold Percentage Symbol with Red and Blue Financial Graph Trend. A shiny gold percentage symbol (%) set against a backdrop of red and blue financial graph lines, representing market trends, economic fluctuations, and investment analysis. Ideal for financial reports and business-related topics.
Free with trial Arrow percent icon set. Increase and decrease percentage sign symbol vector. Set financial growth decrease vectors Arrow percent icon set. Increase and decrease percentage sign symbol
Free with trial Icons on a white background depict percentage symbols combined with arrows and bar graphs. The top row includes red, blue, and yellow arrows with percentage symbols. The middle row shows a multicolored bar graph, green percentage symbols, and a black percentage symbol with a black arrow. The bottom row contains a black bar graph, a downward arrow, and a large black percentage symbol. These elements visually represent data trends, growth, and decline. Set financial growth decrease vectors Percentage Growth and Decline Arrow Icon Set Multi Color and Silhouette. Icons on a white background depict percentage symbols combined with arrows and bar graphs. The top row includes red, blue, and yellow arrows with percentage symbols. The middle row shows a multicolored bar graph, green percentage symbols, and a black percentage symbol with a black arrow. The bottom row contains a black bar graph, a downward arrow, and a large black percentage symbol. These elements visually represent data trends, growth, and decline.
Free with trial Increase decrease and arrow vector icon set design, 48x48 pixel perfect and editable stroke. Set financial growth decrease vectors Increase decrease icon. Increase decrease and arrow vector icon set design, 48x48 pixel perfect and editable stroke
Free with trial Increase decrease and arrow vector icon set design, 48x48 pixel perfect and editable stroke. Set financial growth decrease vectors Increase decrease icon. Increase decrease and arrow vector icon set design, 48x48 pixel perfect and editable stroke
Free with trial A set of six line art icons illustrating financial concepts, including stacks of coins with upward and downward arrows, hands with falling coins, a banknote, and a coin. Set financial growth decrease vectors Finance Icons Money Growth Loss Savings Investment Cash Coins banknote. A set of six line art icons illustrating financial concepts, including stacks of coins with upward and downward arrows, hands with falling coins, a banknote, and a coin
Free with trial Illustration and Vector: Inflation rate icon set. Included the icons as recession, economic, financial crisis, money, and more. Set financial growth decrease vectors Inflation rate icon set. Included the icons as recession, economic, financial crisis, money, and more.
Free with trial A vibrant and diverse set of financial icons, including symbols for money, growth, and profit, as well as various charts and graphs. The icons are colorful and modern, making them perfect for use in business presentations, reports, and marketing materials. The white background provides a clean and neutral space for the icons to stand out, allowing for easy customization and integration into various designs. Set financial growth decrease vectors A collection of colorful financial icons on a white background for business use. A vibrant and diverse set of financial icons, including symbols for money, growth, and profit, as well as various charts and graphs. The icons are colorful and modern, making them perfect for use in business presentations, reports, and marketing materials. The white background provides a clean and neutral space for the icons to stand out, allowing for easy customization and integration into various designs.
Free with trial A set of black and white icons representing different types of business and financial charts including bar graphs line graphs and pie charts. Set financial growth decrease vectors Collection of various business and financial chart icons including bar graphs line graphs and pie charts. A set of black and white icons representing different types of business and financial charts including bar graphs line graphs and pie charts
Free with trial Bitcoin pay, Time management and Graph chart line icons set. Group sign. Mobile payment, User with clock, Growth report. Group of users. People set. Line bitcoin pay outline icon. Vector. Set financial growth decrease vectors Bitcoin pay, Time management and Graph chart icons set. Group sign. Vector. Bitcoin pay, Time management and Graph chart line icons set. Group sign. Mobile payment, User with clock, Growth report. Group of users. People set. Line bitcoin pay outline icon. Vector
Free with trial Increase decrease and arrow vector icon set, 48x48 pixel perfect and editable stroke. Set financial growth decrease vectors Increase decrease icon. Increase decrease and arrow vector icon set, 48x48 pixel perfect and editable stroke
Free with trial Hand drawn line art percentage arrow icon set featuring downward and upward trending arrows with percentage signs for financial data representation. Set financial growth decrease vectors Hand drawn line art percentage arrow icon set featuring downward and upward trending arrows with percentage signs for
Free with trial A set of modern icons depicting financial concepts such as mortgage rates, loan interest fluctuations, and investment growth, using charts and percentage symbols. Set financial growth decrease vectors Financial icons illustrating mortgage rates, loan interest, and investment growth with charts and percentage symbols. A set of modern icons depicting financial concepts such as mortgage rates, loan interest fluctuations, and investment growth, using charts and percentage symbols
Free with trial Simple line art business icons set featuring a magnifying glass, minus symbol, pie chart, and rising bar graph for financial data analysis. Set financial growth decrease illustrations Simple line art business icons set featuring a magnifying glass, minus symbol, pie chart, and rising bar graph for
Free with trial Bitcoin, Income money and Presentation board icons simple set. Remote work banner. Home education class. Stock analysis sign. Cryptocurrency coin, Savings, Growth chart. Business trade. Vector. Set financial growth decrease vectors Bitcoin, Income money and Presentation board icons set. Stock analysis sign. Vector. Bitcoin, Income money and Presentation board icons simple set. Remote work banner. Home education class. Stock analysis sign. Cryptocurrency coin, Savings, Growth chart. Business trade. Vector
Free with trial Line art arrow icon set featuring percentage symbols with upward, downward, and bidirectional movement for financial data. Set financial growth decrease vectors Line art arrow icon set featuring percentage symbols with upward, downward, and bidirectional movement for financial data
Free with trial Histogram, Artificial intelligence and Keywords signs. Chat bubbles. Online survey, Timer and Report document line icons set. Quiz test, Deadline management, Growth chart. Economic trend. Vector. Set financial growth decrease vectors Online survey, Timer and Report document icons set. Histogram, Artificial intelligence and Keywords signs. Vector. Histogram, Artificial intelligence and Keywords signs. Chat bubbles. Online survey, Timer and Report document line icons set. Quiz test, Deadline management, Growth chart. Economic trend. Vector
Free with trial Diagram graph, Investment graph and Swipe up icons simple set. Button with halftone dots. Presentation chart, Investment infochart, Growth report. Scrolling page. Science set. Vector. Set financial growth decrease vectors Diagram graph, Investment graph and Swipe up icons set. Vector. Diagram graph, Investment graph and Swipe up icons simple set. Button with halftone dots. Presentation chart, Investment infochart, Growth report. Scrolling page. Science set. Vector
Free with trial Interest growth icon Vector symbol or sign set collection in black and white outline. Set financial growth decrease vectors Economic Growth Icon Illustrating Financial Prosperity, Investment Returns, and Profit Expansion. Interest growth icon Vector symbol or sign set collection in black and white outline
Free with trial Credit card, Graph and Report document icons simple set. 3d chart sign. Loan percent, Presentation diagram, Growth chart. Presentation column. Finance set. Speech bubble credit card icon. Vector. Set financial growth decrease vectors Credit card, Graph and Report document icons set. 3d chart sign. Vector. Credit card, Graph and Report document icons simple set. 3d chart sign. Loan percent, Presentation diagram, Growth chart. Presentation column. Finance set. Speech bubble credit card icon. Vector
Free with trial Percentage growth and decline icons set. Percentage arrow up and down icon. Vector illustration. Set financial growth decrease vectors Percentage growth and decline icons set. Percentage arrow up and down icon.
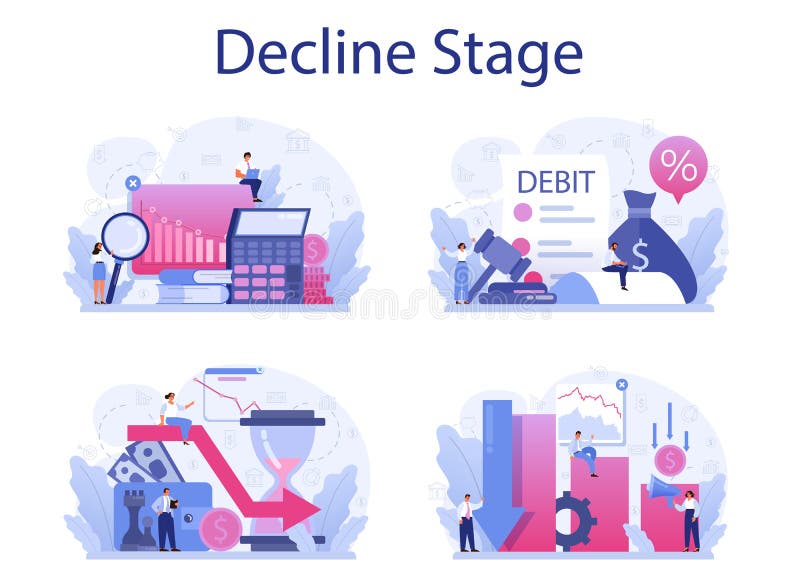
Free with trial Decline stage mobile application banner set. Finance crisis with falling down graph and income decrease. Idea of bancruptcy and business risk. Money loss. Isolated flat vector illustration. Set financial growth decrease vectors Decline stage mobile application banner set. Finance crisis
Free with trial Decline stage web banner or landing page set. Finance crisis with falling down graph and income decrease. Idea of bancruptcy and business risk. Money loss. Isolated flat vector illustration. Set financial growth decrease illustrations Decline stage web banner or landing page set. Finance crisis
Free with trial Targeting, Payment click and Graph chart icons simple set. Button with halftone dots. Currency exchange sign. Target with arrows, Financial transfer, Growth report. Euro and usd. Finance set. Vector. Set financial growth decrease vectors Targeting, Payment click and Graph chart icons set. Currency exchange sign. Vector. Targeting, Payment click and Graph chart icons simple set. Button with halftone dots. Currency exchange sign. Target with arrows, Financial transfer, Growth report. Euro and usd. Finance set. Vector
Free with trial Targeting, Payment click and Graph chart icons simple set. Halftone dots button. Currency exchange sign. Target with arrows, Financial transfer, Growth report. Euro and usd. Finance set. Vector. Set financial growth decrease vectors Targeting, Payment click and Graph chart icons set. Currency exchange sign. Vector. Targeting, Payment click and Graph chart icons simple set. Halftone dots button. Currency exchange sign. Target with arrows, Financial transfer, Growth report. Euro and usd. Finance set. Vector
Free with trial Graph chart, Certificate and Column chart line icons set. Timeline process infograph. Income money sign. Growth report, Certified file, Financial graph. Savings. Education set. Vector. Set financial growth decrease vectors Graph chart, Certificate and Column chart icons set. Income money sign. Vector. Graph chart, Certificate and Column chart line icons set. Timeline process infograph. Income money sign. Growth report, Certified file, Financial graph. Savings. Education set. Vector
Free with trial Decline stage online service or platform set. Finance crisis with falling down graph and income decrease. Idea of bancruptcy. Online consultation, financing, support. Isolated flat vector illustration. Set financial growth decrease vectors Decline stage online service or platform set. Finance crisis
Free with trial Decline stage concept set. Finance crisis with falling down graph and income decrease. Idea of bancruptcy and business risk. Money loss. Isolated flat vector illustration. Set financial growth decrease vectors Decline stage concept set. Finance crisis with falling down graph
Free with trial Launch project, 360 degrees and Horizontal chart icons simple set. Button with halftone dots. Cashback sign. Business innovation, Full rotation, Presentation graph. Financial transfer. Vector. Set financial growth decrease vectors Launch project, 360 degrees and Horizontal chart icons set. Cashback sign. Vector. Launch project, 360 degrees and Horizontal chart icons simple set. Button with halftone dots. Cashback sign. Business innovation, Full rotation, Presentation graph. Financial transfer. Vector
Free with trial Loyalty award, Calendar graph and Cashback line icons set. Cell phone, megaphone and deal vector icons. Upper arrows sign. Bonus medal, Annual report, Financial transfer. Growth infochart. Vector. Set financial growth decrease vectors Loyalty award, Calendar graph and Cashback icons set. Upper arrows sign. Vector. Loyalty award, Calendar graph and Cashback line icons set. Cell phone, megaphone and deal vector icons. Upper arrows sign. Bonus medal, Annual report, Financial transfer. Growth infochart. Vector
Free with trial Exhibitors sign. Diploma certificate, save planet chat bubbles. Question mark, Diagram and Diagram chart line icons set. Ask support, Growth graph, Presentation graph. Information desk. Vector. Set financial growth decrease vectors Question mark, Diagram and Diagram chart icons set. Exhibitors sign. Vector. Exhibitors sign. Diploma certificate, save planet chat bubbles. Question mark, Diagram and Diagram chart line icons set. Ask support, Growth graph, Presentation graph. Information desk. Vector
Free with trial Set of money cost increase and decrease with arrow. Set financial growth decrease vectors Set of money cost increase and decrease with arrow
Free with trial File settings, Statistics and Graph chart icons simple set. Button with halftone dots. Question mark sign. File management, Financial report, Growth report. Quiz chat. Technology set. Vector. Set financial growth decrease vectors File settings, Statistics and Graph chart icons set. Question mark sign. Vector. File settings, Statistics and Graph chart icons simple set. Button with halftone dots. Question mark sign. File management, Financial report, Growth report. Quiz chat. Technology set. Vector
Free with trial Data analysis, Document and Graph chart line icons set. Infographic timeline. Cashback sign. Magnifying glass, File with diagram, Growth report. Financial transfer. Finance set. Vector. Set financial growth decrease vectors Data analysis, Document and Graph chart icons set. Cashback sign. Vector. Data analysis, Document and Graph chart line icons set. Infographic timeline. Cashback sign. Magnifying glass, File with diagram, Growth report. Financial transfer. Finance set. Vector
Free with trial Graph, Vacancy and Analytics chart signs. Speech bubbles with quotes. Payment exchange, Loan percent and Calculator line icons set. Financial documents, Accounting symbols. Vector. Set financial growth decrease vectors Payment exchange, Loan percent and Calculator icons set. Graph, Vacancy and Analytics chart signs. Vector. Graph, Vacancy and Analytics chart signs. Speech bubbles with quotes. Payment exchange, Loan percent and Calculator line icons set. Financial documents, Accounting symbols. Vector
Free with trial Group sign. Diploma certificate, save planet chat bubbles. Bitcoin pay, Time management and Graph chart line icons set. Mobile payment, User with clock, Growth report. Group of users. Vector. Set financial growth decrease vectors Bitcoin pay, Time management and Graph chart icons set. Group sign. Vector. Group sign. Diploma certificate, save planet chat bubbles. Bitcoin pay, Time management and Graph chart line icons set. Mobile payment, User with clock, Growth report. Group of users. Vector
Free with trial A 3D rendered illustration depicting business growth. The image showcases two upward-trending arrow charts, one in gold and the other in blue, representing positive trends, progress, and success. The charts are set against a clean, light background, emphasizing the upward movement and potential for financial gain. Suitable for illustrating economic growth, investment strategies, and business performance. Set financial growth decrease illustrations Growth Chart with Arrows. A 3D rendered illustration depicting business growth. The image showcases two upward-trending arrow charts, one in gold and the other in blue, representing positive trends, progress, and success. The charts are set against a clean, light background, emphasizing the upward movement and potential for financial gain. Suitable for illustrating economic growth, investment strategies, and business performance.
Free with trial Financial market icon set vector. Set financial growth decrease vectors Financial market icon set