Free with trial Finance thin line icon set 3, vector eps10. Set financial growth decrease vectors Finance thin line icon set 3, vector eps10
Free with trial Set of red 3D arrows pointing downward in various styles. Concept of business decline, market crash, or financial loss for economic visualization. Vector illustration. Set financial growth decrease vectors Set of red 3D arrows pointing downward
Free with trial Line icons about finance. Financial concept. Contains such icons as piggy bank, bank, stock market, investment and accounts. Editable stroke Vector 64x64 pixel perfect. Set financial growth decrease vectors Simple set of outline icons about finance. Financial concept. Line icons about finance. Financial concept. Contains such icons as piggy bank, bank, stock market, investment and accounts. Editable stroke Vector 64x64 pixel perfect
Free with trial Line icons about finance. Financial concept. Contains such icons as piggy bank, bank, stock market, investment and accounts. Editable stroke Vector 256x256 pixel perfect. Set financial growth decrease vectors Simple set of outline icons about finance. Financial concept. Line icons about finance. Financial concept. Contains such icons as piggy bank, bank, stock market, investment and accounts. Editable stroke Vector 256x256 pixel perfect
Free with trial A diverse set of graphic icons representing financial growth, decline, and market trends with clear up and down arrows, bar charts, and coin stacks. Flat design. Set financial growth decrease vectors Collection of colorful increase and decrease icons. A diverse set of graphic icons representing financial growth, decline, and market trends with clear up and down arrows, bar charts, and coin stacks. Flat design
Free with trial Colored infographic financial elements collection of business audit management icons in sketch style isolated vector illustration. Set financial growth decrease vectors Colored Infographic Financial Elements Collection
Free with trial Financial realistic concept frame with budget symbols vector illustration. Set financial growth decrease vectors Financial Concept Frame. Financial realistic concept frame with budget symbols vector illustration
Free with trial 3D render illustrating exchange rate fluctuations. A red arrow points downwards, representing a decrease in value, while a green arrow points upwards, indicating an increase. Currency symbols for the Euro, US Dollar, and British Pound are scattered around the arrows, emphasizing the concept of currency exchange rates. The image is set against a clean white background, making it suitable for financial news, economic reports, or educational materials. Set financial growth decrease vectors Exchange Rate Fluctuations
Free with trial 3D percent icons in white, grey, and black colors showing rate, discount, and price change. Modern percentage vector for sale, business, and financial concept, symbolizing growth and reduction. Set financial growth decrease vectors 3D percent icons in white, grey, and black colors showing rate, discount, and price change. Modern percentage vector for
Free with trial The money and business outline icon set. The stack of dollar coins, gold 24k, upward and downward graph, online banking, briefcase and banknote symbols. Thin linear vector icons with editable strokes. Set financial growth decrease vectors The money and business outline vector icon set. The money and business outline icon set. The stack of dollar coins, gold 24k, upward and downward graph, online banking, briefcase and banknote symbols. Thin linear vector icons with editable strokes
Free with trial Investment line icon set. Quick approval, bank loan, percentage, trader, investor, exchange, newspaper, bond vector illustrations. Simple outline signs for financial activities. Editable Stroke. Set financial growth decrease illustrations Investment line icon set. Quick approval, bank loan, percentage, trader, investor, exchange, newspaper, bond vector
Free with trial Investment line icon set. Quick approval, bank loan, percentage, trader, investor, exchange, newspaper, bond vector illustrations. Simple outline signs for financial activities. Editable Stroke. Set financial growth decrease vectors Investment line icon set. Quick approval, bank loan, percentage, trader, investor, exchange, newspaper, bond vector
Free with trial Investment line icon set. Quick approval, bank loan, percentage, trader, investor, exchange, newspaper, bond vector illustrations. Simple outline signs for financial activities. Editable Stroke. Set financial growth decrease vectors Investment line icon set. Quick approval, bank loan, percentage, trader, investor, exchange, newspaper, bond vector
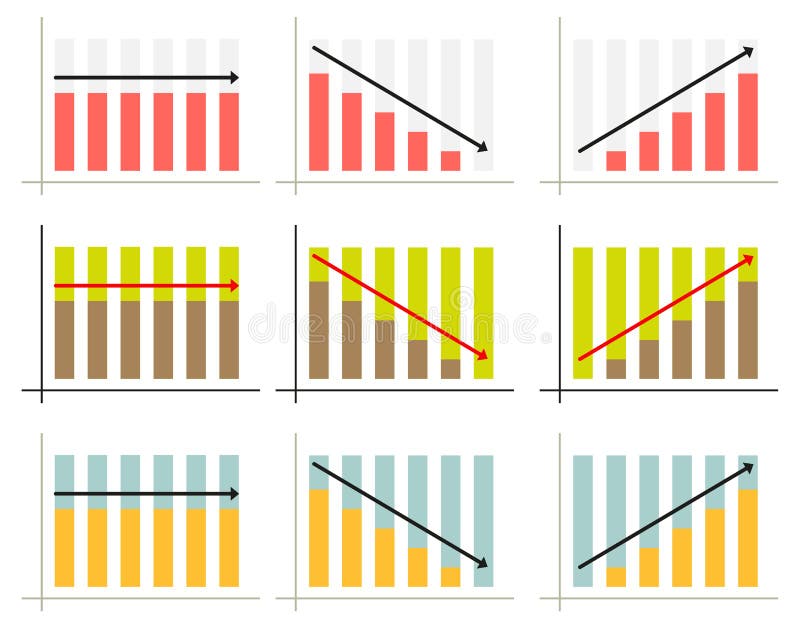
Free with trial Set of 3 infographic graphs for3 different situations in 3 color schemes. Set financial growth decrease vectors Graph set. Set of 3 infographic graphs for3 different situations in 3 color schemes
Free with trial Minimalist 3D set of green upward and red downward arrows, isolated on a white background. Realistic glossy render for financial market analysis, stock trading indicators, profit and loss comparison. Set financial growth decrease vectors Minimalist 3D set of green upward and red downward arrows, isolated on a white background
Free with trial Financial realistic horizontal banner with save money symbols vector illustration. Set financial growth decrease vectors Financial Horizontal Banner. Financial realistic horizontal banner with save money symbols vector illustration
Free with trial Financial realistic concept with money and investments symbols vector illustration. Set financial growth decrease vectors Financial Concept Illustration. Financial realistic concept with money and investments symbols vector illustration
Free with trial Decreasing graphs concept, financial strategy, low return on investment, the balance sheet of money and gold, long-term investment decline, reduced revenue, interest rate, credit money. Paper style vector. Set financial growth decrease vectors Decreasing graphs concept, financial strategy. Paper cut style vector. Decreasing graphs concept, financial strategy, low return on investment, the balance sheet of money and gold, long-term investment decline, reduced revenue, interest rate, credit money. Paper style vector.
Free with trial Outline icons set depicting stock market concepts like surge, decline, performance, savings, and activity. Preferably at the end of the sentence. Set financial growth decrease vectors Outline icons set depicting stock market concepts like surge, decline,... Outline icons set depicting stock market concepts like surge, decline, performance, savings, and activity. Preferably at the end of the sentence.
Free with trial Set of circular dollar currency icons with up and down arrows representing profit, loss, exchange and rate changes flat and glyph styles in black, red and green for business and finance use. Set financial growth decrease vectors Money Currency Icons With Up And Down Arrows Showing Increase And Decrease Financial Trends. Set of circular dollar currency icons with up and down arrows representing profit, loss, exchange and rate changes flat and glyph styles in black, red and green for business and finance use.
Free with trial A clean and minimalist illustration featuring a set of fundamental mathematical symbols in black against a pure white background. The symbols include plus (+), minus (-), division (�), multiplication (�), and equals ( ). This versatile graphic is ideal for educational materials, financial reports, business presentations, technology interfaces, or any design requiring clear representation of arithmetic operations, problem-solving, or logical concepts. Its simple design ensures high readability and adaptability across various media. Set financial growth decrease illustrations Basic Mathematical Symbols Set on White Background. A clean and minimalist illustration featuring a set of fundamental mathematical symbols in black against a pure white background. The symbols include plus (+), minus (-), division (�), multiplication (�), and equals ( ). This versatile graphic is ideal for educational materials, financial reports, business presentations, technology interfaces, or any design requiring clear representation of arithmetic operations, problem-solving, or logical concepts. Its simple design ensures high readability and adaptability across various media.
Free with trial A collection of eight thin-line related to finance and business. The depict a stack of coins with a dollar sign, a document with a dollar sign, an upward trending graph over city buildings, and a bar chart with a plus sign. The bottom row coins and currency symbols, a calculator with a dollar sign, a document with a calculator and charts, and a person. Set financial growth decrease illustrations Financial set with charts and calculator finance business. A collection of eight thin-line related to finance and business. The depict a stack of coins with a dollar sign, a document with a dollar sign, an upward trending graph over city buildings, and a bar chart with a plus sign. The bottom row coins and currency symbols, a calculator with a dollar sign, a document with a calculator and charts, and a person
Free with trial Set of alpha transparent business and finance icons drawn in white chalk, illustrating net asset value rising and falling alongside a market chart and Indian currency notation. Set financial growth decrease vectors Sketch of mutual fund NAV increase and decrease icons with Indian rupee symbol alpha transparent. Set of alpha transparent business and finance icons drawn in white chalk, illustrating net asset value rising and falling alongside a market chart and Indian currency notation.
Free with trial A vibrant, hand-drawn doodle illustration centered around a large percentage sign. This creative sketch features various financial and business icons, including bar graphs, pie charts, stacks of coins, dollar signs, and arrows indicating growth and decline. The colorful, cartoonish style makes it perfect for illustrating concepts like interest rates, economic trends, business analytics, and financial reports. Ideal for use in presentations, infographics, websites, and educational materials, this vector art is isolated on a white background for versatile application. Set financial growth decrease illustrations Finance and Economy Doodle Illustration. A vibrant, hand-drawn doodle illustration centered around a large percentage sign. This creative sketch features various financial and business icons, including bar graphs, pie charts, stacks of coins, dollar signs, and arrows indicating growth and decline. The colorful, cartoonish style makes it perfect for illustrating concepts like interest rates, economic trends, business analytics, and financial reports. Ideal for use in presentations, infographics, websites, and educational materials, this vector art is isolated on a white background for versatile application.
Free with trial A stylized, flat design illustration of a bar chart depicting a downward trend. The bars are colored red, yellow, and blue, arranged in decreasing height from left to right. A prominent red arrow points downwards across the chart, emphasizing the decline. The graphic is set against a clean white background, making it ideal for presentations, reports, and financial concepts related to loss, decrease, or negative performance. Set financial growth decrease illustrations Declining Bar Chart with Downward Arrow. A stylized, flat design illustration of a bar chart depicting a downward trend. The bars are colored red, yellow, and blue, arranged in decreasing height from left to right. A prominent red arrow points downwards across the chart, emphasizing the decline. The graphic is set against a clean white background, making it ideal for presentations, reports, and financial concepts related to loss, decrease, or negative performance.
Free with trial 50 business line icons collection. Basic set. Thin outline icons pack. Set financial growth decrease vectors 50 business line icons collection. Basic set. Thin outline icons pack
Free with trial This image features three bold, three-dimensional arrows pointing sharply downward, each rendered in distinct vibrant colors�'blue, yellow, and red�'symbolizing a significant market downturn, financial loss, or economic decline, set against a clean, minimalist white background that enhances their striking visual impact and conveys urgency and negative momentum in business, trading, or investment. Set financial growth decrease illustrations Colorful downward trending financial arrows in blue yellow and red illustrating market decline and economic downturn concepts. This image features three bold, three-dimensional arrows pointing sharply downward, each rendered in distinct vibrant colors�'blue, yellow, and red�'symbolizing a significant market downturn, financial loss, or economic decline, set against a clean, minimalist white background that enhances their striking visual impact and conveys urgency and negative momentum in business, trading, or investment
Free with trial This image features a minimalist and modern vector icon of a jagged downward trending line graph, sharply declining from left to right, symbolizing financial loss, economic downturn, or market decline, set against a clean and uncluttered white background suitable for use in presentations, reports, infographics, or digital media to visually communicate negative trends or decreasing performance. Set financial growth decrease illustrations Sharp downward trending line graph icon isolated on white background representing financial loss or market decline vector. This image features a minimalist and modern vector icon of a jagged downward trending line graph, sharply declining from left to right, symbolizing financial loss, economic downturn, or market decline, set against a clean and uncluttered white background suitable for use in presentations, reports, infographics, or digital media to visually communicate negative trends or decreasing performance
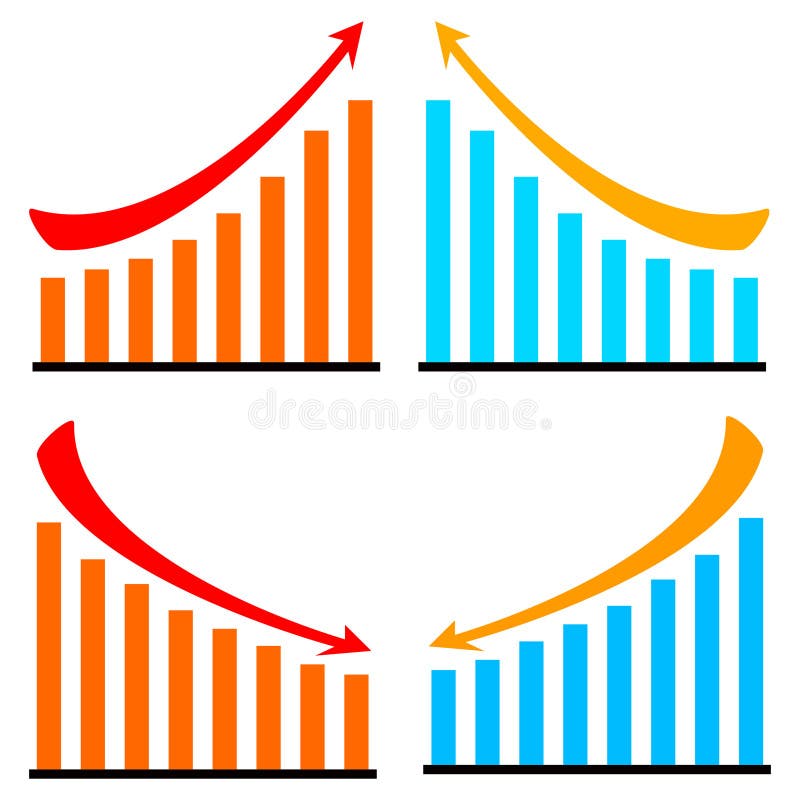
Free with trial Ascending and descending graph set. Vector illustration. Set financial growth decrease vectors Ascending and descending graph set.
Free with trial Ascending and descending graph set. Vector illustration. Set financial growth decrease vectors Ascending and descending graph set.
Free with trial This image showcases a comprehensive collection of blue bar graphs and line graphs, presented in a grid format. Each graph depicts various data trends, including upward and downward movements, fluctuating patterns, and steady growth. The clean, modern design makes these icons ideal for representing financial data, market analysis, performance metrics, and business growth in presentations, reports, and websites. Set financial growth decrease illustrations Collection of Blue Bar and Line Graphs for Business Analytics. This image showcases a comprehensive collection of blue bar graphs and line graphs, presented in a grid format. Each graph depicts various data trends, including upward and downward movements, fluctuating patterns, and steady growth. The clean, modern design makes these icons ideal for representing financial data, market analysis, performance metrics, and business growth in presentations, reports, and websites.
Free with trial The image shows a line graph illustrating the decline of carbon emissions. there are two lines on the graph, a green line and a grey line, both trending downwards. the green line, representing "carbon inteetiual emissions," shows a steeper decline compared to the grey line. the graph is set against a grid background, providing a visual reference for the rate of decrease in emissions over time. the downward trend suggests a positive change in reducing carbon output. Set financial growth decrease illustrations Carbon emissions decline graph illustration. the image shows a line graph illustrating the decline of carbon emissions. there are two lines on the graph, a green line and a grey line, both trending downwards. the green line, representing "carbon inteetiual emissions," shows a steeper decline compared to the grey line. the graph is set against a grid background, providing a visual reference for the rate of decrease in emissions over time. the downward trend suggests a positive change in reducing carbon output.
Free with trial Red and green 3D arrows are set against a white background. The red arrow points downward and the green arrow points upward. Both arrows have a white percentage symbol centered on them, indicating a focus on financial or data trends. The scene is clean and minimalist, showcasing the contrast between the arrows and their significance in indicating decrease and increase. Set financial growth decrease vectors Red down arrow and green up arrow with percentage signs on black background. Red and green 3D arrows are set against a white background. The red arrow points downward and the green arrow points upward. Both arrows have a white percentage symbol centered on them, indicating a focus on financial or data trends. The scene is clean and minimalist, showcasing the contrast between the arrows and their significance in indicating decrease and increase.
Free with trial Illustration set of petrol pump,increase and decrease. Set financial growth decrease vectors Economic petrol pump. Illustration set of petrol pump,increase and decrease
Free with trial A vibrant collection of hand-drawn business charts and graphs, rendered in blue tones. The set includes various types of visualizations like bar charts, line graphs, and a pie chart, all with a sketchy, illustrative style. These visuals are ideal for presentations, reports, and infographics related to finance, data analysis, growth, and business performance. Set financial growth decrease illustrations Hand-Drawn Business Charts and Graphs Collection. A vibrant collection of hand-drawn business charts and graphs, rendered in blue tones. The set includes various types of visualizations like bar charts, line graphs, and a pie chart, all with a sketchy, illustrative style. These visuals are ideal for presentations, reports, and infographics related to finance, data analysis, growth, and business performance.
Free with trial An abstract digital rendering of a financial market chart with a prominent red line indicating fluctuations in a stock market or trading scenario, set against a background of data streams and numerical information. It can be used for visualizing economic trends or for representing financial analytics. Set financial growth decrease illustrations Abstract financial chart depicting market trends and data analysis interface. An abstract digital rendering of a financial market chart with a prominent red line indicating fluctuations in a stock market or trading scenario, set against a background of data streams and numerical information. It can be used for visualizing economic trends or for representing financial analytics
Free with trial A 3D illustration depicts a financial chart with a downward trend. Four vertical bars, colored yellow, orange, and green, are arranged in descending order of height, suggesting a decline. To the left, a prominent orange circle contains a white downward-pointing arrow, reinforcing the theme of a negative trend or decrease. The entire composition is set against a plain white background. Set financial growth decrease illustrations Financial chart with downward trend indicator stock market. A 3D illustration depicts a financial chart with a downward trend. Four vertical bars, colored yellow, orange, and green, are arranged in descending order of height, suggesting a decline. To the left, a prominent orange circle contains a white downward-pointing arrow, reinforcing the theme of a negative trend or decrease. The entire composition is set against a plain white background
Free with trial Percent arrows up and down icon set. Income and cost increase and decrease arrow icons. Set financial growth decrease vectors Percent arrows up and down icon set
Free with trial A minimalist, black and white vector icon representing a bar chart or graph. The icon features a series of vertical bars of varying heights, set against a base of horizontal lines. This clean and modern design is ideal for representing data, statistics, progress, growth, or financial information in digital and print media. Its simple aesthetic makes it versatile for use in presentations, websites, apps, and infographics. Set financial growth decrease vectors Abstract Bar Chart Icon. A minimalist, black and white vector icon representing a bar chart or graph. The icon features a series of vertical bars of varying heights, set against a base of horizontal lines. This clean and modern design is ideal for representing data, statistics, progress, growth, or financial information in digital and print media. Its simple aesthetic makes it versatile for use in presentations, websites, apps, and infographics.
Free with trial A set of black icons representing percentage changes, including arrows and circular symbols. The icons depict various concepts such as decrease, increase, and rotation, all incorporating percentage signs. The simple design makes them versatile for use in financial, statistical, or educational materials. Set financial growth decrease illustrations Black percentage icons set. A set of black icons representing percentage changes, including arrows and circular symbols. The icons depict various concepts such as decrease, increase, and rotation, all incorporating percentage signs. The simple design makes them versatile for use in financial, statistical, or educational materials.
Free with trial Bar graphs with various upward and downward trending arrows and a stylized dollar sign indicating financial growth and decline. Set financial growth decrease vectors Bar graphs with various upward and downward trending arrows and a stylized dollar sign
Free with trial Financial icons including coins, ATM, gold bars, calculator, piggy bank, and credit card, representing money and banking. Set financial growth decrease vectors Financial icons including coins, ATM, gold bars, calculator, piggy bank, and credit card
Free with trial A clean, minimalist vector illustration of a bar chart featuring three distinct columns. The columns are colored in vibrant orange, teal, and yellow, representing different data points or categories. The chart is set against a white background with a dark blue axis line, making it ideal for presentations, reports, and infographics focused on data visualization, business growth, or financial analysis. Set financial growth decrease vectors Simple Bar Chart with Three Columns. A clean, minimalist vector illustration of a bar chart featuring three distinct columns. The columns are colored in vibrant orange, teal, and yellow, representing different data points or categories. The chart is set against a white background with a dark blue axis line, making it ideal for presentations, reports, and infographics focused on data visualization, business growth, or financial analysis.
Free with trial A 3D rendered illustration depicting a bright yellow coin with a prominent white dollar sign at its center. Flanking the coin are two circular icons: one with a green upward-pointing arrow and the other with a red downward-pointing arrow. The entire composition is set against a clean white background, symbolizing financial concepts of growth and decline. Set financial growth decrease illustrations 3D Rendered Yellow Dollar Coin with Up and Down Arrows on White. A 3D rendered illustration depicting a bright yellow coin with a prominent white dollar sign at its center. Flanking the coin are two circular icons: one with a green upward-pointing arrow and the other with a red downward-pointing arrow. The entire composition is set against a clean white background, symbolizing financial concepts of growth and decline
Free with trial Set of vector chart and graph icons for infographic. Thin line diagrams for business report or presentation. Set financial growth decrease vectors Set of vector chart. Set of vector chart and graph icons for infographic. Thin line diagrams for business report or presentation.
Free with trial A set of three distinct candlestick chart icons, rendered in a clean, flat vector style against a white background. The green candle typically represents a bullish trend or price increase, the red candle signifies a bearish trend or price decrease, and the gray candle can denote neutrality or indecision in the market. These versatile symbols are ideal for illustrating financial concepts, stock market analysis, trading platforms, investment apps, economic reports, and educational materials related to forex, cryptocurrency, and general business trends. Set financial growth decrease vectors Candlestick Chart Icons for Financial Analysis. A set of three distinct candlestick chart icons, rendered in a clean, flat vector style against a white background. The green candle typically represents a bullish trend or price increase, the red candle signifies a bearish trend or price decrease, and the gray candle can denote neutrality or indecision in the market. These versatile symbols are ideal for illustrating financial concepts, stock market analysis, trading platforms, investment apps, economic reports, and educational materials related to forex, cryptocurrency, and general business trends.
Free with trial Business line icons collection. Basic set. Thin outline icons pack. Set financial growth decrease vectors Business line icons collection. Basic set. Thin outline icons pack
Free with trial A 3D visualization of financial data, featuring a colorful pie chart and a series of bar graphs placed on top of a financial report document. The document also includes line graphs, illustrating various data trends and analyses. The composition is set against a white background. Set financial growth decrease illustrations 3D Bar Chart and Pie Chart on Financial Report with Line Graphs data statistics. A 3D visualization of financial data, featuring a colorful pie chart and a series of bar graphs placed on top of a financial report document. The document also includes line graphs, illustrating various data trends and analyses. The composition is set against a white background
Free with trial This image showcases a variety of modern, flat-design charts and graphs commonly used in business, finance, and data analysis. It includes bar charts, pie charts, and line graphs, presented in a clean, minimalist style with teal and gray color accents. These visual representations are ideal for illustrating trends, statistics, performance, and financial data in presentations, reports, and web content. Set financial growth decrease illustrations Collection of Business and Financial Charts and Graphs. This image showcases a variety of modern, flat-design charts and graphs commonly used in business, finance, and data analysis. It includes bar charts, pie charts, and line graphs, presented in a clean, minimalist style with teal and gray color accents. These visual representations are ideal for illustrating trends, statistics, performance, and financial data in presentations, reports, and web content.
Free with trial The image features a large black Euro currency symbol with a green upward arrow and a red downward arrow, set against a white background. The green arrow suggests growth or increase, while the red arrow indicates decline or decrease. This visual representation can be used to illustrate financial concepts such as fluctuating currency values, economic trends, or market performance. Set financial growth decrease vectors Euro currency symbol with green up and red down arrows. The image features a large black Euro currency symbol with a green upward arrow and a red downward arrow. The image features a large black Euro currency symbol with a green upward arrow and a red downward arrow, set against a white background. The green arrow suggests growth or increase, while the red arrow indicates decline or decrease. This visual representation can be used to illustrate financial concepts such as fluctuating currency values, economic trends, or market performance.
Free with trial A 3D render of a blue bar chart displaying a downward trend, with bars decreasing in height from left to right. The background features a subtle pattern of translucent upward-pointing arrows, suggesting growth or recovery despite the current decline. The scene is set against a clean, gradient gray backdrop with reflections, creating a modern and professional aesthetic. This image is ideal for representing financial downturns, market analysis, economic challenges, or the concept of overcoming obstacles. Set financial growth decrease illustrations Declining Blue Bar Chart with Upward Arrows Background. A 3D render of a blue bar chart displaying a downward trend, with bars decreasing in height from left to right. The background features a subtle pattern of translucent upward-pointing arrows, suggesting growth or recovery despite the current decline. The scene is set against a clean, gradient gray backdrop with reflections, creating a modern and professional aesthetic. This image is ideal for representing financial downturns, market analysis, economic challenges, or the concept of overcoming obstacles.
Free with trial Stock market icons. Set of 15 stock market trendy minimal icons. Bear, Bull, market analysis, Stock Exchange icon. Design signs for web page, mobile app, packaging design. Vector illustration. Set financial growth decrease vectors Stock market icons set. Stock market icons. Set of 15 stock market trendy minimal icons. Bear, Bull, market analysis, Stock Exchange icon. Design signs for web page, mobile app, packaging design. Vector illustration.
Free with trial A comprehensive set of financial and data visualization icons, perfect for illustrating business and economic concepts. This collection includes a growing bar chart with an upward trend, a declining bar chart with a downward trend, and a mixed bar chart. Also featured are stacks of global currencies (USD, Euro, INR), a segmented pie chart, and a world map colored green and red to signify global market conditions or data distribution. Ideal for presentations, reports, websites, and educational materials related to economics, finance, and market analysis. Set financial growth decrease vectors Global Financial and Business Data Visualization Icons Set. A comprehensive set of financial and data visualization icons, perfect for illustrating business and economic concepts. This collection includes a growing bar chart with an upward trend, a declining bar chart with a downward trend, and a mixed bar chart. Also featured are stacks of global currencies (USD, Euro, INR), a segmented pie chart, and a world map colored green and red to signify global market conditions or data distribution. Ideal for presentations, reports, websites, and educational materials related to economics, finance, and market analysis.
Free with trial A set of nine black icons depicts various graph representations on a white background. These include upward and downward trend lines, bar charts, and percentage symbols. Each icon visually portrays economic or statistical concepts, with arrows indicating direction�either upward or downward�to suggest growth or decline. The icons are simplistic and monochromatic, enhancing clarity and ease of understanding, suitable for financial, business, or educational contexts. Set financial growth decrease vectors A set of Minimal silhouette icon set of percentage growth and decline. A set of nine black icons depicts various graph representations on a white background. These include upward and downward trend lines, bar charts, and percentage symbols. Each icon visually portrays economic or statistical concepts, with arrows indicating direction�either upward or downward�to suggest growth or decline. The icons are simplistic and monochromatic, enhancing clarity and ease of understanding, suitable for financial, business, or educational contexts.
Free with trial Stacks of golden coins are shown decreasing in size with a red arrow pointing downward, set against a soft brown background, conveying a sense of financial loss and ideal for business and finance related visuals. Set financial growth decrease illustrations Decreasing Golden Coin Stacks with Red Arrow on Brown Background. Stacks of golden coins are shown decreasing in size with a red arrow pointing downward, set against a soft brown background, conveying a sense of financial loss and ideal for business and finance related visuals
Free with trial A comprehensive set of icons representing various aspects of business, finance, data analysis, growth, and strategy. Set financial growth decrease vectors Collection of Business and Finance Icons for Data Analysis and Growth. A comprehensive set of icons representing various aspects of business, finance, data analysis, growth, and strategy
Free with trial Increase decrease and arrow vector icon set, 48x48 pixel perfect and editable stroke. Set financial growth decrease vectors Increase decrease icon. Increase decrease and arrow vector icon set, 48x48 pixel perfect and editable stroke
Free with trial An detailed set of professional financial line graphs and business reporting icons for data visualization and statistics. Set financial growth decrease vectors Professional financial line graphs and business reporting icons
Free with trial An open notebook displays two pages of business data visualization with a vertical bar graph on the left page featuring green, red, and blue bars alongside a central pie chart divided into red, blue, and green segments showing 70% in red with upward and downward arrows indicating percentage changes, all set against a clean white background ideal for concepts of analytics, financial reporting,. Set financial growth decrease illustrations Business data analysis shown in an open notebook with colorful bar graph and pie chart illustrating statistics and percentages. An open notebook displays two pages of business data visualization with a vertical bar graph on the left page featuring green, red, and blue bars alongside a central pie chart divided into red, blue, and green segments showing 70% in red with upward and downward arrows indicating percentage changes, all set against a clean white background ideal for concepts of analytics, financial reporting,
Free with trial This is an detailed collection of line icons depicting market fluctuations, financial downturns, recovery patterns, and technical analysis indicators. Set financial growth decrease vectors Market volatility and financial loss icons with bull and bear market cycle symbols. This is an detailed collection of line icons depicting market fluctuations, financial downturns, recovery patterns, and technical analysis indicators
Free with trial This 3D illustration depicts a financial report represented by a document with a bar chart and a line graph. The bar chart shows alternating red and blue bars, while a blue line graph with an upward arrow indicates a positive trend. A yellow and purple magnifying glass is positioned over the chart, suggesting analysis and scrutiny. The artwork is set against a subtle light purple background. Set financial growth decrease illustrations 3D illustration of a financial report with a magnifying glass and bar chart on a light purple background. This 3D illustration depicts a financial report represented by a document with a bar chart and a line graph. The bar chart shows alternating red and blue bars, while a blue line graph with an upward arrow indicates a positive trend. A yellow and purple magnifying glass is positioned over the chart, suggesting analysis and scrutiny. The artwork is set against a subtle light purple background
Free with trial Silhouettes depict male figures interacting with downward-pointing arrows, symbolizing business loss or decline. One figure gestures towards a large arrow, another walks alongside it. The minimalist design uses solid black on a white background, emphasizing the concept of financial reduction or setbacks. Arrow sizes vary, enhancing the visual representation of movement or direction. Set financial growth decrease vectors A set of Business Loss Concept with Male Figure. Silhouettes depict male figures interacting with downward-pointing arrows, symbolizing business loss or decline. One figure gestures towards a large arrow, another walks alongside it. The minimalist design uses solid black on a white background, emphasizing the concept of financial reduction or setbacks. Arrow sizes vary, enhancing the visual representation of movement or direction.
Free with trial Silhouettes depict male figures interacting with downward-pointing arrows, symbolizing business loss or decline. One figure gestures towards a large arrow, another walks alongside it. The minimalist design uses solid black on a white background, emphasizing the concept of financial reduction or setbacks. Arrow sizes vary, enhancing the visual representation of movement or direction. Set financial growth decrease vectors A set of Business Loss Concept with Male Figure. Silhouettes depict male figures interacting with downward-pointing arrows, symbolizing business loss or decline. One figure gestures towards a large arrow, another walks alongside it. The minimalist design uses solid black on a white background, emphasizing the concept of financial reduction or setbacks. Arrow sizes vary, enhancing the visual representation of movement or direction.
Free with trial Silhouettes depict male figures interacting with downward-pointing arrows, symbolizing business loss or decline. One figure gestures towards a large arrow, another walks alongside it. The minimalist design uses solid black on a white background, emphasizing the concept of financial reduction or setbacks. Arrow sizes vary, enhancing the visual representation of movement or direction. Set financial growth decrease vectors A set of Business Loss Concept with Male Figure. Silhouettes depict male figures interacting with downward-pointing arrows, symbolizing business loss or decline. One figure gestures towards a large arrow, another walks alongside it. The minimalist design uses solid black on a white background, emphasizing the concept of financial reduction or setbacks. Arrow sizes vary, enhancing the visual representation of movement or direction.
Free with trial Silhouettes depict male figures interacting with downward-pointing arrows, symbolizing business loss or decline. One figure gestures towards a large arrow, another walks alongside it. The minimalist design uses solid black on a white background, emphasizing the concept of financial reduction or setbacks. Arrow sizes vary, enhancing the visual representation of movement or direction. Set financial growth decrease vectors A set of Business Loss Concept with Male Figure. Silhouettes depict male figures interacting with downward-pointing arrows, symbolizing business loss or decline. One figure gestures towards a large arrow, another walks alongside it. The minimalist design uses solid black on a white background, emphasizing the concept of financial reduction or setbacks. Arrow sizes vary, enhancing the visual representation of movement or direction.
Free with trial Silhouettes depict male figures interacting with downward-pointing arrows, symbolizing business loss or decline. One figure gestures towards a large arrow, another walks alongside it. The minimalist design uses solid black on a white background, emphasizing the concept of financial reduction or setbacks. Arrow sizes vary, enhancing the visual representation of movement or direction. Set financial growth decrease vectors A set of Business Loss Concept with Male Figure. Silhouettes depict male figures interacting with downward-pointing arrows, symbolizing business loss or decline. One figure gestures towards a large arrow, another walks alongside it. The minimalist design uses solid black on a white background, emphasizing the concept of financial reduction or setbacks. Arrow sizes vary, enhancing the visual representation of movement or direction.
Free with trial A red graph with a downward trend, indicating a decline or decrease, set against a grid background with a prominent red arrow pointing downwards, symbolizing a significant drop or loss. Set financial growth decrease illustrations Financial downturn indicated by red graph and downward arrow on grid background. A red graph with a downward trend, indicating a decline or decrease, set against a grid background with a prominent red arrow pointing downwards, symbolizing a significant drop or loss
Free with trial Debit card, Euro currency and Loan percent line icons set. Handshake deal, research and promotion complex icons. Statistics timer sign. Wallet with credit card, Eur banking, Discount blueprint. Vector. Set financial growth decrease vectors Debit card, Euro currency and Loan percent icons set. Statistics timer sign. Vector. Debit card, Euro currency and Loan percent line icons set. Handshake deal, research and promotion complex icons. Statistics timer sign. Wallet with credit card, Eur banking, Discount blueprint. Vector
Free with trial Set of vector chart and graph icons for infographic. Thin line diagrams for business report or presentation. Set financial growth decrease vectors Set of vector chart
Free with trial Up and down arrow icon set with long shadow. Upward and downward sign symbol. Set financial growth decrease vectors Up and down arrow icon set with long shadow
Free with trial Cost symbol dollar increase icon isolated on white background. Set icons colorful. Simple vector logo. Set financial growth decrease vectors Cost symbol dollar increase icon isolated on white background. Set icons colorful
Free with trial A striking 3D percentage symbol rendered in an intricate wireframe or mesh design, showcasing a vibrant rainbow gradient. The colors transition smoothly from cool blues and greens to warm reds and purples, creating a dynamic and modern visual. Set against a clean, pure white background, the symbol casts a subtle shadow, adding depth. This eye-catching graphic is ideal for conveying concepts of discounts, sales, growth, statistics, data analysis, financial progress, or any topic requiring a modern, dynamic, and colorful representation of percentages. Perfect for business, marketing, technology, or educational designs. Set financial growth decrease illustrations Vibrant Rainbow Wireframe Percentage Symbol on White. A striking 3D percentage symbol rendered in an intricate wireframe or mesh design, showcasing a vibrant rainbow gradient. The colors transition smoothly from cool blues and greens to warm reds and purples, creating a dynamic and modern visual. Set against a clean, pure white background, the symbol casts a subtle shadow, adding depth. This eye-catching graphic is ideal for conveying concepts of discounts, sales, growth, statistics, data analysis, financial progress, or any topic requiring a modern, dynamic, and colorful representation of percentages. Perfect for business, marketing, technology, or educational designs.
Free with trial Set of vector chart and graph icons for infographic. Thin line diagrams for business report or presentation. Set financial growth decrease vectors Set of vector chart. Set of vector chart and graph icons for infographic. Thin line diagrams for business report or presentation.
Free with trial Set of vector money icons, growth and fall chart in doodle style. Hand drawn dollar coins. Set financial growth decrease vectors Set of vector money icons. Set of vector money icons, growth and fall chart in doodle style. Hand drawn dollar coins.
Free with trial Two contrasting icons depict upward trends. On the left, a black percentage symbol inside a circle overlaps with two ascending black arrows on a white background. On the right, the design is reversed: a white percentage symbol and arrows on a black background. Both icons illustrate concepts of growth or increase, commonly associated with financial or statistical data. Set financial growth decrease vectors Increase Icon. Solid glyph series icon. Two contrasting icons depict upward trends. On the left, a black percentage symbol inside a circle overlaps with two ascending black arrows on a white background. On the right, the design is reversed: a white percentage symbol and arrows on a black background. Both icons illustrate concepts of growth or increase, commonly associated with financial or statistical data.
Free with trial A 3D illustration representing financial concepts. It features a white document with a pink dollar sign and blue horizontal lines indicating text. A purple clock with white hands sits to the right, and a teal arrow curves downwards from the left, pointing towards the clock. The composition is set against a soft blue background with subtle shadow effects. Set financial growth decrease illustrations 3D Illustration Of Financial Document With Dollar Sign Clock And Downward Arrow Keywords: finance, money, dollar sign, document. A 3D illustration representing financial concepts. It features a white document with a pink dollar sign and blue horizontal lines indicating text. A purple clock with white hands sits to the right, and a teal arrow curves downwards from the left, pointing towards the clock. The composition is set against a soft blue background with subtle shadow effects
Free with trial Up and down arrow icon set on circle line. Upward and downward direction. Set financial growth decrease vectors Up and down arrow icon set on circle line
Free with trial Set of chart icons with dollar sign in even silhouette on a white background. The graph shows downward and upward trends. Vector. Set financial growth decrease vectors Set of graphic icons with dollar. Set of chart icons with dollar sign in even silhouette on a white background. The graph shows downward and upward trends. Vector
Free with trial A set of twenty-two black chart icons, illustrating various graph types on a white background. The icons feature line graphs, bar graphs, and pie charts, each depicting trends such as growth, decline, and fluctuations. Magnifying glass icons are used to represent analysis. The charts convey concepts of data visualization, statistical analysis, and business metrics tracking. The minimalistic design is characterized by simple, clean lines and solid fill, suitable for use in reports, presentations, or digital interfaces. Set financial growth decrease vectors Increase and decrease glyph solid icons collection. A set of twenty-two black chart icons, illustrating various graph types on a white background. The icons feature line graphs, bar graphs, and pie charts, each depicting trends such as growth, decline, and fluctuations. Magnifying glass icons are used to represent analysis. The charts convey concepts of data visualization, statistical analysis, and business metrics tracking. The minimalistic design is characterized by simple, clean lines and solid fill, suitable for use in reports, presentations, or digital interfaces.
Free with trial Line icons set. Finance pack. Vector illustration. Web and Ui-UX Collection. Set financial growth decrease vectors Line icons set. Finance pack. Vector Batch. Line icons set. Finance pack. Vector illustration. Web and Ui-UX Collection