Free with trial A comprehensive vector icon set featuring essential symbols for business, finance, time management, and status indicators. The collection includes icons representing growth, trends, success, failure, deadlines, time tracking, and financial assets like coin stacks and currency. Designed in a clean, flat style, these versatile pictograms are ideal for web interfaces, mobile applications, presentations, infographics, and various digital projects requiring clear visual communication of progress, results, and financial concepts. Perfect for illustrating reports, dashboards, or user feedback. Set financial growth decrease vectors Business, Time, and Financial Status Vector Icons Set. A comprehensive vector icon set featuring essential symbols for business, finance, time management, and status indicators. The collection includes icons representing growth, trends, success, failure, deadlines, time tracking, and financial assets like coin stacks and currency. Designed in a clean, flat style, these versatile pictograms are ideal for web interfaces, mobile applications, presentations, infographics, and various digital projects requiring clear visual communication of progress, results, and financial concepts. Perfect for illustrating reports, dashboards, or user feedback.
Free with trial A professional set of icons depicting various data chart types, including exponential growth, volatility, and linear trends for business analytics and reporting. Set financial growth decrease illustrations Collection of professional data graph icons illustrating different growth patterns and financial statistics trends. a professional set of icons depicting various data chart types, including exponential growth, volatility, and linear trends for business analytics and reporting
Free with trial This minimalist vector illustration features two identical line graphs, presented in contrasting black and white themes. The left graph displays a black line on a white background, while the right shows a white line on a black background. Both graphs depict a clear downward trend with jagged fluctuations, symbolizing decline, loss, or negative growth over time. This versatile icon set is ideal for illustrating concepts such as economic downturns, financial losses, market crashes, business failures, or any data showing a significant decrease. Perfect for presentations, reports, infographics, and web design. Set financial growth decrease vectors Declining Line Graph Icon Set - Black and White. This minimalist vector illustration features two identical line graphs, presented in contrasting black and white themes. The left graph displays a black line on a white background, while the right shows a white line on a black background. Both graphs depict a clear downward trend with jagged fluctuations, symbolizing decline, loss, or negative growth over time. This versatile icon set is ideal for illustrating concepts such as economic downturns, financial losses, market crashes, business failures, or any data showing a significant decrease. Perfect for presentations, reports, infographics, and web design.
Free with trial A diverse set of icons representing financial growth, market trends, and business analytics, including line graphs, bar charts, pie charts, and currency symbols. Set financial growth decrease vectors Collection of Financial and Business Growth Icons and Charts. A diverse set of icons representing financial growth, market trends, and business analytics. A diverse set of icons representing financial growth, market trends, and business analytics, including line graphs, bar charts, pie charts, and currency symbols
Free with trial This financial data illustration set features a stack of coins with a dollar sign alongside euro and pound currency stacks on the left, while the right side displays six analytical graphs including a blue downward trend graph, a green upward trend graph, a dual-color bar graph representing growth or decline, a bar graph with a green upward arrow indicating value increase, a pound coin illustration. Set financial growth decrease illustrations Set of four financial data illustrations showing currency stacks and business graphs with trends for investment analysis and. This financial data illustration set features a stack of coins with a dollar sign alongside euro and pound currency stacks on the left, while the right side displays six analytical graphs including a blue downward trend graph, a green upward trend graph, a dual-color bar graph representing growth or decline, a bar graph with a green upward arrow indicating value increase, a pound coin illustration
Free with trial A collection of simple, business and growth icons, perfect for financial reports, websites, or presentations on market trends and data. The set features a clean, minimal, thin line style. Set financial growth decrease vectors Simple business and growth icons set, thin line style, minimal vector illustration perfect for financial reports, websites, or pre. A collection of simple, business and growth icons, perfect for financial reports, websites, or presentations on market trends and data. The set features a clean, minimal, thin line style.
Free with trial This is an detailed collection of financial icons depicting various stock market trends, growth curves, and data analysis patterns. Set financial growth decrease vectors Financial data and stock market trend line icons set showing growth and volatility curves. This is an detailed collection of financial icons depicting various stock market trends, growth curves, and data analysis patterns
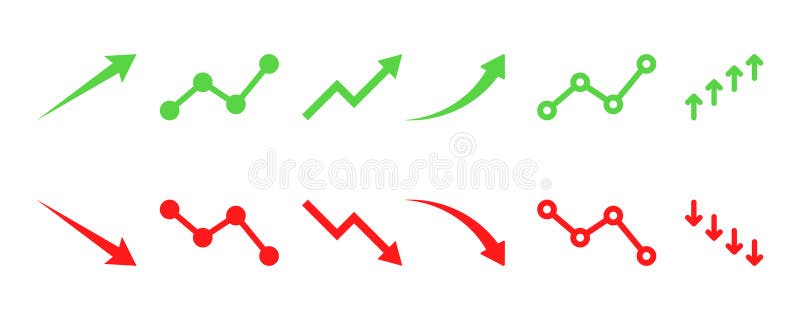
Free with trial Set of financial arrows up and down. Green and red arrows with shadow. Increase and decrease. Vector 10 EPS. Set financial growth decrease illustrations Set of financial arrows up and down. Green and red arrows with shadow.
Free with trial Set of financial arrows up and down. Green and red arrows. Increase and decrease. Vector 10 EPS. Set financial growth decrease illustrations Set of financial arrows up and down. Green and red arrows.
Free with trial Set line Mobile phone Magnifying glass with check mark Laptop browser window Secure your site HTTPS SSL Financial growth decrease Browser shield and Online shopping screen icon. Vector. Set financial growth decrease illustrations Set line Mobile phone, Magnifying glass with check mark, Laptop browser window, Secure your site HTTPS, SSL, Financial. Set line Mobile phone Magnifying glass with check mark Laptop browser window Secure your site HTTPS SSL Financial growth decrease Browser shield and Online shopping screen icon. Vector.
Free with trial A collection of hand-drawn, black and white icons representing growth, decline, and financial concepts. The set includes upward and downward arrows, percentage symbols, and a bar graph illustrating trends. The simple line art style makes these icons versatile for various applications, including presentations, infographics, and website design. They convey concepts of progress, success, loss, and market fluctuations. Set financial growth decrease illustrations Growth and Decline Icons Set. A collection of hand-drawn, black and white icons representing growth, decline, and financial concepts. The set includes upward and downward arrows, percentage symbols, and a bar graph illustrating trends. The simple line art style makes these icons versatile for various applications, including presentations, infographics, and website design. They convey concepts of progress, success, loss, and market fluctuations.
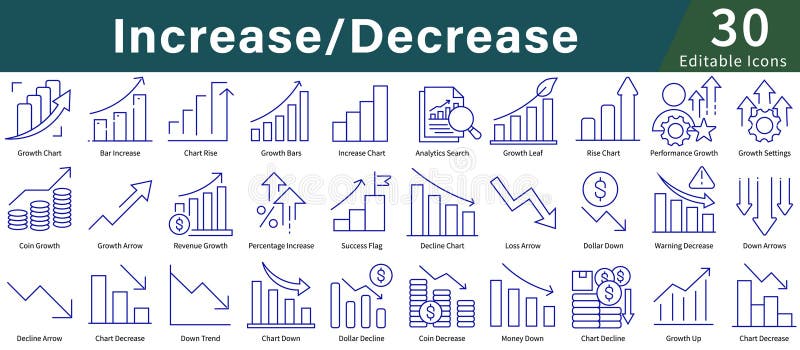
Free with trial Icons illustrating concepts of "Increase Decrease," using simple blue line art. Features include graphs and charts with upward and downward arrows, coins, dollar symbols, and percentage signs. Icons depict growth, decline, analytics, and performance tracking. Suitable for business, finance, or data analysis themes, these icons provide a visual representation of financial trends and statistics, making abstract concepts clear and easily understandable. The design is minimalistic and user-friendly, aimed at enhancing clarity in presentations and reports. Set financial growth decrease vectors Increase Decrease Icon Set in Line Style with Editable Vector for Growth, Analytics, Charts, and Data Visualization. Icons illustrating concepts of "Increase Decrease," using simple blue line art. Features include graphs and charts with upward and downward arrows, coins, dollar symbols, and percentage signs. Icons depict growth, decline, analytics, and performance tracking. Suitable for business, finance, or data analysis themes, these icons provide a visual representation of financial trends and statistics, making abstract concepts clear and easily understandable. The design is minimalistic and user-friendly, aimed at enhancing clarity in presentations and reports.
Free with trial Business Analytics And Data Visualization Line Icon Set. Financial Growth, Market Trends, And Performance Analysis Outline Symbol Collection. Editable Stroke. Isolated Vector Illustration. Set financial growth decrease vectors Business Analytics And Data Visualization Line Icon Set. Financial Growth, Market Trends, And Performance Analysis
Free with trial Percentage rate arrow icon set. Percent arrow up and down symbol. Price increase and decrease vector illustration. Profit sign. Up and down arrows with percentage pictogram. Financial growth concept. Set financial growth decrease vectors Percentage rate arrow icon set. Percent arrow up and down symbol. Price increase and decrease vector illustration. Profit sign. Up
Free with trial A set of hand-drawn financial graph and chart icons. These icons are suitable for business analysis, investment strategies, and economic growth presentations. Set financial growth decrease vectors Vector art of hand drawn financial graph and chart icons for business analysis, investment, and economic growth in vector format. A set of hand-drawn financial graph and chart icons. These icons are suitable for business analysis, investment strategies, and economic growth presentations
Free with trial Set line Website with stocks market Search engine Browser setting Financial growth increase window Photo retouching and mail and icon. Vector. Set financial growth decrease vectors Set line Website with stocks market, Search engine, Browser setting, Financial growth increase, window, Photo retouching. Set line Website with stocks market Search engine Browser setting Financial growth increase window Photo retouching and mail and icon. Vector.
Free with trial A set of line art icons illustrating financial growth, investment strategies, and market analysis, perfect for business presentations and reports with clean design. Set financial growth decrease vectors Vector art of line art icons depicting financial growth, investment strategies, and market analysis, ideal for illustrating. A set of line art icons illustrating financial growth, investment strategies, and market analysis, perfect for business presentations and reports with clean design
Free with trial A set of linear icons depicting financial growth, including upward arrows, charts, and currency symbols, representing economic progress and investment trends on white. Set financial growth decrease vectors Vector art of financial growth icons a collection of symbols representing economic progress, investment, and market trends. A set of linear icons depicting financial growth, including upward arrows, charts, and currency symbols, representing economic progress and investment trends on white
Free with trial Set line Digital speed meter Arrow Financial growth Dollar symbol Mountains with flag and Intersection point icon. Vector. Set financial growth decrease vectors Set line Digital speed meter, Arrow, Financial growth, Dollar symbol, Mountains with flag, and Intersection point icon
Free with trial A set of financial growth and decline chart icons featuring up and down arrows with colorful bars, indicating economic trends. the concept of financial market increases, decreases and fluctuations. Set financial growth decrease vectors Set of Financial Fluctuation Chart Icons in Flat Design. A set of financial growth and decline chart icons featuring up and down arrows with colorful bars, indicating economic trends. the concept of financial market increases, decreases and fluctuations
Free with trial A set of currency growth and decline icons featuring stacks of coins and directional arrows, indicating financial increases and decreases. concepts of economic growth, losses and currency fluctuations. Set financial growth decrease vectors Money Growth and Decrease Icons with Coins and Up Down Arrows. A set of currency growth and decline icons featuring stacks of coins and directional arrows, indicating financial increases and decreases. concepts of economic growth, losses and currency fluctuations
Free with trial Four stylized arrows on a white background, two green and two red. The green arrows curve upwards with a smooth, sweeping motion. The red arrows feature a zigzag pattern before pointing upwards. Positioned in a circular arrangement, alternating colors suggest dynamics of growth and decline, often used in business or financial contexts. The minimalistic style is suitable for illustrating trends or cycles. Set financial growth decrease vectors Up and Down Arrow Icons Set for Growth and Decline. Four stylized arrows on a white background, two green and two red. The green arrows curve upwards with a smooth, sweeping motion. The red arrows feature a zigzag pattern before pointing upwards. Positioned in a circular arrangement, alternating colors suggest dynamics of growth and decline, often used in business or financial contexts. The minimalistic style is suitable for illustrating trends or cycles.
Free with trial A modern flat design graphic set featuring two icons: opposing arrows indicating increase decrease and a bar chart showing financial growth or decline, perfect for business concepts. Set financial growth decrease vectors Increase and decrease arrows with bar chart icon. A modern flat design graphic set featuring two icons: opposing arrows indicating increase decrease and a bar chart showing financial growth or decline, perfect for business concepts
Free with trial Vector cartoon 3d percent up and down icon set. Realistic growth, downward percentage red, green sign with arrow. Minimal 3d render rate symbol collection for business chart, financial banking app. Set financial growth decrease vectors Vector cartoon 3d percent up and down icon set. Realistic growth, downward percentage red, green sign with arrow
Free with trial A comprehensive set of vector line icons depicting bull and bear market trends. This collection features various combinations of bull and bear silhouettes integrated with financial charts, including rising and falling line graphs and bar graphs. Each icon clearly symbolizes either a bullish market (growth, upward trend) or a bearish market (decline, downward trend). Ideal for financial websites, trading applications, investment presentations, economic reports, infographics, and educational materials illustrating stock market dynamics and investment strategies. Set financial growth decrease vectors Bull and Bear Market Stock Trading Line Icons Set. A comprehensive set of vector line icons depicting bull and bear market trends. This collection features various combinations of bull and bear silhouettes integrated with financial charts, including rising and falling line graphs and bar graphs. Each icon clearly symbolizes either a bullish market (growth, upward trend) or a bearish market (decline, downward trend). Ideal for financial websites, trading applications, investment presentations, economic reports, infographics, and educational materials illustrating stock market dynamics and investment strategies.
Free with trial Financial realistic color set with money and budget symbols isolated vector illustration. Set financial growth decrease vectors Financial Color Set. Financial realistic color set with money and budget symbols isolated vector illustration
Free with trial Colorful pie chart is showing positive statistics and business growth, target and financial analysis and marketing report, data with copy space. Set financial growth decrease vectors Colorful pie chart is showing positive statistics and business growth, target and financial analysis and marketing
Free with trial A collection of financial icons representing various aspects of money management, investment, and financial planning. The set includes illustrations of coin stacks with arrows, bar graphs with magnifying glass, a financial planning chart, a bitcoin symbol, cash and coins, a hand putting a coin into a piggy bank, a debt payment chart, and a growth chart with coins. Suitable for illustrating articles, presentations, and websites related to finance, investment, and economics. Set financial growth decrease vectors Financial Planning and Investment Icons Set. A collection of financial icons representing various aspects of money management, investment, and financial planning. The set includes illustrations of coin stacks with arrows, bar graphs with magnifying glass, a financial planning chart, a bitcoin symbol, cash and coins, a hand putting a coin into a piggy bank, a debt payment chart, and a growth chart with coins. Suitable for illustrating articles, presentations, and websites related to finance, investment, and economics.
Free with trial A comprehensive collection of flat line design icons representing key concepts in business, finance, and data analytics. The set includes various charts (bar, line, pie), a speedometer, a magnifying glass with a graph, financial documents with checkmarks, a target with an arrow, a dollar sign, a percentage symbol, and directional arrows for growth and decline. These versatile vector elements are ideal for presentations, reports, websites, and applications focused on statistics, performance, strategy, and financial insights. Set financial growth decrease illustrations Business and Data Analytics Flat Line Icons Set. A comprehensive collection of flat line design icons representing key concepts in business, finance, and data analytics. The set includes various charts (bar, line, pie), a speedometer, a magnifying glass with a graph, financial documents with checkmarks, a target with an arrow, a dollar sign, a percentage symbol, and directional arrows for growth and decline. These versatile vector elements are ideal for presentations, reports, websites, and applications focused on statistics, performance, strategy, and financial insights.
Free with trial A comprehensive vector icon set featuring essential symbols for business, finance, and data analysis. This collection includes various arrows for indicating growth and decline, wavy lines representing market trends, checkmarks for success or approval, X marks for errors or rejection, stopwatches for time management and efficiency, and stacks of coins with dollar signs for financial concepts. Ideal for presentations, infographics, web design, and reports to visually communicate progress, status, and economic indicators. Set financial growth decrease vectors Business, Finance, and Data Analytics Vector Icon Set. A comprehensive vector icon set featuring essential symbols for business, finance, and data analysis. This collection includes various arrows for indicating growth and decline, wavy lines representing market trends, checkmarks for success or approval, X marks for errors or rejection, stopwatches for time management and efficiency, and stacks of coins with dollar signs for financial concepts. Ideal for presentations, infographics, web design, and reports to visually communicate progress, status, and economic indicators.
Free with trial Business growth and decline icon in black circle. Up and down trend chart symbol illustration. Increase and decrease bar graph concept. Set financial growth decrease vectors Business growth and decline icon in black circle. Up and down trend chart symbol. Increase and decrease bar graph concept
Free with trial A 3D render illustrating a concept of financial decline and economic recession. The image features a red bar chart with progressively shorter bars, indicating a downward trend. A bold, red arrow follows this negative trajectory, pointing sharply downwards. Set against a clean, neutral gray background, this graphic powerfully symbolizes concepts like business failure, stock market crash, investment loss, sales decrease, and economic crisis. It's a perfect visual for presentations, reports, and articles discussing financial downturns, poor performance, and negative growth. Set financial growth decrease illustrations Financial Decline Graph with Red Arrow Down. A 3D render illustrating a concept of financial decline and economic recession. The image features a red bar chart with progressively shorter bars, indicating a downward trend. A bold, red arrow follows this negative trajectory, pointing sharply downwards. Set against a clean, neutral gray background, this graphic powerfully symbolizes concepts like business failure, stock market crash, investment loss, sales decrease, and economic crisis. It's a perfect visual for presentations, reports, and articles discussing financial downturns, poor performance, and negative growth.
Free with trial Inflation pictogram group. Set of growth and fall signs, income and profit signs. Dollar sign. Charts, notifications, messages. Set financial growth decrease vectors Inflation pictogram group. Set of growth and fall signs, income and profit signs. Dollar sign. Charts, notifications, messages.
Free with trial Set Browser window Graph chart infographic Cloud technology data transfer upload Mobile phone incognito and Financial growth decrease icon. Vector. Set financial growth decrease illustrations Set Browser window, Graph chart infographic, Cloud technology data transfer, upload, Mobile phone, incognito and. Set Browser window Graph chart infographic Cloud technology data transfer upload Mobile phone incognito and Financial growth decrease icon. Vector.
Free with trial A comprehensive collection of hand-drawn business and data visualization icons. This doodle-style set features a variety of essential elements, including different types of arrows, bar graphs, line charts, and pie charts. The sketchy, black and white illustrations are perfect for infographics, presentations, financial reports, and marketing materials. Each icon is isolated on a white background, representing concepts like growth, statistics, process flow, and direction. This versatile vector set is ideal for adding a creative, hand-made touch to any project related to analytics, finance, or strategy. Set financial growth decrease illustrations Hand Drawn Business and Finance Doodle Icon Set. A comprehensive collection of hand-drawn business and data visualization icons. This doodle-style set features a variety of essential elements, including different types of arrows, bar graphs, line charts, and pie charts. The sketchy, black and white illustrations are perfect for infographics, presentations, financial reports, and marketing materials. Each icon is isolated on a white background, representing concepts like growth, statistics, process flow, and direction. This versatile vector set is ideal for adding a creative, hand-made touch to any project related to analytics, finance, or strategy.
Free with trial Set line Secure your site with HTTPS SSL Browser window Cloud technology data transfer Online play video Photo retouching Financial growth decrease and Digital speed meter icon. Vector. Set financial growth decrease illustrations Set line Secure your site with HTTPS, SSL, Browser window, Cloud technology data transfer, Online play video, Photo. Set line Secure your site with HTTPS SSL Browser window Cloud technology data transfer Online play video Photo retouching Financial growth decrease and Digital speed meter icon. Vector.
Free with trial Collection of business growth and financial analysis icons featuring bar charts and arrows with editable line art and flat shape style. Editable vector icon set. Set financial growth decrease vectors Collection of business growth and financial analysis icons featuring bar charts and arrows with editable line art and flat shape
Free with trial Financial arrows up and down. Financial growth and decline. Graph with green and red arrows. Finance diagram, graphic charts icon set. Set financial growth decrease vectors Financial arrows up and down. Financial growth and decline. Graph with green and red arrows. Finance diagram, graphic charts icon
Free with trial Abstract 3D render of a financial growth chart. The image features a series of vertical bars, some in teal and others in orange, representing data points on a graph. The bars increase in height towards the right, suggesting positive growth or progress. The chart is set against a dark background with a subtle grid pattern and a reflective surface, adding depth and visual interest. Suitable for illustrating financial reports, market analysis, or business trends. Set financial growth decrease illustrations Abstract Financial Growth Chart. Abstract 3D render of a financial growth chart. The image features a series of vertical bars, some in teal and others in orange, representing data points on a graph. The bars increase in height towards the right, suggesting positive growth or progress. The chart is set against a dark background with a subtle grid pattern and a reflective surface, adding depth and visual interest. Suitable for illustrating financial reports, market analysis, or business trends.
Free with trial Rate showing extensive set of dark gray illustrating financial graphs charts and data analysis symbols keywords: financial, graphs, charts, data. Set financial growth decrease illustrations Extensive Set of Dark Gray Illustrating Financial Graphs Charts and Data Analysis Symbols Keywords: financial
Free with trial A comprehensive set of minimalist linear icons depicting financial analytics and business trends, featuring stacks of coins and both upward and downward trending bar charts. Set financial growth decrease vectors Linear Business and Financial Growth Icon Set for Analytics, Investment, and Economic Trend Visualization. A comprehensive set of minimalist linear icons depicting financial analytics and business trends, featuring stacks of coins and both upward and downward trending bar charts.
Free with trial Set of 16 black and white graph icons in a 4x4 grid. Each icon depicts variations of bar charts with upward and downward arrows, suggesting growth or decline. Some include additional elements like magnifying glasses, checkmarks, and data points connected by lines. Icons vary slightly in design, representing different data trends with simple, bold lines on a white background, ideal for business and statistical representation. Set financial growth decrease vectors Graph icon set. Increase and decrease graph icon. Growth icon. Graph chart icons. Icon set. 16 icons. Set of 16 black and white graph icons in a 4x4 grid. Each icon depicts variations of bar charts with upward and downward arrows, suggesting growth or decline. Some include additional elements like magnifying glasses, checkmarks, and data points connected by lines. Icons vary slightly in design, representing different data trends with simple, bold lines on a white background, ideal for business and statistical representation.
Free with trial This vibrant vector illustration showcases a collection of red and orange gradient arrows, all pointing downwards. The set includes both straight and dynamically curved arrows, effectively symbolizing various forms of decline, decrease, or negative trends. Perfect for use in business presentations, financial reports, infographics, or any design requiring a clear visual representation of falling statistics, market drops, recession, loss, or a general downward movement. The clean, modern flat design ensures versatility and impact. Set financial growth decrease vectors Downward Trend Red Gradient Arrows Vector Set. This vibrant vector illustration showcases a collection of red and orange gradient arrows, all pointing downwards. The set includes both straight and dynamically curved arrows, effectively symbolizing various forms of decline, decrease, or negative trends. Perfect for use in business presentations, financial reports, infographics, or any design requiring a clear visual representation of falling statistics, market drops, recession, loss, or a general downward movement. The clean, modern flat design ensures versatility and impact.
Free with trial A comprehensive set of line icons illustrating investment attraction and market notifications. Icons feature money magnets, growth sprouts, piggy banks with brain symbols, and various notification bells for price alerts. Ideal for stock trading applications, investment advice blogs, and financial education materials that focus on wealth accumulation, strategy building, and staying. Set financial growth decrease vectors Financial Attraction and Market Alert Icon Set. A comprehensive set of line icons illustrating investment attraction and market notifications. Icons feature money magnets, growth sprouts, piggy banks with brain symbols, and various notification bells for price alerts. Ideal for stock trading applications, investment advice blogs, and financial education materials that focus on wealth accumulation, strategy building, and staying
Free with trial A dynamic collection of eight distinct dollar sign symbols, each uniquely rendered in a bold, grunge, and street art style. Featuring dripping ink effects, distressed textures, and halftone patterns, these black and white icons are integrated with various arrows depicting financial trends. The arrows illustrate upward growth, downward decline, and fluctuating market movements, conveying concepts of profit, loss, and economic change. This versatile set is perfect for modern designs related to finance, investment, business, and urban culture, suitable for web, print, and creative projects. Set financial growth decrease vectors Grunge Dollar Signs with Financial Trend Arrows Set. A dynamic collection of eight distinct dollar sign symbols, each uniquely rendered in a bold, grunge, and street art style. Featuring dripping ink effects, distressed textures, and halftone patterns, these black and white icons are integrated with various arrows depicting financial trends. The arrows illustrate upward growth, downward decline, and fluctuating market movements, conveying concepts of profit, loss, and economic change. This versatile set is perfect for modern designs related to finance, investment, business, and urban culture, suitable for web, print, and creative projects.
Free with trial A dynamic 3D visualization of financial data, featuring an upward trending blue arrow graph, a series of white and blue bar graphs, and two pie charts. The composition is set against a dark blue, grid-like background, symbolizing data analysis, business growth, and financial success. This image is ideal for presentations, reports, and websites related to finance, economics, and market trends. Set financial growth decrease illustrations 3D Financial Growth Chart with Pie Charts and Bar Graph. A dynamic 3D visualization of financial data, featuring an upward trending blue arrow graph, a series of white and blue bar graphs, and two pie charts. The composition is set against a dark blue, grid-like background, symbolizing data analysis, business growth, and financial success. This image is ideal for presentations, reports, and websites related to finance, economics, and market trends.
Free with trial A dynamic collection of hand-drawn financial and trend-related symbols rendered in a grunge, brush-stroke style. This illustration features various dollar signs, upward and downward arrows, a zig-zag chart line, checkmarks, and crosses. The black-on-white design conveys concepts of business growth, economic trends, profit, loss, success, and decision-making. Ideal for presentations, reports, infographics, or any design project requiring a raw, energetic visual representation of financial data and market fluctuations. Set financial growth decrease vectors Grunge Hand Drawn Financial Growth and Decline Symbols Set. A dynamic collection of hand-drawn financial and trend-related symbols rendered in a grunge, brush-stroke style. This illustration features various dollar signs, upward and downward arrows, a zig-zag chart line, checkmarks, and crosses. The black-on-white design conveys concepts of business growth, economic trends, profit, loss, success, and decision-making. Ideal for presentations, reports, infographics, or any design project requiring a raw, energetic visual representation of financial data and market fluctuations.
Free with trial An detailed set of stock market financial trends and business growth line icons for data analysis and reporting. Set financial growth decrease vectors Stock market financial trends and business growth line icons
Free with trial Collection of various business and financial chart icons in a modern, flat style, set against a dark blue background. Perfect for infographics, presentations, and websites requiring data visualization elements. Set financial growth decrease illustrations Business and Financial Icons Set on Dark Blue Background for Design Elements. Collection of various business and financial chart icons in a modern, flat style, set against a dark blue background. Perfect for infographics, presentations, and websites requiring data visualization elements
Free with trial A collection of six distinct financial icons representing concepts like money, exchange, growth, and investment. Perfect for business, finance, and economic presentations. Set financial growth decrease illustrations Financial icons set money bag graph arrows coin exchange and growth concepts. A collection of six distinct financial icons representing concepts like money, exchange, growth, and investment. Perfect for business, finance, and economic presentations
Free with trial A grid of thin line icons illustrating business growth and financial concepts, featuring charts, graphs, money symbols, and people. Set financial growth decrease illustrations Business Growth and Financial Analytics Icon Collection with Charts and Money Keywords: business, growth, finance, analytics. A grid of thin line icons illustrating business growth and financial concepts, featuring charts, graphs, money symbols, and people
Free with trial Line art financial icons set featuring a businessman with money and a decrease in funds for financial management. Set financial growth decrease vectors Line art financial icons set featuring a businessman with money and a decrease in funds for financial management
Free with trial Modern financial icon set featuring dollar sign symbols with upward and downward arrows for business and economic concepts. Set financial growth decrease vectors Modern financial icon set featuring dollar sign symbols with upward and downward arrows for business and economic concepts
Free with trial Colorful pie chart is showing positive statistics and business growth, target and financial analysis and marketing report, data with copy space. Set financial growth decrease illustrations Colorful pie chart is showing positive statistics and business growth, target and financial analysis and marketing
Free with trial Growth and loss arrow icon on circle line. Increase and decrease sign symbol illustration. Set financial growth decrease vectors Growth and loss arrow icon on circle line. Increase and decrease sign symbol
Free with trial Growth and loss icon on black circle. Increase and decrease sign symbol. Zigzag arrows illustration concept. Set financial growth decrease vectors Growth and loss icon on black circle. Increase and decrease sign symbol. Zigzag arrows concept
Free with trial Interest growth icon vector logo set collection for web app ui. Set financial growth decrease vectors Interest Growth Icon Showing Financial Increase, Investment Success, and Economic Trends. Interest growth icon vector logo set collection for web app ui
Free with trial Set Browser window Cloud technology data transfer Laptop with browser setting Search engine Photo retouching Financial growth decrease and icon. Vector. Set financial growth decrease vectors Set Browser window, Cloud technology data transfer, Laptop with browser, setting, Search engine, Photo retouching. Set Browser window Cloud technology data transfer Laptop with browser setting Search engine Photo retouching Financial growth decrease and icon. Vector.
Free with trial A versatile set of business and finance icons isolated on a white background. This collection features various data visualization elements, including bar charts, line graphs, pie charts, and diagrams. The clean, vector style represents concepts like statistical analysis, market growth, financial reporting, and economic trends. These infographic elements are perfect for presentations, business reports, websites, and marketing materials to illustrate progress, performance, and data-driven insights. Set financial growth decrease vectors Business and Finance Chart and Graph Icon Set. A versatile set of business and finance icons isolated on a white background. This collection features various data visualization elements, including bar charts, line graphs, pie charts, and diagrams. The clean, vector style represents concepts like statistical analysis, market growth, financial reporting, and economic trends. These infographic elements are perfect for presentations, business reports, websites, and marketing materials to illustrate progress, performance, and data-driven insights.
Free with trial This vector icon set features graph diagrams with arrows indicating growth and decline. The icons represent business metrics and financial performance, with arrows pointing upward for growth and downward for decline. These symbols are ideal for visualizing trends, success, and changes in finance reports or business charts. The clean, simple design ensures clarity, making these icons suitable for use in presentations, reports, or dashboards to effectively communicate financial or business performance. Set financial growth decrease vectors Growing up and down vector icon set. Graph diagram with arrow. Business growth success chart. Finance report symbol. This vector icon set features graph diagrams with arrows indicating growth and decline. The icons represent business metrics and financial performance, with arrows pointing upward for growth and downward for decline. These symbols are ideal for visualizing trends, success, and changes in finance reports or business charts. The clean, simple design ensures clarity, making these icons suitable for use in presentations, reports, or dashboards to effectively communicate financial or business performance.
Free with trial Arrow percent icon set on black circle. Increase and decrease percentage sign symbol vector. Set financial growth decrease vectors Arrow percent icon set on black circle. Increase and decrease percentage sign symbol
Free with trial A clean and modern set of financial icons, perfect for illustrating business concepts. The image features icons representing profit growth, expense management, tax documents, and investment summaries. The illustrations use a simple, flat design with a limited color palette, making them versatile for various applications. Ideal for presentations, websites, infographics, and financial reports. The set highlights key financial aspects in an easily understandable visual format. Set financial growth decrease illustrations Financial Icons Set: Profit, Expenses, Tax, and Investment Analysis. A clean and modern set of financial icons, perfect for illustrating business concepts. The image features icons representing profit growth, expense management, tax documents, and investment summaries. The illustrations use a simple, flat design with a limited color palette, making them versatile for various applications. Ideal for presentations, websites, infographics, and financial reports. The set highlights key financial aspects in an easily understandable visual format.
Free with trial This image depicts a vibrant and modern representation of financial success, featuring 3D bar graphs, pie charts, and a calculator, all set against a clean white background. The upward-trending graph showcases growth and progress. Set financial growth decrease illustrations Colorful 3D Financial Charts and Calculator Showing Business Growth. This image depicts a vibrant and modern representation of financial success, featuring 3D bar graphs, pie charts, and a calculator, all set against a clean white background. The upward-trending graph showcases growth and progress.
Free with trial A human hand is shown presenting a vivid, glowing yellow percentage symbol, radiating light and prominence. In the background, a digital bar chart visually represents growth and data analysis, set against a dark, abstract backdrop with subtle bokeh lights. This image powerfully conveys concepts related to finance, interest rates, discounts, business growth, profit, and investment. It's perfect for illustrating financial reports, economic articles, banking promotions, or investment strategy presentations. Set financial growth decrease illustrations Financial Growth and Interest Rates Concept with Glowing Percentage Symbol. A human hand is shown presenting a vivid, glowing yellow percentage symbol, radiating light and prominence. In the background, a digital bar chart visually represents growth and data analysis, set against a dark, abstract backdrop with subtle bokeh lights. This image powerfully conveys concepts related to finance, interest rates, discounts, business growth, profit, and investment. It's perfect for illustrating financial reports, economic articles, banking promotions, or investment strategy presentations.
Free with trial Trend chart icon set. Growth and decline symbol. Up and down arrow with bar graph illustration. Set financial growth decrease vectors Trend chart icon set. Growth and decline symbol. Up and down arrow with bar graph
Free with trial A 3D illustration depicts a large white dollar sign centered on a vibrant purple circle. Two smaller white circles are positioned on either side of the purple circle. A green upward-pointing arrow is in the top right circle, signifying growth or increase, while a red downward-pointing arrow is in the bottom left circle, indicating decline or decrease. The composition is set against a clean white. Set financial growth decrease illustrations 3D Dollar Sign with Up and Down Arrows Indicating Financial Growth and Decline on White Background. A 3D illustration depicts a large white dollar sign centered on a vibrant purple circle. Two smaller white circles are positioned on either side of the purple circle. A green upward-pointing arrow is in the top right circle, signifying growth or increase, while a red downward-pointing arrow is in the bottom left circle, indicating decline or decrease. The composition is set against a clean white
Free with trial Set of cost symbol yuan increase and decrease icon. Money vector symbol isolated on background. Set financial growth decrease vectors Set of cost symbol yuan increase and decrease icon. Money vector symbol isolated on background
Free with trial Set of cost symbol pound increase and decrease icon. Money vector symbol isolated on background. Set financial growth decrease vectors Set of cost symbol pound increase and decrease icon. Money vector symbol isolated on background
Free with trial Business growth and decline icon in circular outline. Up and down trend chart symbol illustration. Increase and decrease bar graph concept. Set financial growth decrease vectors Business growth and decline icon in circular outline. Up and down trend chart symbol. Increase and decrease bar graph concept
Free with trial Set line Slot machine Playing card with clubs symbol Bottle of wine Casino signboard Online sports betting Financial growth decrease Hand holding casino chips and Football money icon. Vector. Set financial growth decrease vectors Set line Slot machine, Playing card with clubs symbol, Bottle of wine, Casino signboard, Online sports betting. Set line Slot machine Playing card with clubs symbol Bottle of wine Casino signboard Online sports betting Financial growth decrease Hand holding casino chips and Football money icon. Vector.
Free with trial Set line Casino chip with dollar Online sports betting chips poker table game Lottery ticket Playing card clubs symbol Financial growth decrease and American football money icon. Vector. Set financial growth decrease vectors Set line Casino chip with dollar, Online sports betting, chips, poker table game, Lottery ticket, Playing card clubs. Set line Casino chip with dollar Online sports betting chips poker table game Lottery ticket Playing card clubs symbol Financial growth decrease and American football money icon. Vector.
Free with trial A professional vector set of business chart icons showing both growth and decline trends. Includes bar charts and line graphs with upward and downward arrows, representing profit, loss, performance rise, and financial downfall. Perfect for business presentations, reports, websites, infographics, and more. Fully editable EPS file for scalable design use. Set financial growth decrease vectors Business Growth and Decline Chart Icons Set – Vector Graph Collection. A professional vector set of business chart icons showing both growth and decline trends. Includes bar charts and line graphs with upward and downward arrows, representing profit, loss, performance rise, and financial downfall. Perfect for business presentations, reports, websites, infographics, and more. Fully editable EPS file for scalable design use.
Free with trial Money Transfer Icons Set, Currency Exchange Logo, Crypto Financial Services. Vector illustration. Set financial growth decrease vectors Money Transfer Icons Set, Currency Exchange Logo, Crypto Financial Services. Vector
Free with trial Money Transfer Icons Set, Currency Exchange Logo, Crypto Financial Services. Vector illustration. Set financial growth decrease vectors Money Transfer Icons Set, Currency Exchange Logo, Crypto Financial Services. Vector
Free with trial A contrasting vector graphic set showing rising green bars with an upward arrow and falling red bars with a downward arrow, representing financial growth and decline. Set financial growth decrease vectors Business bar charts indicating growth and decline. A contrasting vector graphic set showing rising green bars with an upward arrow and falling red bars with a downward arrow, representing financial growth and decline
Free with trial A clean black and white set of nine vector icons showing growth, decline, stability, and financial trends for business presentations and reports. Set financial growth decrease vectors Economic trend icons set flat design vector illustration. A clean black and white set of nine vector icons showing growth, decline, stability, and financial trends for business presentations and reports.
Free with trial Modern black and white vector icons showing financial trends, growth, decline, and exchange for business presentations or reports. Set financial growth decrease vectors Financial trend icons set vector illustration flat design. Modern black and white vector icons showing financial trends, growth, decline, and exchange for business presentations or reports
Free with trial Money line icons. Settings gear, Message, Inflation icons. Finance, revenue reduction and financial benefit set. Economy, money savings and increase profit line icons. Vector. Set financial growth decrease vectors Money line icons. Finance, revenue reduction and financial benefit. App line icons. Vector. Money line icons. Settings gear, Message, Inflation icons. Finance, revenue reduction and financial benefit set. Economy, money savings and increase profit line icons. Vector
Free with trial Return of investment icon set. Dollar symbols with arrow. Cost of dollar with arrow down and up. Coin of dollar with loss or growth. Increase and low of revenue. Set financial growth decrease vectors Return of investment icon set. Dollar symbols with arrow. Cost of dollar with arrow down and up.
Free with trial This image displays a set of stylized bar chart icons representing financial and business trends. The leftmost icon features green bars increasing in height, accompanied by a green upward-pointing arrow, symbolizing growth and success. The middle icon shows red bars decreasing in height, with a black downward-pointing arrow indicating decline and loss. The right side presents two smaller black and white bar charts, also depicting downward trends. These icons are ideal for illustrating concepts like profit, loss, market trends, economic performance, and data analysis. Set financial growth decrease illustrations Growth and Decline Bar Chart Icons. This image displays a set of stylized bar chart icons representing financial and business trends. The leftmost icon features green bars increasing in height, accompanied by a green upward-pointing arrow, symbolizing growth and success. The middle icon shows red bars decreasing in height, with a black downward-pointing arrow indicating decline and loss. The right side presents two smaller black and white bar charts, also depicting downward trends. These icons are ideal for illustrating concepts like profit, loss, market trends, economic performance, and data analysis.