Free with trial Money Transfer Icons Set, Currency Exchange Logo, Crypto Financial Services. Vector illustration. Set financial growth decrease vectors Money Transfer Icons Set, Currency Exchange Logo, Crypto Financial Services. Vector
Free with trial Set of circular dollar currency icons with up and down arrows representing profit, loss, exchange and rate changes flat and glyph styles in black, red and green for business and finance use. Set financial growth decrease vectors Money Currency Icons With Up And Down Arrows Showing Increase And Decrease Financial Trends. Set of circular dollar currency icons with up and down arrows representing profit, loss, exchange and rate changes flat and glyph styles in black, red and green for business and finance use.
Free with trial This image features a minimalist and modern vector icon of a jagged downward trending line graph, sharply declining from left to right, symbolizing financial loss, economic downturn, or market decline, set against a clean and uncluttered white background suitable for use in presentations, reports, infographics, or digital media to visually communicate negative trends or decreasing performance. Set financial growth decrease illustrations Sharp downward trending line graph icon isolated on white background representing financial loss or market decline vector. This image features a minimalist and modern vector icon of a jagged downward trending line graph, sharply declining from left to right, symbolizing financial loss, economic downturn, or market decline, set against a clean and uncluttered white background suitable for use in presentations, reports, infographics, or digital media to visually communicate negative trends or decreasing performance
Free with trial An abstract digital financial chart features multiple vibrant, fluctuating neon lines in blue, green, pink, and white, set against a dark grid background. Prominent red upward and downward arrows, along with a green downward arrow, clearly indicate market trends, growth, and decline. Interspersed geometric shapes connected by lines suggest complex data points and network connections. This dynamic visualization is ideal for illustrating concepts of stock market data, cryptocurrency trends, business analytics, investment volatility, big data, AI, and financial technology, suitable for modern business and tech-related projects. Set financial growth decrease illustrations Digital Financial Data Chart with Fluctuating Lines and Arrows. An abstract digital financial chart features multiple vibrant, fluctuating neon lines in blue, green, pink, and white, set against a dark grid background. Prominent red upward and downward arrows, along with a green downward arrow, clearly indicate market trends, growth, and decline. Interspersed geometric shapes connected by lines suggest complex data points and network connections. This dynamic visualization is ideal for illustrating concepts of stock market data, cryptocurrency trends, business analytics, investment volatility, big data, AI, and financial technology, suitable for modern business and tech-related projects.
Free with trial A clean and modern digital illustration of a financial candlestick chart, displaying market trends and stock performance. The graph features blue candlesticks indicating price movements over time, accompanied by a solid blue line graph and subtle dashed trend lines. Set against a crisp white background with a clear grid, this visualization is ideal for illustrating concepts related to finance, investment, business analytics, economic forecasts, and data reporting. It conveys growth, volatility, and strategic decision-making in the stock market. Set financial growth decrease illustrations Financial Candlestick Chart with Trend Line on White Background. A clean and modern digital illustration of a financial candlestick chart, displaying market trends and stock performance. The graph features blue candlesticks indicating price movements over time, accompanied by a solid blue line graph and subtle dashed trend lines. Set against a crisp white background with a clear grid, this visualization is ideal for illustrating concepts related to finance, investment, business analytics, economic forecasts, and data reporting. It conveys growth, volatility, and strategic decision-making in the stock market.
Free with trial Increase and Decrease Stroke icon collections. Containing Increase, Decrease, Growth, Fall, up, down icons. Editable Stroke icon collections. Set financial growth decrease vectors Increase and Decrease Stroke icon collections.
Free with trial Simple line art business icons set featuring a magnifying glass, minus symbol, pie chart, and rising bar graph for financial data analysis. Set financial growth decrease vectors Simple line art business icons set featuring a magnifying glass, minus symbol, pie chart, and rising bar graph for
Free with trial A minimalist graphic illustration of a downward financial trend features a green line graph with three vertical bars topped by dollar signs, where the first bar is green, the second yellow, and the third orange, symbolizing decreasing monetary value, set against a clean white background with scattered dollar signs emphasizing economic decline, conveying a clear message of financial loss, market. Set financial growth decrease illustrations Downward financial trend with colored dollar signs on white background. A minimalist graphic illustration of a downward financial trend features a green line graph with three vertical bars topped by dollar signs, where the first bar is green, the second yellow, and the third orange, symbolizing decreasing monetary value, set against a clean white background with scattered dollar signs emphasizing economic decline, conveying a clear message of financial loss, market
Free with trial A vibrant and playful collection of hand-drawn financial and business icons. The set includes a bar graph, gold bars, a downward arrow, calculators, a smiley face, and cartoon dollar bills. These icons are perfect for illustrating concepts related to finance, economics, investment, and business growth. The simple and cheerful design makes them ideal for educational materials, presentations, and websites. Set financial growth decrease vectors Finance and Business Icons Set. A vibrant and playful collection of hand-drawn financial and business icons. The set includes a bar graph, gold bars, a downward arrow, calculators, a smiley face, and cartoon dollar bills. These icons are perfect for illustrating concepts related to finance, economics, investment, and business growth. The simple and cheerful design makes them ideal for educational materials, presentations, and websites.
Free with trial A comprehensive collection of 16 black glyph icons on a clean white background, representing a wide range of concepts from business and technology to daily life and abstract ideas. This versatile set includes symbols for financial growth, strategic thinking, mobile alerts, religious symbols, and more. Ideal for web design, mobile applications, infographics, presentations, and any project requiring clear, minimalist, and modern visual communication. Perfect for conveying diverse messages efficiently. Set financial growth decrease vectors Diverse Universal Glyph Icons Set. A comprehensive collection of 16 black glyph icons on a clean white background, representing a wide range of concepts from business and technology to daily life and abstract ideas. This versatile set includes symbols for financial growth, strategic thinking, mobile alerts, religious symbols, and more. Ideal for web design, mobile applications, infographics, presentations, and any project requiring clear, minimalist, and modern visual communication. Perfect for conveying diverse messages efficiently.
Free with trial Simple line art business icons set featuring a magnifying glass, minus symbol, pie chart, and rising bar graph for financial data analysis. Set financial growth decrease vectors Simple line art business icons set featuring a magnifying glass, minus symbol, pie chart, and rising bar graph for
Free with trial This set includes 15 high-quality, vector business icons representing various aspects of finance, networking, and growth. Perfect for websites, presentations, and applications. These simple yet effective icons provide visual clarity and professionalism. Set financial growth decrease illustrations Business Icon Set. This set includes 15 high-quality, vector business icons representing various aspects of finance, networking, and growth. Perfect for websites, presentations, and applications. These simple yet effective icons provide visual clarity and professionalism.
Free with trial This vibrant image features a white cube with a prominent black percentage symbol, seemingly floating above a row of five identical white cubes, each displaying a clear black downward arrow. Set against a bright yellow background, the composition powerfully symbolizes a concept of reduction, decline, or decrease. It's ideal for illustrating topics such as falling interest rates, economic downturns, sales reductions, discounts, negative trends, or any financial or business concept involving a downward movement in percentages. The clean, minimalist design offers versatility for various editorial and commercial uses. Set financial growth decrease illustrations Percentage Decrease Concept with Downward Arrows. This vibrant image features a white cube with a prominent black percentage symbol, seemingly floating above a row of five identical white cubes, each displaying a clear black downward arrow. Set against a bright yellow background, the composition powerfully symbolizes a concept of reduction, decline, or decrease. It's ideal for illustrating topics such as falling interest rates, economic downturns, sales reductions, discounts, negative trends, or any financial or business concept involving a downward movement in percentages. The clean, minimalist design offers versatility for various editorial and commercial uses.
Free with trial A dynamic black and white background pattern featuring a collection of hand-drawn financial and economic elements. The design includes various currency symbols like the Dollar, Euro, and Yen, alongside upward and downward arrows, zig-zag lines representing market volatility, and simple bar charts indicating growth or decline. Scattered ink splatters add a grunge, artistic touch to the overall composition. This versatile illustration is ideal for conveying concepts related to global finance, business trends, investment, stock market fluctuations, economic data, and wealth management in a creative and engaging way. Set financial growth decrease vectors Hand Drawn Financial Market Elements Background Pattern. A dynamic black and white background pattern featuring a collection of hand-drawn financial and economic elements. The design includes various currency symbols like the Dollar, Euro, and Yen, alongside upward and downward arrows, zig-zag lines representing market volatility, and simple bar charts indicating growth or decline. Scattered ink splatters add a grunge, artistic touch to the overall composition. This versatile illustration is ideal for conveying concepts related to global finance, business trends, investment, stock market fluctuations, economic data, and wealth management in a creative and engaging way.
Free with trial A comprehensive set of black grunge-textured icons representing the US Dollar (USD) and its market dynamics. The collection features various symbols indicating upward trends, downward trends, stability, and currency exchange or circulation, often incorporating arrows and graph-like elements. Ideal for financial reports, economic analyses, investment platforms, business presentations, and any design requiring visual representation of money flow, market performance, or currency value changes in a distinct, distressed style. Set financial growth decrease vectors Grunge USD Dollar Market Movement and Exchange Icons Set. A comprehensive set of black grunge-textured icons representing the US Dollar (USD) and its market dynamics. The collection features various symbols indicating upward trends, downward trends, stability, and currency exchange or circulation, often incorporating arrows and graph-like elements. Ideal for financial reports, economic analyses, investment platforms, business presentations, and any design requiring visual representation of money flow, market performance, or currency value changes in a distinct, distressed style.
Free with trial Collection of red percentage signs with up and down arrows. Represents financial growth, decline, discounts, and sales. Set financial growth decrease vectors Percentage icon set, finance up and down arrows red symbols. Collection of red percentage signs with up and down arrows. Represents financial growth, decline, discounts, and sales
Free with trial A collection of line icons representing various financial concepts, including money, bitcoin, shopping, and business growth, all in a simple black and white design. Set financial growth decrease vectors Financial Icons Set with Money, Bitcoin, and Business Symbols. A collection of line icons representing various financial concepts, including money, bitcoin, shopping, and business growth, all in a simple black and white design
Free with trial A set of solid black icons illustrating financial risk management and loss concepts, including money, wallet, business, investment, and protection. Set financial growth decrease vectors Financial Risk and Loss Management solid icon set. financial risk analysis loss management solid icons. A set of solid black icons illustrating financial risk management and loss concepts, including money, wallet, business, investment, and protection
Free with trial A shiny gold percentage symbol (%) set against a backdrop of red and blue financial graph lines, representing market trends, economic fluctuations, and investment analysis. Ideal for financial reports and business-related topics. Set financial growth decrease illustrations Gold Percentage Symbol with Red and Blue Financial Graph Trend. A shiny gold percentage symbol (%) set against a backdrop of red and blue financial graph lines, representing market trends, economic fluctuations, and investment analysis. Ideal for financial reports and business-related topics.
Free with trial Arrow percent icon set. Increase and decrease percentage sign symbol vector. Set financial growth decrease vectors Arrow percent icon set. Increase and decrease percentage sign symbol
Free with trial Icons on a white background depict percentage symbols combined with arrows and bar graphs. The top row includes red, blue, and yellow arrows with percentage symbols. The middle row shows a multicolored bar graph, green percentage symbols, and a black percentage symbol with a black arrow. The bottom row contains a black bar graph, a downward arrow, and a large black percentage symbol. These elements visually represent data trends, growth, and decline. Set financial growth decrease vectors Percentage Growth and Decline Arrow Icon Set Multi Color and Silhouette. Icons on a white background depict percentage symbols combined with arrows and bar graphs. The top row includes red, blue, and yellow arrows with percentage symbols. The middle row shows a multicolored bar graph, green percentage symbols, and a black percentage symbol with a black arrow. The bottom row contains a black bar graph, a downward arrow, and a large black percentage symbol. These elements visually represent data trends, growth, and decline.
Free with trial A set of six line art icons illustrating financial concepts, including stacks of coins with upward and downward arrows, hands with falling coins, a banknote, and a coin. Set financial growth decrease vectors Finance Icons Money Growth Loss Savings Investment Cash Coins banknote. A set of six line art icons illustrating financial concepts, including stacks of coins with upward and downward arrows, hands with falling coins, a banknote, and a coin
Free with trial A vibrant and diverse set of financial icons, including symbols for money, growth, and profit, as well as various charts and graphs. The icons are colorful and modern, making them perfect for use in business presentations, reports, and marketing materials. The white background provides a clean and neutral space for the icons to stand out, allowing for easy customization and integration into various designs. Set financial growth decrease vectors A collection of colorful financial icons on a white background for business use. A vibrant and diverse set of financial icons, including symbols for money, growth, and profit, as well as various charts and graphs. The icons are colorful and modern, making them perfect for use in business presentations, reports, and marketing materials. The white background provides a clean and neutral space for the icons to stand out, allowing for easy customization and integration into various designs.
Free with trial A set of black and white icons representing different types of business and financial charts including bar graphs line graphs and pie charts. Set financial growth decrease vectors Collection of various business and financial chart icons including bar graphs line graphs and pie charts. A set of black and white icons representing different types of business and financial charts including bar graphs line graphs and pie charts
Free with trial Hand drawn line art percentage arrow icon set featuring downward and upward trending arrows with percentage signs for financial data representation. Set financial growth decrease vectors Hand drawn line art percentage arrow icon set featuring downward and upward trending arrows with percentage signs for
Free with trial A set of modern icons depicting financial concepts such as mortgage rates, loan interest fluctuations, and investment growth, using charts and percentage symbols. Set financial growth decrease vectors Financial icons illustrating mortgage rates, loan interest, and investment growth with charts and percentage symbols. A set of modern icons depicting financial concepts such as mortgage rates, loan interest fluctuations, and investment growth, using charts and percentage symbols
Free with trial Simple line art business icons set featuring a magnifying glass, minus symbol, pie chart, and rising bar graph for financial data analysis. Set financial growth decrease illustrations Simple line art business icons set featuring a magnifying glass, minus symbol, pie chart, and rising bar graph for
Free with trial Line art arrow icon set featuring percentage symbols with upward, downward, and bidirectional movement for financial data. Set financial growth decrease vectors Line art arrow icon set featuring percentage symbols with upward, downward, and bidirectional movement for financial data
Free with trial Interest growth icon Vector symbol or sign set collection in black and white outline. Set financial growth decrease vectors Economic Growth Icon Illustrating Financial Prosperity, Investment Returns, and Profit Expansion. Interest growth icon Vector symbol or sign set collection in black and white outline
Free with trial A 3D rendered illustration depicting business growth. The image showcases two upward-trending arrow charts, one in gold and the other in blue, representing positive trends, progress, and success. The charts are set against a clean, light background, emphasizing the upward movement and potential for financial gain. Suitable for illustrating economic growth, investment strategies, and business performance. Set financial growth decrease illustrations Growth Chart with Arrows. A 3D rendered illustration depicting business growth. The image showcases two upward-trending arrow charts, one in gold and the other in blue, representing positive trends, progress, and success. The charts are set against a clean, light background, emphasizing the upward movement and potential for financial gain. Suitable for illustrating economic growth, investment strategies, and business performance.
Free with trial A vibrant collection of hand-drawn business charts and graphs, rendered in shades of blue with a sketch-like aesthetic. The set includes various types of visualizations like bar charts, line graphs, pie charts, and donut charts, representing data, growth, and analysis. This versatile illustration is perfect for presentations, reports, infographics, and any project requiring a visual representation of financial or statistical information with a creative, hand-crafted feel. Set financial growth decrease illustrations Hand-Drawn Business Charts and Graphs Collection. A vibrant collection of hand-drawn business charts and graphs, rendered in shades of blue with a sketch-like aesthetic. The set includes various types of visualizations like bar charts, line graphs, pie charts, and donut charts, representing data, growth, and analysis. This versatile illustration is perfect for presentations, reports, infographics, and any project requiring a visual representation of financial or statistical information with a creative, hand-crafted feel.
Free with trial A collection of financial chart icons, showcasing data analysis and business growth concepts. The image features multiple variations of a line graph and bar chart combination, presented in both grayscale and beige color schemes. These icons are ideal for illustrating financial reports, business presentations, market trends, and data visualization projects. The clean, modern design makes them suitable for a wide range of applications. Set financial growth decrease vectors Financial Chart Icons: Business and Data Analysis. A collection of financial chart icons, showcasing data analysis and business growth concepts. The image features multiple variations of a line graph and bar chart combination, presented in both grayscale and beige color schemes. These icons are ideal for illustrating financial reports, business presentations, market trends, and data visualization projects. The clean, modern design makes them suitable for a wide range of applications.
Free with trial A futuristic concept of financial trading and data analysis. A glowing holographic stock market chart, with candlesticks and graphs, is projected onto a modern office desk. The scene includes a laptop and coffee, set against a large window with a blurry night city skyline. This image represents concepts like fintech, investment, big data, economic growth, and innovative business technology. Ideal for illustrating topics on digital finance, stock exchange, forex trading, and corporate strategy in a high-tech world. Set financial growth decrease illustrations Futuristic Financial Trading Hologram on Office Desk. A futuristic concept of financial trading and data analysis. A glowing holographic stock market chart, with candlesticks and graphs, is projected onto a modern office desk. The scene includes a laptop and coffee, set against a large window with a blurry night city skyline. This image represents concepts like fintech, investment, big data, economic growth, and innovative business technology. Ideal for illustrating topics on digital finance, stock exchange, forex trading, and corporate strategy in a high-tech world.
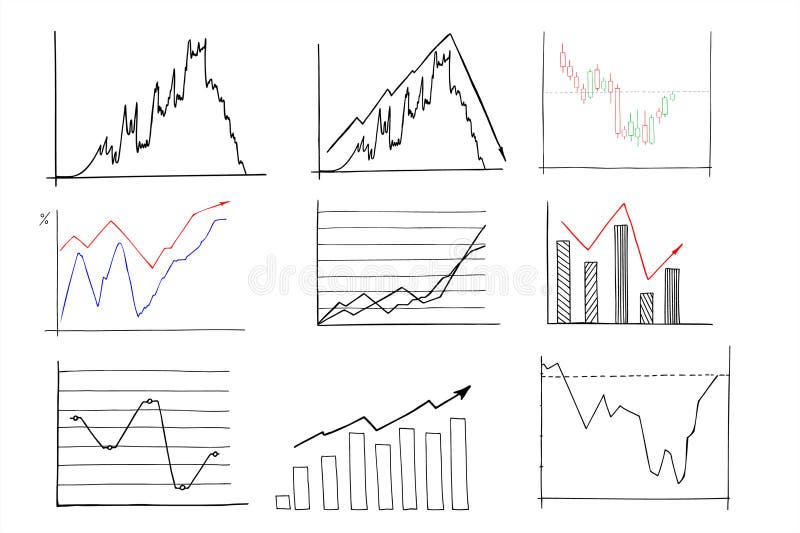
Free with trial A collection of eight black and white, hand-drawn or doodle style icons. Each square icon features a different line graph, representing data, analytics, statistics, or financial trends. Set financial growth decrease illustrations Set of hand drawn financial chart line graph icons isolated on white. A collection of eight black and white, hand-drawn or doodle style icons. Each square icon features a different line graph, representing data, analytics, statistics, or financial trends
Free with trial A collection of eight black and white, hand-drawn or doodle style icons. Each square icon features a different line graph, representing data, analytics, statistics, or financial trends. Set financial growth decrease illustrations Set of hand drawn financial chart line graph icons isolated on white. A collection of eight black and white, hand-drawn or doodle style icons. Each square icon features a different line graph, representing data, analytics, statistics, or financial trends
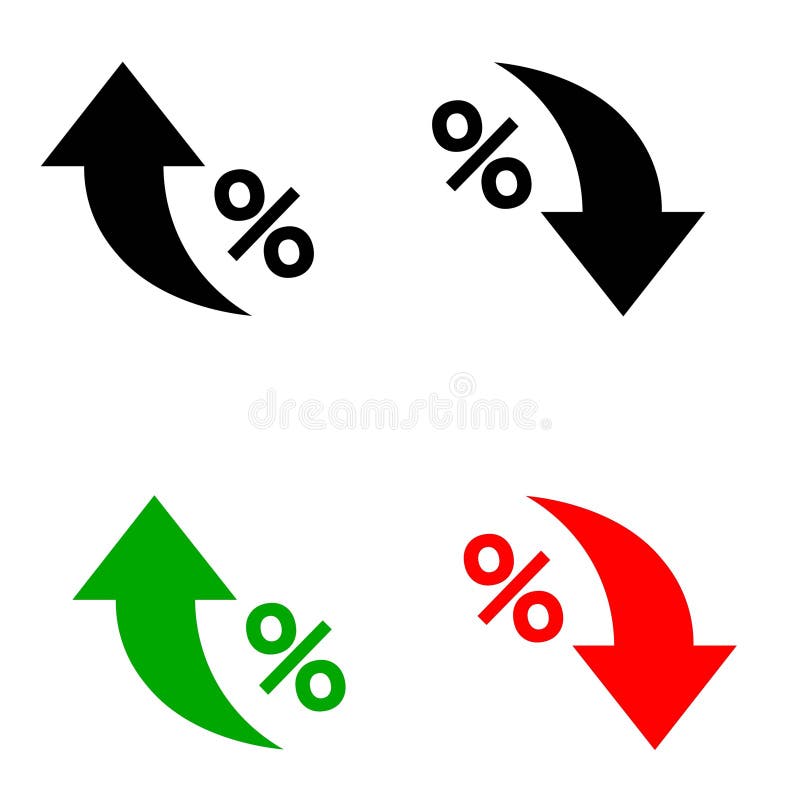
Free with trial Four symbols featuring curved arrows and percentage signs. Two black arrows are paired with black percentage signs, pointing in opposite directions. A green arrow curves upward with a matching green percentage sign, while a red arrow curves downward with a corresponding red percentage sign. Each set emphasizes direction, often associated with financial or statistical changes, like increases or decreases in percentages. The background is white for clarity. Set financial growth decrease vectors Percent arrow icon. Growth, increase, decrease arrow filled icons. Four symbols featuring curved arrows and percentage signs. Two black arrows are paired with black percentage signs, pointing in opposite directions. A green arrow curves upward with a matching green percentage sign, while a red arrow curves downward with a corresponding red percentage sign. Each set emphasizes direction, often associated with financial or statistical changes, like increases or decreases in percentages. The background is white for clarity.
Free with trial Interest growth icon Black line art vector in black and white outline set collection sign. Set financial growth decrease vectors Financial Icon Illustrating Growth, Investment Success, and Economic Prosperity. Interest growth icon Black line art vector in black and white outline set collection sign
Free with trial A set of simple outline icons related to financial and investment themes, featuring dollar signs and clean, minimalistic designs. Set financial growth decrease vectors Simple Outline Financial and Investment Icons Symbol Set with Dollar Sign. A set of simple outline icons related to financial and investment themes, featuring dollar signs and clean, minimalistic designs.
Free with trial Modern rendered line graph with yellow marker points rising and falling vertically, forming a white trend line that fluctuates across the screen. The graph represents business data such as growth, decrease, profit, and market performance. Set against a blurred office background, the image has a clean, digital aesthetic ideal for financial presentations, company reports, startup pitches, and data analysis. This visual is suitable for showcasing trading performance, corporate strategy, and economic trends. Set financial growth decrease illustrations Business Trend Line Graph Showing Growth and Market Fluctuations. Modern rendered line graph with yellow marker points rising and falling vertically, forming a white trend line that fluctuates across the screen. The graph represents business data such as growth, decrease, profit, and market performance. Set against a blurred office background, the image has a clean, digital aesthetic ideal for financial presentations, company reports, startup pitches, and data analysis. This visual is suitable for showcasing trading performance, corporate strategy, and economic trends.
Free with trial Finance, revenue reduction and financial benefit set. Design shape elements. Money line icons. Economy, money savings and increase profit line icons. Cash back, wallet and return finance. Vector. Set financial growth decrease illustrations Money line icons. Finance, revenue reduction and financial benefit. Design elements. Vector. Finance, revenue reduction and financial benefit set. Design shape elements. Money line icons. Economy, money savings and increase profit line icons. Cash back, wallet and return finance. Vector
Free with trial A 3D rendered blue arrow points downwards, symbolizing a decrease or reduction. Adjacent to the arrow is a pink circular icon containing a white percentage symbol. The composition is set against a clean white background, suggesting a concept related to sales, discounts, price drops, or negative financial trends. Set financial growth decrease illustrations Downward Arrow with Percentage Symbol on White Background decrease reduction. A 3D rendered blue arrow points downwards, symbolizing a decrease or reduction. Adjacent to the arrow is a pink circular icon containing a white percentage symbol. The composition is set against a clean white background, suggesting a concept related to sales, discounts, price drops, or negative financial trends
Free with trial A set of black and white icons representing stock market data analysis and financial growth. 94. Set financial growth decrease vectors Stock market data analysis charts and graphs business finance and investment vector icon set design 100. a set of black and white icons representing stock market data analysis and financial growth. 94
Free with trial Cost optimization concept. Financial and marketing strategy ideas. Spending and cost reduction, while maximizing business value. Set flat vector modern illustration. Set financial growth decrease vectors Cost optimization concept. Financial and marketing strategy ideas. Spending and cost reduction, while maximizing business value.
Free with trial Financial Loss, Economic Downturn, And Business Decline Symbol Collection. Declining Bar Chart With Downward Arrow Line And Solid Icon Set. Market Analysis. Isolated Vector Illustration. Set financial growth decrease vectors Financial Loss, Economic Downturn, And Business Decline Symbol Collection. Declining Bar Chart With Downward Arrow Line
Free with trial Set Digital speed meter Location Delivery tracking Graph chart diagram Hierarchy organogram Infographic element and Financial growth decrease icon. Vector. Set financial growth decrease illustrations Set Digital speed meter, Location, Delivery tracking, Graph, chart, diagram, Hierarchy organogram, Infographic element. Set Digital speed meter Location Delivery tracking Graph chart diagram Hierarchy organogram Infographic element and Financial growth decrease icon. Vector.
Free with trial Set of linear graphs with red and blue lines showing different trends and dynamics vector illustration. Change in time of election results or income. For business analytics, financial reports. Set financial growth decrease vectors Set of linear graphs with red and blue lines showing different trends and dynamics vector illustration. Change in time of election
Free with trial Chart line set. Graph, finance report, income growth, economy statistic, diagram, infographic, mind map, data visualization vector illustration. Outline signs of analytic. Editable Stroke. Set financial growth decrease vectors Analytical graphic chart with trend lines, columns set hand drawn ink sketch. Change in time of election results or income, plans. Chart line set. Graph, finance report, income growth, economy statistic, diagram, infographic, mind map, data visualization vector illustration. Outline signs of analytic. Editable Stroke
Free with trial Set of red 3D arrows pointing downward in various styles. Concept of business decline, market crash, or financial loss for economic visualization. Vector illustration. Set financial growth decrease vectors Set of red 3D arrows pointing downward
Free with trial A diverse set of graphic icons representing financial growth, decline, and market trends with clear up and down arrows, bar charts, and coin stacks. Flat design. Set financial growth decrease vectors Collection of colorful increase and decrease icons. A diverse set of graphic icons representing financial growth, decline, and market trends with clear up and down arrows, bar charts, and coin stacks. Flat design
Free with trial 3D render illustrating exchange rate fluctuations. A red arrow points downwards, representing a decrease in value, while a green arrow points upwards, indicating an increase. Currency symbols for the Euro, US Dollar, and British Pound are scattered around the arrows, emphasizing the concept of currency exchange rates. The image is set against a clean white background, making it suitable for financial news, economic reports, or educational materials. Set financial growth decrease vectors Exchange Rate Fluctuations
Free with trial 3D percent icons in white, grey, and black colors showing rate, discount, and price change. Modern percentage vector for sale, business, and financial concept, symbolizing growth and reduction. Set financial growth decrease vectors 3D percent icons in white, grey, and black colors showing rate, discount, and price change. Modern percentage vector for
Free with trial Minimalist 3D set of green upward and red downward arrows, isolated on a white background. Realistic glossy render for financial market analysis, stock trading indicators, profit and loss comparison. Set financial growth decrease vectors Minimalist 3D set of green upward and red downward arrows, isolated on a white background
Free with trial Outline icons set depicting stock market concepts like surge, decline, performance, savings, and activity. Preferably at the end of the sentence. Set financial growth decrease vectors Outline icons set depicting stock market concepts like surge, decline,... Outline icons set depicting stock market concepts like surge, decline, performance, savings, and activity. Preferably at the end of the sentence.
Free with trial A clean and minimalist illustration featuring a set of fundamental mathematical symbols in black against a pure white background. The symbols include plus (+), minus (-), division (�), multiplication (�), and equals ( ). This versatile graphic is ideal for educational materials, financial reports, business presentations, technology interfaces, or any design requiring clear representation of arithmetic operations, problem-solving, or logical concepts. Its simple design ensures high readability and adaptability across various media. Set financial growth decrease illustrations Basic Mathematical Symbols Set on White Background. A clean and minimalist illustration featuring a set of fundamental mathematical symbols in black against a pure white background. The symbols include plus (+), minus (-), division (�), multiplication (�), and equals ( ). This versatile graphic is ideal for educational materials, financial reports, business presentations, technology interfaces, or any design requiring clear representation of arithmetic operations, problem-solving, or logical concepts. Its simple design ensures high readability and adaptability across various media.
Free with trial A collection of eight thin-line related to finance and business. The depict a stack of coins with a dollar sign, a document with a dollar sign, an upward trending graph over city buildings, and a bar chart with a plus sign. The bottom row coins and currency symbols, a calculator with a dollar sign, a document with a calculator and charts, and a person. Set financial growth decrease illustrations Financial set with charts and calculator finance business. A collection of eight thin-line related to finance and business. The depict a stack of coins with a dollar sign, a document with a dollar sign, an upward trending graph over city buildings, and a bar chart with a plus sign. The bottom row coins and currency symbols, a calculator with a dollar sign, a document with a calculator and charts, and a person
Free with trial Set of alpha transparent business and finance icons drawn in white chalk, illustrating net asset value rising and falling alongside a market chart and Indian currency notation. Set financial growth decrease vectors Sketch of mutual fund NAV increase and decrease icons with Indian rupee symbol alpha transparent. Set of alpha transparent business and finance icons drawn in white chalk, illustrating net asset value rising and falling alongside a market chart and Indian currency notation.
Free with trial A vibrant, hand-drawn doodle illustration centered around a large percentage sign. This creative sketch features various financial and business icons, including bar graphs, pie charts, stacks of coins, dollar signs, and arrows indicating growth and decline. The colorful, cartoonish style makes it perfect for illustrating concepts like interest rates, economic trends, business analytics, and financial reports. Ideal for use in presentations, infographics, websites, and educational materials, this vector art is isolated on a white background for versatile application. Set financial growth decrease illustrations Finance and Economy Doodle Illustration. A vibrant, hand-drawn doodle illustration centered around a large percentage sign. This creative sketch features various financial and business icons, including bar graphs, pie charts, stacks of coins, dollar signs, and arrows indicating growth and decline. The colorful, cartoonish style makes it perfect for illustrating concepts like interest rates, economic trends, business analytics, and financial reports. Ideal for use in presentations, infographics, websites, and educational materials, this vector art is isolated on a white background for versatile application.
Free with trial A stylized, flat design illustration of a bar chart depicting a downward trend. The bars are colored red, yellow, and blue, arranged in decreasing height from left to right. A prominent red arrow points downwards across the chart, emphasizing the decline. The graphic is set against a clean white background, making it ideal for presentations, reports, and financial concepts related to loss, decrease, or negative performance. Set financial growth decrease illustrations Declining Bar Chart with Downward Arrow. A stylized, flat design illustration of a bar chart depicting a downward trend. The bars are colored red, yellow, and blue, arranged in decreasing height from left to right. A prominent red arrow points downwards across the chart, emphasizing the decline. The graphic is set against a clean white background, making it ideal for presentations, reports, and financial concepts related to loss, decrease, or negative performance.
Free with trial This image features three bold, three-dimensional arrows pointing sharply downward, each rendered in distinct vibrant colors�'blue, yellow, and red�'symbolizing a significant market downturn, financial loss, or economic decline, set against a clean, minimalist white background that enhances their striking visual impact and conveys urgency and negative momentum in business, trading, or investment. Set financial growth decrease illustrations Colorful downward trending financial arrows in blue yellow and red illustrating market decline and economic downturn concepts. This image features three bold, three-dimensional arrows pointing sharply downward, each rendered in distinct vibrant colors�'blue, yellow, and red�'symbolizing a significant market downturn, financial loss, or economic decline, set against a clean, minimalist white background that enhances their striking visual impact and conveys urgency and negative momentum in business, trading, or investment
Free with trial Ascending and descending graph set. Vector illustration. Set financial growth decrease vectors Ascending and descending graph set.
Free with trial Ascending and descending graph set. Vector illustration. Set financial growth decrease vectors Ascending and descending graph set.
Free with trial This image showcases a comprehensive collection of blue bar graphs and line graphs, presented in a grid format. Each graph depicts various data trends, including upward and downward movements, fluctuating patterns, and steady growth. The clean, modern design makes these icons ideal for representing financial data, market analysis, performance metrics, and business growth in presentations, reports, and websites. Set financial growth decrease illustrations Collection of Blue Bar and Line Graphs for Business Analytics. This image showcases a comprehensive collection of blue bar graphs and line graphs, presented in a grid format. Each graph depicts various data trends, including upward and downward movements, fluctuating patterns, and steady growth. The clean, modern design makes these icons ideal for representing financial data, market analysis, performance metrics, and business growth in presentations, reports, and websites.
Free with trial The image shows a line graph illustrating the decline of carbon emissions. there are two lines on the graph, a green line and a grey line, both trending downwards. the green line, representing "carbon inteetiual emissions," shows a steeper decline compared to the grey line. the graph is set against a grid background, providing a visual reference for the rate of decrease in emissions over time. the downward trend suggests a positive change in reducing carbon output. Set financial growth decrease illustrations Carbon emissions decline graph illustration. the image shows a line graph illustrating the decline of carbon emissions. there are two lines on the graph, a green line and a grey line, both trending downwards. the green line, representing "carbon inteetiual emissions," shows a steeper decline compared to the grey line. the graph is set against a grid background, providing a visual reference for the rate of decrease in emissions over time. the downward trend suggests a positive change in reducing carbon output.
Free with trial Red and green 3D arrows are set against a white background. The red arrow points downward and the green arrow points upward. Both arrows have a white percentage symbol centered on them, indicating a focus on financial or data trends. The scene is clean and minimalist, showcasing the contrast between the arrows and their significance in indicating decrease and increase. Set financial growth decrease vectors Red down arrow and green up arrow with percentage signs on black background. Red and green 3D arrows are set against a white background. The red arrow points downward and the green arrow points upward. Both arrows have a white percentage symbol centered on them, indicating a focus on financial or data trends. The scene is clean and minimalist, showcasing the contrast between the arrows and their significance in indicating decrease and increase.
Free with trial A vibrant collection of hand-drawn business charts and graphs, rendered in blue tones. The set includes various types of visualizations like bar charts, line graphs, and a pie chart, all with a sketchy, illustrative style. These visuals are ideal for presentations, reports, and infographics related to finance, data analysis, growth, and business performance. Set financial growth decrease illustrations Hand-Drawn Business Charts and Graphs Collection. A vibrant collection of hand-drawn business charts and graphs, rendered in blue tones. The set includes various types of visualizations like bar charts, line graphs, and a pie chart, all with a sketchy, illustrative style. These visuals are ideal for presentations, reports, and infographics related to finance, data analysis, growth, and business performance.
Free with trial An abstract digital rendering of a financial market chart with a prominent red line indicating fluctuations in a stock market or trading scenario, set against a background of data streams and numerical information. It can be used for visualizing economic trends or for representing financial analytics. Set financial growth decrease illustrations Abstract financial chart depicting market trends and data analysis interface. An abstract digital rendering of a financial market chart with a prominent red line indicating fluctuations in a stock market or trading scenario, set against a background of data streams and numerical information. It can be used for visualizing economic trends or for representing financial analytics
Free with trial A 3D illustration depicts a financial chart with a downward trend. Four vertical bars, colored yellow, orange, and green, are arranged in descending order of height, suggesting a decline. To the left, a prominent orange circle contains a white downward-pointing arrow, reinforcing the theme of a negative trend or decrease. The entire composition is set against a plain white background. Set financial growth decrease illustrations Financial chart with downward trend indicator stock market. A 3D illustration depicts a financial chart with a downward trend. Four vertical bars, colored yellow, orange, and green, are arranged in descending order of height, suggesting a decline. To the left, a prominent orange circle contains a white downward-pointing arrow, reinforcing the theme of a negative trend or decrease. The entire composition is set against a plain white background
Free with trial Set line Online sports betting Calendar Casino chip with dollar chips Hand holding casino Automated teller machine money Football and Financial growth decrease icon. Vector. Set financial growth decrease vectors Set line Online sports betting, Calendar, Casino chip with dollar, chips, Hand holding casino, Automated teller machine. Set line Online sports betting Calendar Casino chip with dollar chips Hand holding casino Automated teller machine money Football and Financial growth decrease icon. Vector.
Free with trial Percent arrows up and down icon set. Income and cost increase and decrease arrow icons. Set financial growth decrease vectors Percent arrows up and down icon set
Free with trial A minimalist, black and white vector icon representing a bar chart or graph. The icon features a series of vertical bars of varying heights, set against a base of horizontal lines. This clean and modern design is ideal for representing data, statistics, progress, growth, or financial information in digital and print media. Its simple aesthetic makes it versatile for use in presentations, websites, apps, and infographics. Set financial growth decrease vectors Abstract Bar Chart Icon. A minimalist, black and white vector icon representing a bar chart or graph. The icon features a series of vertical bars of varying heights, set against a base of horizontal lines. This clean and modern design is ideal for representing data, statistics, progress, growth, or financial information in digital and print media. Its simple aesthetic makes it versatile for use in presentations, websites, apps, and infographics.
Free with trial A set of black icons representing percentage changes, including arrows and circular symbols. The icons depict various concepts such as decrease, increase, and rotation, all incorporating percentage signs. The simple design makes them versatile for use in financial, statistical, or educational materials. Set financial growth decrease illustrations Black percentage icons set. A set of black icons representing percentage changes, including arrows and circular symbols. The icons depict various concepts such as decrease, increase, and rotation, all incorporating percentage signs. The simple design makes them versatile for use in financial, statistical, or educational materials.
Free with trial Bar graphs with various upward and downward trending arrows and a stylized dollar sign indicating financial growth and decline. Set financial growth decrease vectors Bar graphs with various upward and downward trending arrows and a stylized dollar sign
Free with trial Financial icons including coins, ATM, gold bars, calculator, piggy bank, and credit card, representing money and banking. Set financial growth decrease vectors Financial icons including coins, ATM, gold bars, calculator, piggy bank, and credit card
Free with trial A clean, minimalist vector illustration of a bar chart featuring three distinct columns. The columns are colored in vibrant orange, teal, and yellow, representing different data points or categories. The chart is set against a white background with a dark blue axis line, making it ideal for presentations, reports, and infographics focused on data visualization, business growth, or financial analysis. Set financial growth decrease vectors Simple Bar Chart with Three Columns. A clean, minimalist vector illustration of a bar chart featuring three distinct columns. The columns are colored in vibrant orange, teal, and yellow, representing different data points or categories. The chart is set against a white background with a dark blue axis line, making it ideal for presentations, reports, and infographics focused on data visualization, business growth, or financial analysis.
Free with trial A 3D rendered illustration depicting a bright yellow coin with a prominent white dollar sign at its center. Flanking the coin are two circular icons: one with a green upward-pointing arrow and the other with a red downward-pointing arrow. The entire composition is set against a clean white background, symbolizing financial concepts of growth and decline. Set financial growth decrease illustrations 3D Rendered Yellow Dollar Coin with Up and Down Arrows on White. A 3D rendered illustration depicting a bright yellow coin with a prominent white dollar sign at its center. Flanking the coin are two circular icons: one with a green upward-pointing arrow and the other with a red downward-pointing arrow. The entire composition is set against a clean white background, symbolizing financial concepts of growth and decline
Free with trial A set of three distinct candlestick chart icons, rendered in a clean, flat vector style against a white background. The green candle typically represents a bullish trend or price increase, the red candle signifies a bearish trend or price decrease, and the gray candle can denote neutrality or indecision in the market. These versatile symbols are ideal for illustrating financial concepts, stock market analysis, trading platforms, investment apps, economic reports, and educational materials related to forex, cryptocurrency, and general business trends. Set financial growth decrease vectors Candlestick Chart Icons for Financial Analysis. A set of three distinct candlestick chart icons, rendered in a clean, flat vector style against a white background. The green candle typically represents a bullish trend or price increase, the red candle signifies a bearish trend or price decrease, and the gray candle can denote neutrality or indecision in the market. These versatile symbols are ideal for illustrating financial concepts, stock market analysis, trading platforms, investment apps, economic reports, and educational materials related to forex, cryptocurrency, and general business trends.
Free with trial A 3D visualization of financial data, featuring a colorful pie chart and a series of bar graphs placed on top of a financial report document. The document also includes line graphs, illustrating various data trends and analyses. The composition is set against a white background. Set financial growth decrease illustrations 3D Bar Chart and Pie Chart on Financial Report with Line Graphs data statistics. A 3D visualization of financial data, featuring a colorful pie chart and a series of bar graphs placed on top of a financial report document. The document also includes line graphs, illustrating various data trends and analyses. The composition is set against a white background
Free with trial This image showcases a variety of modern, flat-design charts and graphs commonly used in business, finance, and data analysis. It includes bar charts, pie charts, and line graphs, presented in a clean, minimalist style with teal and gray color accents. These visual representations are ideal for illustrating trends, statistics, performance, and financial data in presentations, reports, and web content. Set financial growth decrease illustrations Collection of Business and Financial Charts and Graphs. This image showcases a variety of modern, flat-design charts and graphs commonly used in business. This image showcases a variety of modern, flat-design charts and graphs commonly used in business, finance, and data analysis. It includes bar charts, pie charts, and line graphs, presented in a clean, minimalist style with teal and gray color accents. These visual representations are ideal for illustrating trends, statistics, performance, and financial data in presentations, reports, and web content.
Free with trial A 3D render of a blue bar chart displaying a downward trend, with bars decreasing in height from left to right. The background features a subtle pattern of translucent upward-pointing arrows, suggesting growth or recovery despite the current decline. The scene is set against a clean, gradient gray backdrop with reflections, creating a modern and professional aesthetic. This image is ideal for representing financial downturns, market analysis, economic challenges, or the concept of overcoming obstacles. Set financial growth decrease illustrations Declining Blue Bar Chart with Upward Arrows Background. A 3D render of a blue bar chart displaying a downward trend, with bars decreasing in height from left to right. The background features a subtle pattern of translucent upward-pointing arrows, suggesting growth or recovery despite the current decline. The scene is set against a clean, gradient gray backdrop with reflections, creating a modern and professional aesthetic. This image is ideal for representing financial downturns, market analysis, economic challenges, or the concept of overcoming obstacles.
Free with trial Stock market icons. Set of 15 stock market trendy minimal icons. Bear, Bull, market analysis, Stock Exchange icon. Design signs for web page, mobile app, packaging design. Vector illustration. Set financial growth decrease vectors Stock market icons set. Stock market icons. Set of 15 stock market trendy minimal icons. Bear, Bull, market analysis, Stock Exchange icon. Design signs for web page, mobile app, packaging design. Vector illustration.