Free with trial Stock Market Graph With City Lights Background Financial Data, Investment, Trading Concept. , Generated by AI. Stock decrease illustrations Stock Market Graph With City Lights Background Financial Data, Investment, Trading Concept.
Free with trial A dynamic 3D illustration of a glossy red arrow pointing downwards in a jagged, volatile path. Isolated on a white background, this graphic icon is a powerful symbol for negative concepts. It represents decline, decrease, failure, loss, and crisis. This visual is perfect for illustrating stock market crashes, economic recession, financial downturns, poor business performance, or any downward trend in data and statistics. An ideal element for reports, presentations, and financial news, with ample copy space. Stock decrease illustrations Red Jagged Arrow of Decline - Financial Crisis Concept. A dynamic 3D illustration of a glossy red arrow pointing downwards in a jagged, volatile path. Isolated on a white background, this graphic icon is a powerful symbol for negative concepts. It represents decline, decrease, failure, loss, and crisis. This visual is perfect for illustrating stock market crashes, economic recession, financial downturns, poor business performance, or any downward trend in data and statistics. An ideal element for reports, presentations, and financial news, with ample copy space.
Free with trial Financial chart illustrating stock price trends with candlestick patterns. Vertical and horizontal axes display price and time, respectively. A prominent green upward arrow indicates profit, while a red 'Put tag suggests a potential decrease. Blue and red candlestick bars detail price movements. Curved lines highlight trend directions. Labels like Profit add contextual information. The overall theme suggests a focus on cryptocurrency or stock market analysis. Stock decrease illustrations Option Trading Chart AI generated. Financial chart illustrating stock price trends with candlestick patterns. Vertical and horizontal axes display price and time, respectively. A prominent green upward arrow indicates profit, while a red 'Put tag suggests a potential decrease. Blue and red candlestick bars detail price movements. Curved lines highlight trend directions. Labels like Profit add contextual information. The overall theme suggests a focus on cryptocurrency or stock market analysis.
Free with trial This high-quality vector graphic features a simple, hand-drawn red arrow pointing downwards. It's perfect for illustrating decline, decrease, or negative trends in presentations, reports, websites, and infographics. The clean and minimalist style ensures versatility across various design projects. Easily scalable and editable, this vector graphic is a valuable addition to any designer's toolkit. Its simple design makes it suitable for a wide range of applications and audiences. Stock decrease illustrations Hand-Drawn Red Down Arrow: Simple, Clean, and Versatile Vector Graphic for Presentations, Websites, and More. Perfect. This high-quality vector graphic features a simple, hand-drawn red arrow pointing downwards. It's perfect for illustrating decline, decrease, or negative trends in presentations, reports, websites, and infographics. The clean and minimalist style ensures versatility across various design projects. Easily scalable and editable, this vector graphic is a valuable addition to any designer's toolkit. Its simple design makes it suitable for a wide range of applications and audiences.
Free with trial Silhouette of a head with stock market decline graph overlay, red and black tones, digital concept of financial crisis. 3D. Stock decrease illustrations Silhouette of a head with stock market decline graph overlay, red and black tones, digital concept of financial crisis. 3D
Free with trial US dollar tumbling down as symbol for inflation and devaluation. Digital financial visualization of red stock market graph line trending downward on a dark background. Economic falling and recession. Generative Ai. Stock decrease illustrations US dollar tumbling down as symbol for inflation and devaluation. Digital financial visualization of red stock market graph line
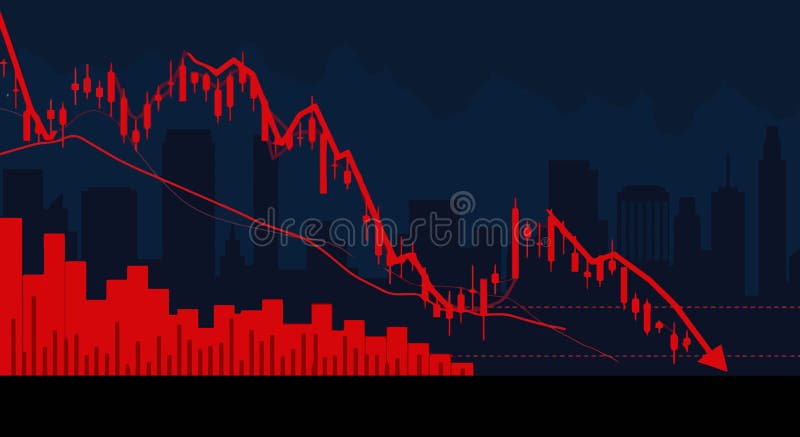
Free with trial Stock market trading technical analysis bar chart fall banner. Business candlestick graph exchange down trend. Economic crisis and investment loss graph. Trader financial index crash. Money losing eps. Stock decrease vectors Stock market trading technical analysis bar chart fall banner. Business candlestick graph exchange down trend. Economic
Free with trial Set Global economic crisis Dollar rate decrease Drop in crude oil price Tearing money banknote Employee dismissal Mobile stock trading and Falling property prices icon. Vector. Stock decrease vectors Set Global economic crisis, Dollar rate decrease, Drop in crude oil price, Tearing money banknote, Employee dismissal. Set Global economic crisis Dollar rate decrease Drop in crude oil price Tearing money banknote Employee dismissal Mobile stock trading and Falling property prices icon. Vector.
Free with trial Stock market charts depicting a downward trend, symbolizing a financial crisis, set on a dark, abstract background, illustrating the concept of economic decline. Stock decrease illustrations Stock market charts depicting a downward trend, symbolizing a financial crisis, set on a dark, abstract background, illustrating
Free with trial Bear market stock exchange fall concept - golden bear statue on wall street in financial district during golden hour. Stock decrease illustrations Bear market stock exchange fall concept - golden bear statue on wall street in financial district
Free with trial A sinking stock market graph reflecting investor panic. Generative AI. Stock decrease illustrations A sinking stock market graph reflecting investor panic
Free with trial A sinking stock market graph reflecting investor panic. Generative AI. Stock decrease illustrations A sinking stock market graph reflecting investor panic
Free with trial 3D rendered graph showing decreasing stock prices against a circuit board background. Illustrates market downturn in technology sector. Stock decrease illustrations Market Trend Analysis: 3D Render of Decreasing Stock Prices and Circuit Board Background Illustrating Technological Market. 3D rendered graph showing decreasing stock prices against a circuit board background. Illustrates market downturn in technology sector
Free with trial Magnifying glass is focusing on a dollar sign as an arrow points down indicating a decrease in money or value. Stock decrease vectors Magnifying glass showing dollar sign with downward arrow indicating economic downturn. Magnifying glass is focusing on a dollar sign as an arrow points down indicating a decrease in money or value
Free with trial Stock Market icon vector image. Suitable for mobile application web application and print media. Stock decrease illustrations Stock Market icon vector image.
Free with trial Image displaying stock market chart, rising or falling trends Generative AI. Stock decrease illustrations Image displaying stock market chart, rising or falling trends
Free with trial Financial data shows downward trend. Spreadsheet exhibits economic decline. Magnifying glass focuses on, negative indicators. Business recession impacting market. Stock loss visible. Stock decrease illustrations Financial data shows downward trend. Spreadsheet exhibits economic decline. Magnifying glass focuses on negative indicators. Financial data shows downward trend. Spreadsheet exhibits economic decline. Magnifying glass focuses on, negative indicators. Business recession impacting market. Stock loss visible.
Free with trial Image of businessman standing in modern office with hands on head looking distressed at large screen displaying fluctuating financial red charts indicating bear market. Recession, stock market concept. Stock decrease illustrations Image of businessman standing in modern office with hands on head looking distressed at large screen displaying fluctuating
Free with trial Stock market chart arrows in red and green are seen as graphic elements and are seen in a 3-d illustration. Arrows indicate the upward and downward gains and losses on the Dow. Stock decrease illustrations Stock market chart arrows in red and green are seen as graphic elements and are seen in a 3-d illustration
Free with trial Stock market trading technical analysis bar chart fall banner. Business candlestick graph exchange down trend. Economic downturn and investment loss graph. Trader financial index crash and bankruptcy. Stock decrease illustrations Stock market trading technical analysis bar chart fall banner. Business candlestick graph exchange down trend. Economy. Stock market trading technical analysis bar chart fall banner. Business candlestick graph exchange down trend. Economic downturn and investment loss graph. Trader financial index crash and bankruptcy
Free with trial Stock market trading technical analysis bar chart fall banner. Business candlestick graph exchange down trend. Economic downturn and investment loss graph. Trader financial index crash and bankruptcy. Stock decrease vectors Stock market trading technical analysis bar chart fall banner. Business candlestick graph exchange down trend. Economy. Stock market trading technical analysis bar chart fall banner. Business candlestick graph exchange down trend. Economic downturn and investment loss graph. Trader financial index crash and bankruptcy
Free with trial Stock market trading graph in red color as economy 3D illustration background. Stock decrease illustrations Stock market trading graph in red color as economy 3D illustration
Free with trial Red 3d arrow going down stock icon on white background. Bankruptcy, financial market crash icon for your web site design, logo, app, UI. graph chart downtrend symbol. chart going down sign. Stock decrease vectors Red 3d arrow going down stock icon on white background. Bankruptcy, financial market crash icon
Free with trial Anxious Trader Female Character Panics As Ethereum Cryptocurrency Price Decrease, Fearing Financial Loss And Uncertainty In Market, Exacerbating The Downward Trend. Cartoon People Vector Illustration. Stock decrease vectors Anxious Trader Female Character Panics As Cryptocurrency Prices Decrease, Fearing Financial Loss And Uncertainty. Anxious Trader Female Character Panics As Ethereum Cryptocurrency Price Decrease, Fearing Financial Loss And Uncertainty In Market, Exacerbating The Downward Trend. Cartoon People Vector Illustration
Free with trial The decline in the bar graph is due to the stock market falling, economic crash, investing failure or mistake, price drop, recession, investment risk concept, stock price decline concept flat design. Stock decrease vectors The decline in the bar graph is due to the stock market falling, economic crash, investing failure or mistake, , price drop. The decline in the bar graph is due to the stock market falling, economic crash, investing failure or mistake, price drop, recession, investment risk concept, stock price decline concept flat design
Free with trial Economic crisis financial downturn analysis magnifying glass examines dollar bill with lightning bolt surrounded by falling stock charts and coins abstract background Vector illustration. Stock decrease vectors Economic crisis financial downturn analysis magnifying glass examines dollar bill with lightning bolt surrounded by
Free with trial A detailed circuit board displaying a red declining stock market graph, representing challenges in the semiconductor and technology sectors - AI-generated. Stock decrease illustrations A detailed circuit board displaying a red declining stock market graph, representing challenges in the semiconductor and
Free with trial A striking and impactful collection of illustrations depicting a stock market crash with dramatic downward trend graphs. Stock decrease vectors Stock market crash down graph illustration. A striking and impactful collection of illustrations depicting a stock market crash with dramatic downward trend graphs
Free with trial Close-up of a red circuit board with a glowing red stock market graph, representing fluctuations in the tech and semiconductor industry - AI-generated. Stock decrease illustrations Close-up of a red circuit board with a glowing red stock market graph, representing fluctuations in the tech and semiconductor
Free with trial Piles of gold coins in front of a digital stock market crash graph, signifying financial crisis on a dark red background, concept of investment loss. 3D Rendering. Stock decrease illustrations Piles of gold coins in front of a digital stock market crash graph, signifying financial crisis on a dark red background, concept
Free with trial Red 3d arrow going down stock icon on white background. Bankruptcy, financial market crash icon for your web site design, logo, app, UI. graph chart downtrend symbol. chart going down sign. Stock decrease vectors Red 3d arrow going down stock icon on white background. Bankruptcy, financial market crash icon for your web
Free with trial A close-up view of a monitor displaying complex financial data, including stock market charts and numerical values. Stock market Data Displayed on a Monitor. Stock decrease illustrations Stock market Data Displayed on a Monitor
Free with trial Close-up of a microchip with a red downward stock market graph on a circuit board, symbolizing declining tech sector performance - AI-generated. Stock decrease illustrations Close-up of a microchip with a red downward stock market graph on a circuit board, symbolizing declining tech sector performance
Free with trial Coronavirus impact global economy stock markets financial crisis background. Cost reduction dollar down icon from lines, triangles and particle style design. Stock decrease vectors Coronavirus impact global economy stock markets financial crisis background. Cost reduction dollar down icon from lines, tria... Coronavirus impact global economy stock markets financial crisis background. Cost reduction dollar down icon from lines, triangles and particle style design.
Free with trial Reduction chart icon Vector symbol or sign set collection in black and white outline. Stock decrease vectors Decline Chart Icon Illustrating Decrease in Performance, Economic Downturn, and Analytical Data. Reduction chart icon Vector symbol or sign set collection in black and white outline
Free with trial Clean animated bar chart visualizing rising and falling market trends with green bars representing growth, profit, and positive performance, and red bars indicating decline, loss, and negative movement. Symbolizes financial volatility, stock market cycles, economic fluctuations, investment performance, and business analytics. Ideal for illustrating bullish and bearish phases, economic indicators, trading activity, and financial data visualization. Stock decrease illustrations Financial Market Trend Animation Showing Upturn and Downturn Phases. Clean animated bar chart visualizing rising and falling market trends with green bars. Clean animated bar chart visualizing rising and falling market trends with green bars representing growth, profit, and positive performance, and red bars indicating decline, loss, and negative movement. Symbolizes financial volatility, stock market cycles, economic fluctuations, investment performance, and business analytics. Ideal for illustrating bullish and bearish phases, economic indicators, trading activity, and financial data visualization.
Free with trial Digital isometric warning icon and red alert stripes on a dark financial background with blurred stock market charts and falling graphs. Concept of global economic crisis, market crash, system failure, and high investment risk. Stock decrease illustrations Warning icon on red financial stock market crash background. Digital isometric warning icon and red alert stripes on a dark financial background with blurred stock market charts and falling graphs. Concept of global economic crisis, market crash, system failure, and high investment risk.
Free with trial 3D Isometric Flat Vector Illustration of Resolving Financial Problems, Navigating Economic Downturns, Opportunities For Investors In A Recovering Stock Market. Stock decrease vectors 3D Isometric Flat Vector Illustration of Resolving Financial Problems
Free with trial A polygon bull charges forward against a backdrop of a stock market chart symbolizing finance This image can be used for financial promotions and market analysis. Stock decrease illustrations Bull Market Concept with Polygon Bull and Stock Market Chart. A polygon bull charges forward against a backdrop of a stock market chart symbolizing finance This image can be used for financial promotions and market analysis
Free with trial Stock market trading graph in red color as economy 3D illustration background. Stock decrease illustrations Stock market trading graph in red color as economy 3D
Free with trial Stock market trading graph in red color as economy 3D illustration background. Stock decrease illustrations Stock market trading graph in red color as economy 3D
Free with trial Stock market trading graph in red color as economy 3D illustration background. Stock decrease illustrations Stock market trading graph in red color as economy 3D
Free with trial Gold coins and pink arrows pointing downward. Financial loss, currency drop, stock market decline, price reduction and economic downturn concept. 3d vector icon. Cartoon minimal style. Stock decrease vectors Gold coins and pink arrows pointing downward. Financial loss, currency drop, stock market decline, price reduction and economic
Free with trial Stock market graph with blue and orange lines on dark grid background For Social Media Post Size. Stock decrease illustrations Stock market graph with blue and orange lines on dark grid background
Free with trial A glowing red circuit board with a declining stock market graph, symbolizing challenges in the semiconductor and tech industry - AI-generated. Stock decrease illustrations A glowing red circuit board with a declining stock market graph, symbolizing challenges in the semiconductor and tech industry
Free with trial A glowing red circuit board with a declining stock market graph, symbolizing challenges in the semiconductor and tech industry - AI-generated. Stock decrease illustrations A glowing red circuit board with a declining stock market graph, symbolizing challenges in the semiconductor and tech industry
Free with trial Market red arrow down illustration decline decrease, drop fall, turn recession market red arrow down. Stock decrease illustrations Market red arrow down
Free with trial Woman think about stock down trend. Stock market crash, crypto price fall, loss money from financial crisis or wrong speculation of trading concept. Flat vector illustration isolated on white background. Stock decrease vectors Woman think about stock down trend. Stock market crash, crypto price fall, loss money from financial crisis or wrong speculation
Free with trial Three Candles vector Stock Market Trading concept icon or symbol. Stock decrease vectors Three Candles vector Stock Market Trading icon or symbol
Free with trial Chat arrow down icon Vector set on white background. EPS 10. Stock decrease vectors Chart arrow down icon set. decline downward chart vector symbol. stock trend downturn graph sign. negative economy bar Chart. Chat arrow down icon Vector set on white background. EPS 10
Free with trial Chat arrow down icon Vector set on white background. EPS 10. Stock decrease vectors Chart arrow down icon set. decline downward chart vector symbol. stock trend downturn graph sign. negative economy bar Chart. Chat arrow down icon Vector set on white background. EPS 10
Free with trial Three Candles vector Stock Market Trading concept seamless pattern. Stock decrease vectors Three Candles vector Stock Market Trading seamless pattern
Free with trial Red arrows pointing downward over a world map symbolize global financial decline. Stock decrease vectors Global stock market crash with red falling arrows. Red arrows pointing downward over a world map symbolize global financial decline
Free with trial This image shows a declining stock market graph with red candlesticks and bars. Vector illustration design using ai tool. Stock decrease vectors Stock market crash recession. This image shows a declining stock market graph with red candlesticks and bars. Vector illustration design using ai tool.
Free with trial Chat arrow down icon Vector set on white background. EPS 10. Stock decrease vectors Chart arrow down icon set. decline downward chart vector symbol. stock trend downturn graph sign. negative economy bar Chart. Chat arrow down icon Vector set on white background. EPS 10
Free with trial Conceptual financial illustration of a falling stock market index. Red line graph showing sharp decline, volatility, and economic crisis point with a target circle on a dark grid background. Stock decrease illustrations Red stock market graph showing economic crash and financial crisis on dark background. Conceptual financial illustration of a falling stock market index. Red line graph showing sharp decline, volatility, and economic crisis point with a target circle on a dark grid background.
Free with trial Vector Illustration. Stock Price Fall. Arrow On Chart Pointing Down. Bear Head. Stock Market Concept. Stock decrease vectors Bear Market Icon Color. Vector Illustration. Stock Price Fall. Arrow On Chart Pointing Down. Bear Head. Stock Market Concept
Free with trial Financial difficulties, decrease in value of business or company shares, stock market crash, economic crisis, business failure and loss of cash, lose investments, a man falls off the chart. Stock decrease vectors Man falls off the chart
Free with trial Stock market graph with blue and orange lines showing fluctuations, on futuristic dark background grid Generative AI. Stock decrease illustrations Stock market graph with blue and orange lines showing fluctuations, on futuristic dark background grid
Free with trial Stock market graph with blue and orange lines showing fluctuations, on futuristic dark background grid Generative AI. Stock decrease illustrations Stock market graph with blue and orange lines showing fluctuations, on futuristic dark background grid
Free with trial A person analyzing stock market charts with a pointer. Vector art design using ai tool. Stock decrease vectors Stock Market Illustration Charts. A person analyzing stock market charts with a pointer. Vector art design using ai tool.
Free with trial A close-up of a stock market chart showing a sharp downturn. The orange line graph against a dark background with gridlines illustrates the volatility and potential risks in financial markets. The image captures the urgency and anxiety associated with market fluctuations. The "MA 1000" text is visib. Stock decrease illustrations Stock Market Downturn. A close-up of a stock market chart showing a sharp downturn. The orange line graph against a dark background with gridlines illustrates the volatility and potential risks in financial markets. The image captures the urgency and anxiety associated with market fluctuations. The "MA 1000" text is visib
Free with trial Financial difficulties, decrease in value of business or company shares, stock market crash, economic crisis, business failure, loss of cash, lose investments, man points a magnifier to broken arrow. Stock decrease vectors Man points to broken arrow. Financial difficulties, decrease in value of business or company shares, stock market crash, economic crisis, business failure, loss of cash, lose investments, man points a magnifier to broken arrow
Free with trial A 3D stock market chart displays a bearish trend, with red bars dominating the view. The visual represents downturns in market performance and investor sentiment. Stock decrease illustrations Bearish Stock Market Graph. A 3D stock market chart displays a bearish trend, with red bars dominating the view. The visual represents downturns in market performance and investor sentiment.
Free with trial The image displays a candlestick chart, commonly used in financial markets to represent price movements of an asset over time. the chart features red and green candlesticks, where green indicates a price increase and red indicates a price decrease. a yellow line overlays the candlesticks, likely representing a moving average, which is a common technical indicator used to smooth out price data and identify trends. the chart is set against a dark blue background with grid lines, and time intervals are marked along the x-axis. a scale on the right side shows the price values. the overall impression is that of a tool used for technical analysis in trading or investment. Stock decrease illustrations Stock market candlestick chart with moving average. the image displays a candlestick chart, commonly used in financial markets to represent price movements of an asset over time. the chart features red and green candlesticks, where green indicates a price increase and red indicates a price decrease. a yellow line overlays the candlesticks, likely representing a moving average, which is a common technical indicator used to smooth out price data and identify trends. the chart is set against a dark blue background with grid lines, and time intervals are marked along the x-axis. a scale on the right side shows the price values. the overall impression is that of a tool used for technical analysis in trading or investment.
Free with trial A line graph with a decreasing trend is commonly used to depict scenarios like declining sales, decreasing stock prices, or any situation where a decrease in values over time or across categories is a significant aspect of the data. It provides a clear and intuitive way to understand trends and make informed interpretations about the decreasing values being represented. Stock decrease illustrations Chart with decreasing line graph. A line graph with a decreasing trend is commonly used to depict scenarios like declining sales, decreasing stock prices, or any situation where a decrease in values over time or across categories is a significant aspect of the data. It provides a clear and intuitive way to understand trends and make informed interpretations about the decreasing values being represented.
Free with trial Financial difficulties, decrease in value of business or company shares, stock market crash, economic crisis, business failure and loss of cash, lose investments, a man falls off the broken arrow. Stock decrease vectors Man falls off the broken arrow
Free with trial This image shows a downward trend in stock prices with candlestick charts and arrows indicating the decline. Vector illustration design using ai tool. Stock decrease vectors Stock crash. This image shows a downward trend in stock prices with candlestick charts and arrows indicating the decline. Vector illustration design using ai tool.
Free with trial Bear representing the bear market, standing in front of a downtrend stock market graph. Stock decrease illustrations Bear standing in front of downtrend stock market graph, bear market. Bear representing the bear market, standing in front of a downtrend stock market graph
Free with trial Image of a stock market chart with a red and blue candlestick pattern, plotted on a dark grid, suggesting financial trends and investment analysis. Image is generated using AI. Stock decrease illustrations Stock Market Chart on a Grid. Image of a stock market chart with a red and blue candlestick pattern, plotted on a dark grid, suggesting financial trends and investment analysis. Image is generated using AI
Free with trial A simple line graph illustration showing fluctuations and an upward trend. The graph is drawn on a grid with a black line and red data points, indicating a period of increase, followed by a decrease, and then a final increase. This image can be used to represent business trends, financial analysis, stock market data, or any data that shows changes over time. Stock decrease vectors Line Graph with Fluctuations. A simple line graph illustration showing fluctuations and an upward trend. The graph is drawn on a grid with a black line and red data points, indicating a period of increase, followed by a decrease, and then a final increase. This image can be used to represent business trends, financial analysis, stock market data, or any data that shows changes over time.
Free with trial This image depicts a dramatic stock market decline, visualized as a falling graph in intense orange and red hues, generated by AI. The dark background emphasizes the severity of the downturn, suggesting potential financial instability or market volatility. The bokeh effect adds a sense of depth and. Stock decrease illustrations AI-Generated Stock Market Dip. This image depicts a dramatic stock market decline, visualized as a falling graph in intense orange and red hues, generated by AI. The dark background emphasizes the severity of the downturn, suggesting potential financial instability or market volatility. The bokeh effect adds a sense of depth and
Free with trial A digital screen shows a sharp decline in stock market indices, indicated by a red arrow and graph. Numbers flash, reflecting significant losses. Stock decrease illustrations Stock Market Crash. A digital screen shows a sharp decline in stock market indices, indicated by a red arrow and graph. Numbers flash, reflecting significant losses
Free with trial This image depicts a long line of miniature people following a downward trending stock market graph, generated by AI. It visually represents economic downturn and its impact on a large population. The contrast between the dense crowd and the falling graph is striking. Stock decrease illustrations People and Stock Market Decline. This image depicts a long line of miniature people following a downward trending stock market graph, generated by AI. It visually represents economic downturn and its impact on a large population. The contrast between the dense crowd and the falling graph is striking.
Free with trial Graph with a downward trend shows a decrease in profits. Stock decrease vectors Money downward trend graph showing economic crisis. Graph with a downward trend shows a decrease in profits
Free with trial Close-up of a smartphone displaying a stock trading application. The screen shows real-time stock charts, including candlestick charts and line graphs, with green and red indicators representing price increases and decreases. The app also features portfolio summaries and details for various stocks, such as AAPL, GOOG, and MSFT. The image represents investment, finance, and the use of technology in stock market analysis. Stock decrease illustrations Stock Trading App on Smartphone. Close-up of a smartphone displaying a stock trading application. The screen shows real-time stock charts, including candlestick charts and line graphs, with green and red indicators representing price increases and decreases. The app also features portfolio summaries and details for various stocks, such as AAPL, GOOG, and MSFT. The image represents investment, finance, and the use of technology in stock market analysis.
Free with trial - A cartoon illustration of a man riding a black bull with a green arrow pointing left. The man is wearing a cowboy hat and a plaid shirt. The background is a stock market chart. The illustration symbolizes a downtrend in the market. Stock decrease illustrations Cartoon man riding a bull, stock market down. - A cartoon illustration of a man riding a black bull with a green arrow pointing left. The man is wearing a cowboy hat and a plaid shirt. The background is a stock market chart. The illustration symbolizes a downtrend in the market.
Free with trial Stock Exchange icon vector image. Suitable for mobile application web application and print media. Stock decrease vectors Stock Exchange icon vector image.
Free with trial The stock market crash is depicted with a red graph, symbolizing financial loss and economic decline. The crisis represents a significant downturn in investment. Stock decrease illustrations Stock market crash with red graph. The stock market crash is depicted with a red graph, symbolizing financial loss and economic decline. The crisis represents a significant downturn in investment.