Free with trial A 3D sticker of a red downturn arrow for Stock, designed with a transparent background. Stock decrease illustrations A 3D sticker of a red downturn arrow for Stock, designed with a transparent background.
Free with trial A red stock market graph is displayed on a digital screen. The background is a blurred image of a financial district with people walking by. The graph indicates a decline in the market. Stock decrease illustrations Red Stock Market Graph Displayed on a Digital Screen in a Financial District at Night. A red stock market graph is displayed on a digital screen. The background is a blurred image of a financial district with people walking by. The graph indicates a decline in the market
Free with trial 3d rendering red arrow crashing ground with financial chart background. Concept of stock market crash, economic recession and investment loss in dark blue tone. Generative AI. Stock decrease illustrations 3d rendering red arrow crashing ground with financial chart background Concept of stock market crash economic recession and. 3d rendering red arrow crashing ground with financial chart background. Concept of stock market crash, economic recession and investment loss in dark blue tone. Generative AI
Free with trial A striking red downward arrow is prominently placed on a chart highlighting a notable decrease in financial metrics over time suggesting a troubling trend in market analysis. Stock decrease illustrations A striking red downward arrow is prominently placed on a chart highlighting a notable decrease in financial metrics over time
Free with trial Set of financial arrows up and down. Green and red arrows with shadow. Increase and decrease. Vector 10 EPS. Stock decrease illustrations Set of financial arrows up and down. Green and red arrows with shadow.
Free with trial A digital screen displays a red stock market graph in a financial district. The graph depicts a downward trend, suggesting potential losses or a market downturn, with city buildings out of focus in the background. Stock decrease illustrations Red Stock Market Graph displayed on a digital screen in the Financial District. A digital screen displays a red stock market graph in a financial district. The graph depicts a downward trend, suggesting potential losses or a market downturn, with city buildings out of focus in the background
Free with trial A flat style illustration of market trend with upward and downward arrows and wavy lines against black background. Stock decrease vectors Stock market trend illustration showing upward and downward direction in financial trading. A flat style illustration of market trend with upward and downward arrows and wavy lines against black background.
Free with trial Ascending green chart indicates positive financial growth in stock market investment ,Generative ai. Stock decrease illustrations Ascending green stock chart symbolizes positive financial growth and investment success in market. Ascending green chart indicates positive financial growth in stock market investment ,Generative ai
Free with trial A red declining stock market graph overlays a city skyline, symbolizing economic downturn and financial instability. Stock decrease illustrations A red declining stock market graph overlays a city skyline, symbolizing economic downturn and financial instability
Free with trial Financial candlestick chart overlaying Baltimore cityscape, silhouetted against amber evening sky, depicting market volatility. Stock decrease illustrations Candle stick graph fluctuating over a Baltimore skyline at sunset, showing the ups and downs of the stock market. Financial candlestick chart overlaying Baltimore cityscape, silhouetted against amber evening sky, depicting market volatility
Free with trial A laptop screen showing a stock market crash with a declining red graph, symbolizing financial loss and economic downturn - generated AI. Stock decrease illustrations Stock market crash displayed on laptop screen with red graph. A laptop screen showing a stock market crash with a declining red graph, symbolizing financial loss and economic downturn - generated AI
Free with trial Financial difficulties, decrease in value of business or company shares, stock market crash, economic crisis, business failure, loss of cash, lose investments, a man is shackled in crisis. Stock decrease vectors Man is shackled in crisis
Free with trial A financial chart stock market downtrend red line trading graph investment loss crisis volatility data financial chart stock market downtrend. Stock decrease illustrations Financial chart stock market downtrend red line trading graph investment loss crisis volatility data financial chart stock market
Free with trial A red line graph depicting a downward trend in stock prices over time, with specific percentage decreases marked at various points. Stock decrease illustrations Stock market graph showing significant decline over several months with percentage drops highlighted. A red line graph depicting a downward trend in stock prices over time, with specific percentage decreases marked at various points
Free with trial A minimalist illustration showing a decreasing bar graph with an arrow, and a magnifying glass over a dollar sign. Flat style with grey and orange. Stock decrease vectors Economic Downturn and Financial Analysis: Decrease Graph with Magnifying Glass Over Dollar Sign. A minimalist illustration showing a decreasing bar graph with an arrow, and a magnifying glass over a dollar sign. Flat style with grey and orange.
Free with trial Red arrow crashing into gold coins stack representing financial crisis, inflation and stock market loss. Generative AI. Stock decrease illustrations Red arrow crashing into gold coins stack representing financial crisis inflation and stock market loss
Free with trial Stacks of coins with green up arrow and red down arrow representing stock market fluctuation and investment risk. Generative AI. Stock decrease illustrations Stacks of coins with green up arrow and red down arrow representing stock market fluctuation and investment risk
Free with trial Close-up image depicting a red arrow pointing downwards on a financial graph symbolizing market downturn A pen and cash are subtly included emphasizing financial loss and economic crisis The image evokes themes of recession and economic instability. Stock decrease illustrations Financial Crisis Concept Red Arrow Downward Trend on Stock Market Graph with Pen and Cash AI generated. Close-up image depicting a red arrow pointing downwards on a financial graph symbolizing market downturn A pen and cash are subtly included emphasizing financial loss and economic crisis The image evokes themes of recession and economic instability
Free with trial A high-tech visualization of financial data, showing a glowing blue bar chart and line graphs representing stock market trends, business analytics, and economic growth. Stock decrease illustrations Futuristic digital stock market chart with glowing blue graphs and data analysis on a dark background. A high-tech visualization of financial data, showing a. A high-tech visualization of financial data, showing a glowing blue bar chart and line graphs representing stock market trends, business analytics, and economic growth
Free with trial Red arrow going down stock with euro coin icon on white background. Bankruptcy, financial market crash icon for your web site design, logo, app, UI. graph chart downtrend symbol. chart going down. Stock decrease vectors Red arrow going down stock with euro coin icon on white background. Bankruptcy, financial market crash icon for your web
Free with trial Investment analyst analyzing stock market crash ,financial warning signals with bearish chart ,digital alert interface ,economic downturn, volatile market conditions, urgent investment risk assessment. Stock decrease illustrations Investment analyst analyzing stock market crash ,financial warning signals with bearish chart ,digital alert interface ,economic
Free with trial A digital graphic depicting a financial chart with two prominent line graphs. A blue line trends upward, representing a rising stock price, while a red line trends downward, indicating a decrease in trading volume. The chart is set against a faint, blurred city background, featuring a grid system on the vertical axis labeled 'Volume' and a horizontal axis labeled 'Time', with a red arrow at the. Stock decrease illustrations A financial line chart showing the inverse relationship between stock price and trading volume data. A digital graphic depicting a financial chart with two prominent line graphs. A blue line trends upward, representing a rising stock price, while a red line trends downward, indicating a decrease in trading volume. The chart is set against a faint, blurred city background, featuring a grid system on the vertical axis labeled 'Volume' and a horizontal axis labeled 'Time', with a red arrow at the
Free with trial Financial difficulties, decrease in value of business or company shares, stock market crash, economic crisis, business failure, loss of cash, lose investments, a man stops a crisis ball on a cliff. Stock decrease vectors Man stops crisis ball on cliff. Financial difficulties, decrease in value of business or company shares, stock market crash, economic crisis, business failure, loss of cash, lose investments, a man stops a crisis ball on a cliff
Free with trial Financial difficulties, decrease in value of business or company shares, stock market crash, economic crisis, business failure, loss of cash, lose investments, man falls from the word crisis. Stock decrease vectors Man falls from the word crisis
Free with trial 3d red arrow crashing down with falling stock market bar charts, economic recession, financial crisis and market crash illustration. Generative AI. Stock decrease illustrations 3d red arrow crashing down with falling stock market bar charts economic recession financial crisis and market crash. 3d red arrow crashing down with falling stock market bar charts, economic recession, financial crisis and market crash illustration. Generative AI
Free with trial A visually stunning digital depiction of stock market analysis featuring colorful graphs and bars that represent current finance trends and data insights. Stock decrease illustrations Stock market analysis with colorful graphs and bars indicating data trends in a futuristic digital space. A visually stunning digital depiction of stock market analysis featuring colorful graphs and bars that represent current finance trends and data insights
Free with trial Concept of economic collapse by falling graph, chart, highlighting global recession fueled by inflation, stock market crash, financial crisis, falling income, GDP decline, capital reduction. Stock decrease illustrations Concept of economic collapse by falling graph, chart, highlighting global recession fueled by inflation, stock market crash
Free with trial Concept of economic collapse by falling graph, chart, highlighting global recession fueled by inflation, stock market crash, financial crisis, falling income, GDP decline, capital reduction. Stock decrease illustrations Concept of economic collapse by falling graph, chart, highlighting global recession fueled by inflation, stock market crash
Free with trial Red 3d arrow going down stock icon on white background. Bankruptcy, financial market crash icon for your web site design, logo, app, UI. graph chart downtrend symbol. chart going down sign. Stock decrease vectors Red 3d arrow going down stock icon on white background. Bankruptcy, financial market crash icon for your web site design
Free with trial A visual representation of a financial downturn. A hand places a downward pointing arrow on a graph showing a decline. Symbolizes economic recession, investment loss, and business failure. Stock decrease illustrations Stock market crash financial crisis investment loss business failure economic recession downtrend graph chart. A visual representation of a financial downturn. A hand places a downward pointing arrow on a graph showing a decline. Symbolizes economic recession, investment loss, and business failure.
Free with trial Visual representation of a sharp economic downturn. Red bars and declining graphs depict financial loss and market crash. Represents recession, investment risk, and a negative economic trend. Stock decrease illustrations Stock market crash chart financial crisis economic recession investment loss downtrend graph red bars decline. Visual representation of a sharp economic downturn. Red bars and declining graphs depict financial loss and market crash. Represents recession, investment risk, and a negative economic trend.
Free with trial Dynamic grid of fluctuating stock prices and financial data with columns and rows showing the volatile market changes in green and red creating a high-tech abstract visualization. Stock decrease illustrations Abstract data visualization of stock market prices and financial data in rows and columns with price changes in green and red. Dynamic grid of fluctuating stock prices and financial data with columns and rows showing the volatile market changes in green and red creating a high-tech abstract visualization
Free with trial A cracked piggy bank stands amidst scattered coins, reflecting a financial crisis. A blurred stock market chart in the background symbolizes economic downturn, and investments failing. Stock decrease illustrations Broken piggy bank with coins. Financial crisis shown with damaged money box and dropping stock prices in background. Economic. A cracked piggy bank stands amidst scattered coins, reflecting a financial crisis. A blurred stock market chart in the background symbolizes economic downturn, and investments failing
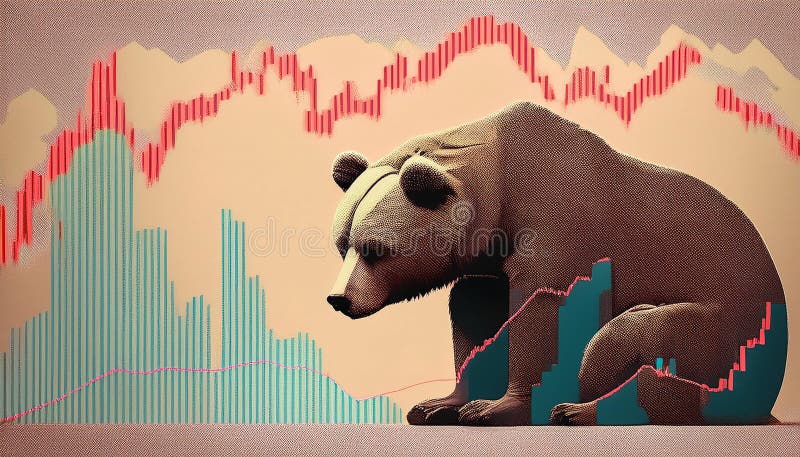
Free with trial Bad stock market chart and sad bear. Stock decrease illustrations Bad stock market chart and sad bear
Free with trial Concept of economic collapse by falling graph, chart, highlighting global recession fueled by inflation, stock market crash, financial crisis, falling income, GDP decline, capital reduction. Stock decrease illustrations Concept of economic collapse by falling graph, chart, highlighting global recession fueled by inflation, stock market crash
Free with trial The worldwide market is currently facing a financial slowdown, marked by a decrease in currency value, increasing inflation rates, and an economic recession that is moving in a negative direction. Stock decrease vectors Global market experiencing financial downturn, showing a currency decline, rising inflation, and economic recession with a. The worldwide market is currently facing a financial slowdown, marked by a decrease in currency value, increasing inflation rates, and an economic recession that is moving in a negative direction
Free with trial Set Isometric line Mobile stock trading, Global economic crisis, Drop crude oil price and Briefcase icon. Vector. Stock decrease illustrations Set Isometric line Mobile stock trading, Global economic crisis, Drop crude oil price and Briefcase icon. Vector
Free with trial A hand holds a pen over a stack of coins while a digital chart displays a downward trending stock market graph. Stock decrease illustrations Hand writing on financial chart showing declining stock market with stacked coins representing economic downturn. A hand holds a pen over a stack of coins while a digital chart displays a downward trending stock market graph
Free with trial Global stock market crash concept with red arrow moving down over world map background and financial trading charts. Generative AI. Stock decrease illustrations Global stock market crash concept with red arrow moving down over world map background and financial trading charts
Free with trial Set of financial arrows up and down. Green and red arrows. Increase and decrease. Vector 10 EPS. Stock decrease illustrations Set of financial arrows up and down. Green and red arrows.
Free with trial Stock Exchange icon vector image. Suitable for mobile application web application and print media. Stock decrease vectors Stock Exchange icon vector image.
Free with trial Red financial chart with falling line graph and market numbers representing stock market crash economic decline trading loss volatility and financial risk analysis. Stock decrease illustrations AI generated red financial chart with falling line graph and market numbers representing stock market crash economic decline. red financial chart with falling line graph and market numbers representing stock market crash economic decline trading loss volatility and financial risk analysis
Free with trial Business hand touching the turning point from growth to crash on a digital stock market graph, financial crisis concept. Generative AI. Stock decrease illustrations Business hand touching the turning point from growth to crash on a digital stock market graph financial crisis concept
Free with trial Golden dollar symbol sinking quicksand representing economic downturn. Concept of financial crisis, monetary loss, wealth decrease, money issues. Economic instability, risk recession. Stock decrease illustrations Golden dollar symbol sinking quicksand representing economic downturn. Concept of financial crisis, monetary loss, wealth
Free with trial Red arrow breaking out of computer monitor screen with graph. Concept of online stock trading loss, digital market crash and technology business failure. Generative AI. Stock decrease illustrations Red arrow breaking out of computer monitor screen with graph Concept of online stock trading loss digital market crash and. Red arrow breaking out of computer monitor screen with graph. Concept of online stock trading loss, digital market crash and technology business failure. Generative AI
Free with trial Diversity Decline Two pie charts showing the demographic distribution of a neighborhood before and after gentrification highlighting the decrease in diversity as affluent newcomers. Stock decrease vectors Diversity Decline Two pie charts showing the demographic distribution of a neighborhood before and after gentrification
Free with trial A visual representation of financial decline showing stacks of gold coins decreasing in height accompanied by a downward-trending arrow symbolizing economic recession and market loss. Stock decrease illustrations Financial decline graph downward trend stacked coins money decrease economic crisis stock market drop white background. A visual representation of financial decline showing stacks of gold coins decreasing in height accompanied by a downward-trending arrow symbolizing economic recession and market loss
Free with trial Neon glowing red stock market arrow moving down on dark background symbolizing financial loss, crypto crash, and recession. Generative AI. Stock decrease illustrations Neon glowing red stock market arrow moving down on dark background symbolizing financial loss crypto crash and recession
Free with trial Red downward and green upward percentage-marked arrows. Three-dimensional visual graphs for discounts, interest rates, stock market changes, and economic data. Stock decrease illustrations Red downward and green upward percentage-marked arrows. Three-dimensional visual graphs for discounts, interest rates, stock
Free with trial Cost reduction icon with dollar sign and downward arrow in circle. Financial symbol for, saving money. Economy and budget concept. Decrease expense logo. Stock decrease illustrations Cost reduction icon with dollar sign and downward arrow in circle. Financial symbol for saving money. Economy and budget concept. Cost reduction icon with dollar sign and downward arrow in circle. Financial symbol for, saving money. Economy and budget concept. Decrease expense logo.
Free with trial Stock Market Down icon vector image. Suitable for mobile application web application and print media. Stock decrease vectors Stock Market Down icon vector image.
Free with trial Golden GDP letters are set against a dynamic stock market chart, illustrating complex economic analysis and fluctuating investment with both profit and loss. Stock decrease illustrations Gross Domestic Product GDP concept featuring golden letters and a stock market chart with both upward and downward trends. Golden GDP letters are set against a dynamic stock market chart, illustrating complex economic analysis and fluctuating investment with both profit and loss
Free with trial Red stock market chart crashing with downward arrow indicators on digital background, financial loss and economic recession concept. Generative AI. Stock decrease illustrations Red stock market chart crashing with downward arrow indicators on digital background financial loss and economic recession. Red stock market chart crashing with downward arrow indicators on digital background, financial loss and economic recession concept. Generative AI
Free with trial Hands holding a tablet displaying a stock market graph, illustrating finance, investment analysis, and modern digital trading. Stock decrease illustrations Hands holding tablet displaying stock market graph. Hands holding a tablet displaying a stock market graph, illustrating finance, investment analysis, and modern digital trading.
Free with trial Financial newspaper showing stock market crash with charts and numbers, concept of financial crisis. Stock decrease illustrations Financial newspaper showing stock market crash
Free with trial A close-up view of a financial candlestick chart displaying an overall upward trend. The chart features numerous blue and white candlesticks, which represent price movements over specific periods. Blue candlesticks typically indicate a price increase, while white ones suggest a decrease. Overlaying the candlesticks are two smooth lines, one green and one light blue, which are likely moving. Stock decrease illustrations Uptrending candlestick chart illustrating financial market growth and stock trading analysis isolated on white background. A close-up view of a financial candlestick chart displaying an overall upward trend. The chart features numerous blue and white candlesticks, which represent price movements over specific periods. Blue candlesticks typically indicate a price increase, while white ones suggest a decrease. Overlaying the candlesticks are two smooth lines, one green and one light blue, which are likely moving
Free with trial Red chart shows financial market decline, loss. Candlestick pattern visualizes negative trend, crisis, fall. Bear market concept, economic recession, investment risks, stock collapse. Stock decrease illustrations Red chart shows financial market decline, loss. Candlestick pattern visualizes negative trend, crisis, fall. Bear market concept
Free with trial Stressed businessman with falling red arrow graph overlay indicating financial crisis, bankruptcy, and stock market recession. Generative AI. Stock decrease illustrations Stressed businessman with falling red arrow graph overlay indicating financial crisis bankruptcy and stock market recession
Free with trial Global financial market chart with downward arrows candlestick data and world map background representing stock decline economic crisis trading volatility and investment risk analysis. Stock decrease illustrations AI generated global financial market chart with downward arrows candlestick data and world map background representing stock. global financial market chart with downward arrows candlestick data and world map background representing stock decline economic crisis trading volatility and investment risk analysis
Free with trial Businessman riding piggy bank jumping down on falling money banknotes bar graph staircase escaping red arrow spear during stock market crash and financial investment loss. Stock decrease vectors Businessman riding piggy bank jumping down on falling money banknotes bar graph staircase escaping red arrow spear during stock
Free with trial Red arrow plunging over gold coins, symbolizing financial downturn, market crash, economic recession, stock losses, and decreased profits. Ideal for business, finance reports, this image is generated using AI. Stock decrease vectors Red arrow plunging over gold coins, symbolizing financial downturn, market crash, economic recession, stock losses, and decreased
Free with trial Three stacks of gold coins decrease in height from left to right, overlaid by a downward-trending red arrow, visually representing financial decline, economic recession, or a stock market crash. Stock decrease illustrations Declining coin stacks symbolize financial crisis economic downturn recession stock market crash isolated on white background. Three stacks of gold coins decrease in height from left to right, overlaid by a downward-trending red arrow, visually representing financial decline, economic recession, or a stock market crash
Free with trial Businessman riding piggy bank jumping down on falling gold bars bar graph staircase escaping red arrow spear during stock market crash and precious metal investment loss. Stock decrease vectors Businessman riding piggy bank jumping down on falling gold bars bar graph staircase escaping red arrow spear during stock market
Free with trial Financial market downturn stock chart arrows falling business decline. Stock decrease illustrations Visual representation of financial market decline with falling stock charts and downward arrows signifying economic recession. Financial market downturn stock chart arrows falling business decline
Free with trial Businessman riding piggy bank jumping down on falling gold coins bar graph staircase escaping red arrow spear during stock market crash and gold price decline concept. Stock decrease vectors Businessman riding piggy bank jumping down on falling gold coins bar graph staircase escaping red arrow spear during stock market
Free with trial Futuristic digital red arrow moving downward showing stock market crash, technology financial loss, and economic recession concept. Generative AI. Stock decrease illustrations Futuristic digital red arrow moving downward showing stock market crash technology financial loss and economic recession concept
Free with trial Red Downward Arrow Showing Global Stock Market Crash and Economic Recession with Falling Percentages Representing Tariff Effects and Financial Crisis 3d rendering. Stock decrease illustrations Red Downward Arrow Showing Global Stock Market Crash and Economic Recession with Falling Percentages Representing Tariff Effects
Free with trial Concept Financial Decline, Red Candlestick Graph, Stock Market, Economic Downturn, Financial Crisis Decline in financial status illustrated by red candlestick background in stock market graph. Stock decrease illustrations Decline in financial status illustrated by red candlestick background in stock market graph. Concept Financial Decline, Red Candlestick Graph, Stock Market, Economic Downturn, Financial Crisis Decline in financial status illustrated by red candlestick background in stock market graph
Free with trial Financial success and investment strategy depicted through Gross Domestic Product GDP, stock market analysis, currency fluctuations, banking, and accounting. Stock decrease illustrations Gross Domestic Product GDP concept displaying economic analysis, stock market trends, and financial growth for intelligent invest. Financial success and investment strategy depicted through Gross Domestic Product GDP, stock market analysis, currency fluctuations, banking, and accounting
Free with trial Illustration of a bear with stock market graphs, representing a bearish financial trend, against a black and orange background, Generative AI. Stock decrease illustrations Illustration of a bear with stock market graphs, representing a bearish financial trend, against a black and orange background
Free with trial Financial arrows up and down. Green and red arrow. Increase and decrease. Vector 10 EPS. Stock decrease illustrations Financial arrows up and down. Green and red arrow.
Free with trial A laconic, simple infographic showing the fall of the Ethereum on the stock exchange. Stock decrease illustrations Abstract infographic of falling Ethereum exchange rate. A laconic, simple infographic showing the fall of the Ethereum on the stock exchange.
Free with trial Dynamic red and blue stock market graph with data points and financial charts on a dark background. Generative AI. Stock decrease illustrations Dynamic red and blue stock market graph with data points and financial charts on a dark background
Free with trial An analytical hand holding a magnifying glass over a stock market chart, symbolizing investment analysis and financial insight, Generative AI. Stock decrease illustrations An analytical hand holding a magnifying glass over a stock market chart, symbolizing investment analysis and financial insight
Free with trial Red arrow going down stock icon on white background. Bankruptcy, financial market crash icon for your web site design, logo, app, UI. graph chart down trend symbol. chart going down sign. Stock decrease vectors Red arrow going down stock icon on white background. Bankruptcy, financial market crash icon for your web site design
Free with trial A high-quality, hand-drawn vector graphic of a simple red arrow pointing downwards. This versatile image is ideal for various applications, including presentations, websites, social media posts, and infographics. The clean and minimalist style ensures seamless integration into any design project. Perfect for visually representing concepts such as decrease, decline, negative trends, or reduction. Download this royalty-free vector today!. Stock decrease illustrations Hand-drawn Red Down Arrow: Simple, Clean Vector Graphic for Presentations, Websites, and Social Media. Perfect for. A high-quality, hand-drawn vector graphic of a simple red arrow pointing downwards. This versatile image is ideal for various applications, including presentations, websites, social media posts, and infographics. The clean and minimalist style ensures seamless integration into any design project. Perfect for visually representing concepts such as decrease, decline, negative trends, or reduction. Download this royalty-free vector today!
Free with trial Concept Declining Financial Market, Red Candlestick Background, Stock Market Graph, Economic Downturn Decline in financial market illustrated by red candlestick background in stock market graph. Stock decrease illustrations Decline in financial market illustrated by red candlestick background in stock market graph. Concept Declining Financial Market, Red Candlestick Background, Stock Market Graph, Economic Downturn Decline in financial market illustrated by red candlestick background in stock market graph
Free with trial This abstract artwork illustrates financial market dynamics with intricate lines and colors, representing stock price movements and trading patterns artistically. Stock decrease illustrations Abstract financial market analysis with intricate lines depicting stock price movements and trading patterns in shades of black. This abstract artwork illustrates financial market dynamics with intricate lines and colors, representing stock price movements and trading patterns artistically