Free with trial A black arrow curves downwards with the word RECESSION above it on a white background. Trend decrease illustrations Black arrow pointing down with the word RECESION on a white background recession. A black arrow curves downwards with the word RECESSION above it on a white background
Free with trial Hand drawn isometric arrow set featuring up and down directions for business and navigation. Trend decrease vectors Hand drawn isometric arrow set featuring up and down directions for business and navigation
Free with trial Bearish stock market, Bear Market and Economic Crisis, Recession or Bubble Burst. concept illustration image. Trend decrease illustrations Bearish stock market, Bear Market and Economic Crisis, Recession or Bubble Burst. concept illustration image
Free with trial Clipboard with bar graph showcasing data analysis and reporting ,Generative ai. Trend decrease illustrations Clipboard with bar graph, data analysis, reporting, and business performance visualization. Clipboard with bar graph showcasing data analysis and reporting ,Generative ai
Free with trial Clean and simple downward arrow symbol in bold black on a plain white background, ideal for web design, user interfaces, infographics, and business presentations. Trend decrease vectors Minimalist black downward arrow icon on white background for business and design. Clean and simple downward arrow symbol in bold black on a plain white background, ideal for web design, user interfaces, infographics, and business presentations
Free with trial Clean and simple downward arrow symbol in bold black on a plain white background, ideal for web design, user interfaces, infographics, and business presentations. Trend decrease vectors Minimalist black downward arrow icon on white background for business and design. Clean and simple downward arrow symbol in bold black on a plain white background, ideal for web design, user interfaces, infographics, and business presentations
Free with trial This image displays a graph illustrating trends and data progression over time with bars and a line chart. Trend decrease illustrations Graph showing trends and data progression over time isolated on white background. This image displays a graph illustrating trends and data progression over time with bars and a line chart
Free with trial A colorful 3D rendering showing a bar chart in descending order with yellow, red, blue and pink bars on a transparent background. Trend decrease vectors 3D colorful decreasing bar chart showing market trends on transparent background. A colorful 3D rendering showing a bar chart in descending order with yellow, red, blue and pink bars on a transparent background.
Free with trial Dynamic graph with one decreasing line and another increasing line in shades of orange. , Generated by AI. Trend decrease illustrations Dynamic graph with one decreasing line and another increasing line in shades of orange.
Free with trial A digital abstract background showing a global financial crisis with red arrows, crashing charts, and a blue downward arrow on a dark grid. 3D Rendering. Trend decrease illustrations Abstract background of global financial crisis with red downward arrows and crashing stock market chart on dark fintech grid. A digital abstract background showing a global financial crisis with red arrows, crashing charts, and a blue downward arrow on a dark grid. 3D Rendering
Free with trial 3D render of green and red bar chart icons with upward and downward arrows symbolizing business growth and financial decline or loss. Trend decrease illustrations Green Growth and Red Decline Bar Chart Icons Representing Business Financial Trends. 3D render of green and red bar chart icons with upward and downward arrows symbolizing business growth and financial decline or loss
Free with trial Financial chart shows falling market data with red and green candlesticks against a dark background, creating a dramatic effect suitable for investment and economic themed visuals. Trend decrease illustrations Dramatic Financial Chart with Green and Red Candlesticks on Black Background. Financial chart shows falling market data with red and green candlesticks against a dark background, creating a dramatic effect suitable for investment and economic themed visuals
Free with trial Wooden cubes with letters spelling COST and green arrows pointing downward on a green background, representing cost reduction concept. 3D Rendering. Trend decrease illustrations Wooden cubes spelling COST with green arrows pointing downward, representing cost reduction, on a light green background. 3D. Wooden cubes with letters spelling COST and green arrows pointing downward on a green background, representing cost reduction concept. 3D Rendering
Free with trial A blue umbrella shields a downward-trending red graph from falling red arrows under a stormy sky. The image suggests protection from market decline. Trend decrease illustrations Blue Umbrella Protecting Downward-Trending Graph from Falling Red Arrows. A blue umbrella shields a downward-trending red graph from falling red arrows under a stormy sky. The image suggests protection from market decline
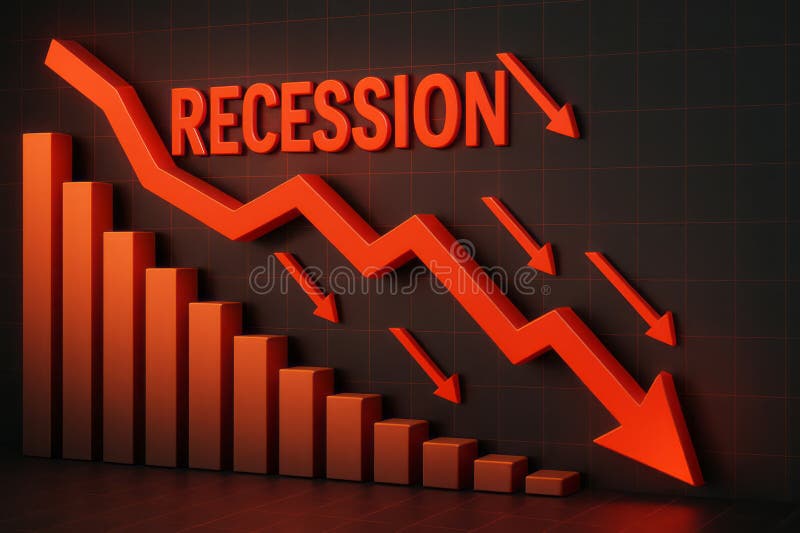
Free with trial This image visually represents an economic recession through downward trends and statistics. The vibrant red arrows emphasize the significant decline in growth, making it an impactful visual for financial analysis. Trend decrease illustrations Dramatic Decline in Economic Growth with Recession Indicator and Downward Arrows in Red. This image visually represents an economic recession through downward trends and statistics. The vibrant red arrows emphasize the significant decline in growth, making it an impactful visual for financial analysis
Free with trial An illustration of a declining stock market graph against a modern building facade the downwardsloping chart represents a bear market, economic downturn, financial loss, or potential recession the urban environment emphasizes the impact of financial fluctuations, generated by AI. Trend decrease illustrations Declining stock market graph on building exterior representing economic downturn. an illustration of a declining stock market graph against a modern building facade the downwardsloping chart represents a bear market, economic downturn, financial loss, or potential recession the urban environment emphasizes the impact of financial fluctuations, generated by AI.
Free with trial Visualize cost reduction with a downward trending graph held in a hand. Illustrates finance, business strategy, and expense management. Shows efficiency and financial planning concepts. Trend decrease illustrations Cost reduction strategy business finance graph chart decreasing costs expense management efficiency concept. Visualize cost reduction with a downward trending graph held in a hand. Illustrates finance, business strategy, and expense management. Shows efficiency and financial planning concepts.
Free with trial A Bitcoin coin with a downward trending red arrow on a graph showing a decline in value,. Trend decrease illustrations A Bitcoin coin with a downward trending red arrow on a graph showing a decline in value
Free with trial Declining Graph With Arrow Cursor Line Icon. Economic Downturn, Market Analysis, And Financial Decline Outline Symbol. Business Performance Tracking. Editable Stroke. Isolated Vector Illustration. Trend decrease vectors Declining Graph With Arrow Cursor Line Icon. Economic Downturn, Market Analysis, And Financial Decline Outline Symbol
Free with trial Modern abstract arrow pointing downward, combining a visual pointer for highlighting information with a business concept of decline, risk and negative trends. Suitable for finance, economy, warning messages, presentations and call to action layouts. Trend decrease illustrations AI generated Arrow Pointing Down, Risk, Decline and Call to Action Business Concept. Modern abstract arrow pointing downward, combining a visual pointer for highlighting information with a business concept of decline, risk and negative trends. Suitable for finance, economy, warning messages, presentations and call to action layouts
Free with trial Modern abstract arrow pointing downward, combining a visual pointer for highlighting information with a business concept of decline, risk and negative trends. Suitable for finance, economy, warning messages, presentations and call to action layouts. Trend decrease illustrations AI generated Arrow Pointing Down, Risk, Decline and Call to Action Business Concept. Modern abstract arrow pointing downward, combining a visual pointer for highlighting information with a business concept of decline, risk and negative trends. Suitable for finance, economy, warning messages, presentations and call to action layouts
Free with trial Modern abstract arrow pointing downward, combining a visual pointer for highlighting information with a business concept of decline, risk and negative trends. Suitable for finance, economy, warning messages, presentations and call to action layouts. Trend decrease illustrations AI generated Arrow Pointing Down, Risk, Decline and Call to Action Business Concept. Modern abstract arrow pointing downward, combining a visual pointer for highlighting information with a business concept of decline, risk and negative trends. Suitable for finance, economy, warning messages, presentations and call to action layouts
Free with trial A 3D rendering depicting a financial chart with a downward arrow, detailed statistics, and digital effects on a white. Trend decrease illustrations A 3D rendering depicting a financial chart with a downward arrow, detailed statistics, and digital effects on a white
Free with trial This image depicts a central golden dollar sign symbolizing financial aspects, flanked by a red downward arrow indicating a decline and a green upward arrow showing growth. Additionally, a pie chart with three segments in different colors suggests analysis or distribution of financial data. Trend decrease illustrations Visual representation of economic fluctuations and financial performance metrics. This image depicts a central golden dollar sign symbolizing financial aspects, flanked by a red downward arrow indicating a decline and a green upward arrow showing growth. Additionally, a pie chart with three segments in different colors suggests analysis or distribution of financial data
Free with trial A black downward trending graph inside a warning triangle on a white background Clear details and vibrant colo. Trend decrease illustrations Black downward trending graph inside a warning triangle on white background chart. A black downward trending graph inside a warning triangle on a white background Clear details and vibrant colo
Free with trial A black downward pointing arrow positioned above a thick horizontal line on white. Trend decrease illustrations Black downward arrow above a horizontal line on white background direction symbol. A black downward pointing arrow positioned above a thick horizontal line on white
Free with trial Black line graph icon with data points showing fluctuations on a white background Clear details and vibrant co. Trend decrease illustrations Black line graph icon showing fluctuating data points on a white background chart. Black line graph icon with data points showing fluctuations on a white background Clear details and vibrant co
Free with trial A black bar graph illustrates margin compression with text on a white background. Clear details and vibrant co. Trend decrease illustrations Black bar graph with MARGINCOMPRESION text on white background margin compression. A black bar graph illustrates margin compression with text on a white background. Clear details and vibrant co
Free with trial Heights showing black bar chart icon with varying heights on white background keywords: bar chart, graph. Trend decrease illustrations Black bar chart icon with varying heights on white background Keywords: bar chart, graph, data. Heights showing black bar chart icon with varying heights on white background keywords: bar chart, graph
Free with trial 3D render of orange crude oil barrels increasing in size, followed by a large blue arrow pointing downward on a white background, symbolizing market decline, price drop, and economic recession. Trend decrease illustrations Crude Oil Barrels Price Fluctuation with Downward Arrow on White for Market Slump. 3D render of orange crude oil barrels increasing in size, followed by a large blue arrow pointing downward on a white background, symbolizing market decline, price drop, and economic recession.
Free with trial 3D render of orange crude oil barrels increasing in size, followed by a large blue arrow pointing downward on a white background, symbolizing market decline, price drop, and economic recession. Trend decrease illustrations Crude Oil Barrels Price Fluctuation with Downward Arrow on White for Market Slump. 3D render of orange crude oil barrels increasing in size, followed by a large blue arrow pointing downward on a white background, symbolizing market decline, price drop, and economic recession.
Free with trial The image depicts a stylized 3D bar chart with alternating red and blue bars representing fluctuations in data trends. The bars ascend and descend, symbolizing periods of growth and decline. The chart has a modern, gradient design with a clear upward trajectory at the end, suggesting recovery or improvement after a period of instability. The visual representation emphasizes the variability and. Trend decrease illustrations Dynamic 3d bar chart illustrating fluctuating growth and decline trends over time. The image depicts a stylized 3D bar chart with alternating red and blue bars representing fluctuations in data trends. The bars ascend and descend, symbolizing periods of growth and decline. The chart has a modern, gradient design with a clear upward trajectory at the end, suggesting recovery or improvement after a period of instability. The visual representation emphasizes the variability and
Free with trial Stacks of golden coins arranged in a descending order on a light background, illustrating concepts of financial loss, economic downturn, and decreasing value. Trend decrease illustrations Decreasing stacks of golden coins symbolizing financial decline and economic loss. Stacks of golden coins arranged in a descending order on a light background, illustrating concepts of financial loss, economic downturn, and decreasing value
Free with trial This image is generated by AI tool. A man in a vibrant blue shirt holds a glowing graph and connected real estate icons, highlighted by a white arrow pointing down. The image implies a market downturn. Trend decrease illustrations Man Cupped Hands Glowingly Present a Tumbling Graph Real Estate Icons in Vibrant Cyan Azure Gold with a Bold. This image is generated by AI tool. A man in a vibrant blue shirt holds a glowing graph and connected real estate icons, highlighted by a white arrow pointing down. The image implies a market downturn.
Free with trial The image depicts three stacks of gold coins progressively decreasing in height, positioned against a background with a downward-sloping red arrow. This visual metaphorically represents a decline in financial savings, investments, or economic losses over time. The contrast between the coins and the arrow emphasizes the concept of reduction or downturn. Trend decrease illustrations Decline in savings or financial losses represented by diminishing stacks of coins. The image depicts three stacks of gold coins progressively decreasing in height, positioned against a background with a downward-sloping red arrow. This visual metaphorically represents a decline in financial savings, investments, or economic losses over time. The contrast between the coins and the arrow emphasizes the concept of reduction or downturn
Free with trial Wooden blocks arranged as declining graph on vibrant red background, business concept. Trend decrease illustrations Wooden blocks arranged as declining graph on vibrant red background, business concept
Free with trial Abstract white block chart representing data or business decline on light background. Trend decrease illustrations Abstract white block chart representing data or business decline on light background
Free with trial This 3D image features a stylized arrow pointing downwards, combined with a dollar sign, set against a transparent background. Ideal for financial or economic themes, this vector graphic can be used in various design projects. The transparent background allows for seamless integration into different design layouts. Trend decrease vectors A 3d arrow pointing downwards with a dollar sign isolated on transparent background. This 3D image features a stylized arrow pointing downwards, combined with a dollar sign, set against a transparent background. Ideal for financial or economic themes, this vector graphic can be used in various design projects. The transparent background allows for seamless integration into different design layouts.
Free with trial This image depicts the concept of declining consumer price index. Stack of coins with a falling red arrow showcase financial loss. Wooden blocks spell CPI. The visual is ideal for illustrating economic downturn, market correction, inflation reduction, budget concerns, finance, recession and investme. Trend decrease illustrations Consumer Price Index Decline: Economic Downturn and Financial Loss Indicated by Coins and Arrow. This image depicts the concept of declining consumer price index. Stack of coins with a falling red arrow showcase financial loss. Wooden blocks spell CPI. The visual is ideal for illustrating economic downturn, market correction, inflation reduction, budget concerns, finance, recession and investme
Free with trial Declining Bar Chart With Downward Arrow Line And Solid Icon Set. Financial Loss, Economic Downturn, And Business Decline Symbol Collection. Risk Assessment. Isolated Vector Illustration. Trend decrease vectors Declining Bar Chart With Downward Arrow Line And Solid Icon Set. Financial Loss, Economic Downturn, And Business Decline
Free with trial Iconic flat style illustration of a declining financial graph overlaid with a dollar coin and a down arrow on black background. Trend decrease vectors Declining Financial Graph Showing Negative Dollar Sign with Falling Arrow Graphic. Iconic flat style illustration of a declining financial graph overlaid with a dollar coin and a down arrow on black background
Free with trial Illustration features worried blocks stacked with a data chart and arrows pointing up and down, in a flat, graphic style. Trend decrease vectors Worried blocks stacked with data chart and arrows depicting volatile market conditions or economic uncertainty. Illustration features worried blocks stacked with a data chart and arrows pointing up and down, in a flat, graphic style.
Free with trial Bid is spelled out with wooden blocks on top of a financial chart with stacks of coins in the background representing investment opportunity financial growth and strategic business planning for futur. Trend decrease illustrations Bid investment finance money growth success strategy market opportunity auction competition offer proposal deal price value econom. Bid is spelled out with wooden blocks on top of a financial chart with stacks of coins in the background representing investment opportunity financial growth and strategic business planning for futur
Free with trial A downward arrow made from smoke represents a decline, while bar graphs show reduced economic performance. Trend decrease illustrations Downward arrow made of smoke symbolizes economic loss in dim setting Generative AI. A downward arrow made from smoke represents a decline, while bar graphs show reduced economic performance
Free with trial A minimalist black line graph with circular data points and vertical bars is depicted on a white background. Trend decrease illustrations Simple black line graph with bars and circles on white background chart statistics. A minimalist black line graph with circular data points and vertical bars is depicted on a white background
Free with trial A black icon illustrating a falling stock market graph with a prominent downward arrow. Trend decrease illustrations Black icon of a falling stock market graph with a downward arrow on a white background. A black icon illustrating a falling stock market graph with a prominent downward arrow
Free with trial This 3D illustration depicts a purple calculator as the central element, set against a clean white background. Various colorful, stylized icons float around it, representing concepts related to business and finance. The icons include a percentage sign, an upward trend graph, a dollar sign, a notification bell, and a message bubble. The composition suggests themes of accounting, financial analysis. Trend decrease illustrations A purple calculator surrounded by business and financial icons in a 3d cartoon style. This 3D illustration depicts a purple calculator as the central element, set against a clean white background. Various colorful, stylized icons float around it, representing concepts related to business and finance. The icons include a percentage sign, an upward trend graph, a dollar sign, a notification bell, and a message bubble. The composition suggests themes of accounting, financial analysis
Free with trial A black circle contains a white abstract arrow pointing downwards. The arrow is formed by sharp geometric lines and angles. Trend decrease vectors Black circle with white abstract arrow pointing down and geometric lines down arrow direction. A black circle contains a white abstract arrow pointing downwards. The arrow is formed by sharp geometric lines and angles
Free with trial The image displays a business analytics dashboard on a laptop screen. It includes key performance indicators such as total revenue of $70,888, with a monthly revenue of $22,869. The dashboard also shows new customers, with a total of 34,999 and a recent month's new customers at 12,089. A pie chart represents sales performance across four categories, with percentages of 35%, 30%, 25%, and 10%. Trend decrease illustrations Business dashboard showing total revenue, sales performance, and new customer trends. The image displays a business analytics dashboard on a laptop screen. It includes key performance indicators such as total revenue of $70,888, with a monthly revenue of $22,869. The dashboard also shows new customers, with a total of 34,999 and a recent month's new customers at 12,089. A pie chart represents sales performance across four categories, with percentages of 35%, 30%, 25%, and 10%.
Free with trial A flat style illustration featuring a decreasing graph alongside a warning symbol, representing decline and potential business issues on a black background. Trend decrease vectors Declining Graph with Warning Icon: Illustration of Failure or Business Downturn. A flat style illustration featuring a decreasing graph alongside a warning symbol, representing decline and potential business issues on a black background.
Free with trial Glass display with a bar chart, analysis of trends, transparent screen with data visualization ,Generative ai. Trend decrease illustrations Glass display bar chart, data visualization, trend analysis, and transparent screen technology. Glass display with a bar chart, analysis of trends, transparent screen with data visualization ,Generative ai
Free with trial Analyzing Data: Person Presenting Graph Showing Progress and Growth Pointing to Top Data Peak, Achievement Concept. Trend decrease illustrations Analyzing Data: Person Presenting Graph Showing Progress and Growth Pointing to Top Data Peak, Achievement Concept
Free with trial Colorful bar chart analysis: growth, trends, and data visualization on a wooden table ,Generative ai. Trend decrease illustrations Colorful bar chart data analysis, visualizing growth trends and performance on a wooden table. Colorful bar chart analysis: growth, trends, and data visualization on a wooden table ,Generative ai
Free with trial The image displays two arrows, one green pointing upwards and another red pointing downwards, symbolizing positive growth and negative decline respectively. The arrows are simple, bold, and positioned side by side for easy comparison. Trend decrease illustrations Contrasting arrows indicating upward growth and downward decline in a visual format. The image displays two arrows, one green pointing upwards and another red pointing downwards, symbolizing positive growth and negative decline respectively. The arrows are simple, bold, and positioned side by side for easy comparison
Free with trial Minimalist 3D concept of glowing red neon line graph plummeting downwards on dark background, financial crash and crisis. Trend decrease illustrations Minimalist 3D concept of glowing red neon line graph plummeting downwards on dark background
Free with trial A downward trending graph chart isolated on a white background representing decline or negative performance. Trend decrease illustrations Downward graph chart isolated on white background. A downward trending graph chart isolated on a white background representing decline or negative performance
Free with trial A 3D bar chart made of red and blue cubes arranged in ascending and descending steps against a white background. Trend decrease illustrations 3D Red and Blue Cubes Arranged in Ascending Bar Chart Formation on White graph data. A 3D bar chart made of red and blue cubes arranged in ascending and descending steps against a white background
Free with trial A man in a dark suit and blue tie points with a glowing pen at a bar graph showing declining profits and increasing costs. Trend decrease illustrations Businessman pointing at declining profits graph with increasing costs chart decline. A man in a dark suit and blue tie points with a glowing pen at a bar graph showing declining profits and increasing costs
Free with trial This 3D rendering shows a bar chart featuring three vertical bars of decreasing height, colored in blue, green-yellow, and yellow. They stand against a black background. Trend decrease vectors Three 3D rendering bar chart elements in decreasing order on transparent background. This 3D rendering shows a bar chart featuring three vertical bars of decreasing height, colored in blue, green-yellow, and yellow. They stand against a black background.
Free with trial 3D illustration showing stacks of golden Bitcoin coins and a red downward arrow, symbolizing cryptocurrency market decline, loss, and financial risk. This concept represents volatility, crypto crash, and falling Bitcoin value. Perfect for use in fintech, blockchain, and economic news visuals. Trend decrease illustrations 3D Bitcoin Coins with Red Downward Arrow Representing Cryptocurrency Market Decline. 3D illustration showing stacks of golden Bitcoin coins and a red downward arrow, symbolizing cryptocurrency market decline, loss, and financial risk. This concept represents volatility, crypto crash, and falling Bitcoin value. Perfect for use in fintech, blockchain, and economic news visuals.
Free with trial This image depicts a modern business strategy centered around increasing profits and decreasing costs A professional works with digital tools like a laptop and tablet illustrating the application of technology in financial planning The upward green arrow symbolizes growing profits while the downward red arrow indicates cost reduction both essential for sustainable business growth and financial. Trend decrease illustrations Analyzing profit increase and cost reduction strategies for business growth success. This image depicts a modern business strategy centered around increasing profits and decreasing costs A professional works with digital tools like a laptop and tablet illustrating the application of technology in financial planning The upward green arrow symbolizes growing profits while the downward red arrow indicates cost reduction both essential for sustainable business growth and financial
Free with trial A vibrant neon bar graph shows financial growth. The data visualization uses blue, green, and purple hues against a dark background. Modern and abstract design. Trend decrease illustrations Neon bar graph data visualization financial growth chart illustration generative ai. A vibrant neon bar graph shows financial growth. The data visualization uses blue, green, and purple hues against a dark background. Modern and abstract design
Free with trial A human hand with visible fingerprints is positioned in the foreground, pressing a glowing blue button labeled "COST" with a white downward arrow symbol. The button emits a bright light, creating a digital and modern aesthetic. The background is blurred, emphasizing the hand and the button as the main suggesting a focus on cost reduction in a business or financial context. Trend decrease illustrations Hand holding a glowing blue cost reduction button with a downward arrow symbol finger. A human hand with visible fingerprints is positioned in the foreground, pressing a glowing blue button labeled "COST" with a white downward arrow symbol. The button emits a bright light, creating a digital and modern aesthetic. The background is blurred, emphasizing the hand and the button as the main suggesting a focus on cost reduction in a business or financial context
Free with trial A digital dashboard displaying financial data and market analytics on a desk with potted plants and greenery accents showcasing a modern technology driven workspace for business economics. Trend decrease illustrations Financial Data Analytics Display with Greenery Accents on Office Desk. A digital dashboard displaying financial data and market analytics on a desk with potted plants and greenery accents showcasing a modern technology driven workspace for business economics
Free with trial Investors and other interested business people react to a stock market drop that turns upward in this stack market arrow chart. This is a 3-d illustration. Trend decrease illustrations Investors and other interested business people react to a stock market drop that turns upward
Free with trial A monochrome illustration depicts a man in a suit sitting at a desk with his head in his hands, appearing stressed. A chart on the desk titled "Monthly Revenue" displays a downward trend in bar graph format. Crumpled papers are scattered on the floor, and a mug rests on the desk. The scene communicates a sense of financial or business-related stress. Trend decrease vectors Stressed Businessman at Desk with Declining Monthly Revenue Chart and Financial Loss. A monochrome illustration depicts a man in a suit sitting at a desk with his head in his hands, appearing stressed. A chart on the desk titled "Monthly Revenue" displays a downward trend in bar graph format. Crumpled papers are scattered on the floor, and a mug rests on the desk. The scene communicates a sense of financial or business-related stress.
Free with trial Crude oil values drop sharply global energy market sees significant price reduction,Generative AI. Trend decrease illustrations Crude oil values drop sharply global energy market sees significant price reduction
Free with trial A blue umbrella shelters a downward-trending red graph with falling red arrows, symbolizing protection against market decline during rainy weather. The image is set against a blurred, out-of-focus background. Trend decrease illustrations Blue Umbrella Sheltering Downward Trending Graph and Falling Arrows in Rain. A blue umbrella shelters a downward-trending red graph with falling red arrows, symbolizing protection against market decline during rainy weather. The image is set against a blurred, out-of-focus background
Free with trial Financial graph with red arrows indicating declining stock prices on a white background. Concept of market downturn and economic crisis. 3D Rendering. Trend decrease illustrations Financial graph showing declining stock prices with red arrows on white background. 3D Rendering. Financial graph with red arrows indicating declining stock prices on a white background. Concept of market downturn and economic crisis. 3D Rendering
Free with trial Close up of businessman hand touching a falling arrow and bar chart. Business Loss and Risk Management. Trend decrease illustrations Close up of businessman hand touching a falling arrow and bar chart. Business Loss and Risk Management.
Free with trial Declining Bar Graph With Cursor Solid Icon. Business Performance, Financial Loss, And Market Downturn Silhouette Symbol. Economic Analysis. Isolated Vector Illustration. Trend decrease vectors Declining Bar Graph With Cursor Solid Icon. Business Performance, Financial Loss, And Market Downturn Silhouette Symbol
Free with trial A downward trending bar graph in shades of blue, illustrating a financial decline with sleek, minimalistic lines and a clear visual impact. Generative AI. Trend decrease vectors Downward trending bar graph in flat design style showcasing financial decline vector illustration. A downward trending bar graph in shades of blue, illustrating a financial decline with sleek, minimalistic lines and a clear visual impact. Generative AI
Free with trial Wooden cubes spelling tariffs with a decreasing stock market graph in the background, representing the negative impact on global trade and economy. Trend decrease illustrations Tariffs increasing with decreasing stock market prices impacting global trade and economy. Wooden cubes spelling tariffs with a decreasing stock market graph in the background, representing the negative impact on global trade and economy
Free with trial The image shows a line graph with yellow data points connected by lines, set against a blue grid background. The graph depicts various peaks and troughs, indicating fluctuations in the data over time. Trend decrease illustrations A dynamic graph illustrating fluctuating data points on a blue grid background. The image shows a line graph with yellow data points connected by lines, set against a blue grid background. The graph depicts various peaks and troughs, indicating fluctuations in the data over time
Free with trial This image depicts a stark, downward-pointing arrow rendered in a dark, almost black silhouette against a vibrant, fiery red backdrop, evoking feelings of loss, failure, or market crash. Trend decrease illustrations Dramatic red descent a sharp decline symbolized by a falling arrow in a fiery background. This image depicts a stark, downward-pointing arrow rendered in a dark, almost black silhouette against a vibrant, fiery red backdrop, evoking feelings of loss, failure, or market crash
Free with trial 3D illustration with a symbol of Euro and golden sand. Trend decrease illustrations 3D illustration Golden Euro Market. 3D illustration with a symbol of Euro and golden sand
Free with trial The image shows three stacks of gold coins with Chinese characters on top of each stack. The first stack has fewer coins and the character meaning 'poor,' the second has more coins with the character meaning 'average,' and the third has the most coins with the character meaning 'rich. ' A large red arrow points downward from the rich stack, indicating a decline in wealth or financial status from. Trend decrease illustrations Illustration depicting the concept of wealth decline or financial downfall in stages. The image shows three stacks of gold coins with Chinese characters on top of each stack. The first stack has fewer coins and the character meaning 'poor,' the second has more coins with the character meaning 'average,' and the third has the most coins with the character meaning 'rich.' A large red arrow points downward from the rich stack, indicating a decline in wealth or financial status from