Free with trial Minimalist black arrow icons pointing up and down on a clean white background, ideal for business, finance, trends, and directional signage in presentations and marketing materials. Trend decrease vectors Bold upward and downward black arrows isolated on white background. Minimalist black arrow icons pointing up and down on a clean white background, ideal for business, finance, trends, and directional signage in presentations and marketing materials
Free with trial Icon financial loss analytics with declining bar chart, down arrow and dollar sign, gear with cross for failed settings, minimal outline symbol for business report. Trend decrease vectors Icon financial loss analytics with declining bar chart, down arrow and dollar sign, gear with cross for failed settings, minimal
Free with trial A stark red rectangular block featuring a clear downward-pointing arrow, conveying a strong sense of reduction or decline. This visual is effective for indicating negative trends, warnings, or decreases in various data visualizations and informative graphics. Simple and impactful, vector design Generative AI. Trend decrease vectors Red Block with Prominent Downward Arrow, vector design Generative AI. A stark red rectangular block featuring a clear downward-pointing arrow, conveying a strong sense of reduction or decline. This visual is effective for indicating negative trends, warnings, or decreases in various data visualizations and informative graphics. Simple and impactful, vector design Generative AI
Free with trial A businessman is shown from an elevated perspective, diligently typing on a laptop. Beside him, a 3D bar graph illustrates a downward trend, accompanied by a prominent green arrow and a COST sign, symbolizing cost reduction and financial efficiency. Trend decrease illustrations Businessman working on laptop with decreasing cost graph and arrow. A businessman is shown from an elevated perspective, diligently typing on a laptop. Beside him, a 3D bar graph illustrates a downward trend, accompanied by a prominent green arrow and a COST sign, symbolizing cost reduction and financial efficiency
Free with trial Icons on a white background depict percentage symbols combined with arrows and bar graphs. The top row includes red, blue, and yellow arrows with percentage symbols. The middle row shows a multicolored bar graph, green percentage symbols, and a black percentage symbol with a black arrow. The bottom row contains a black bar graph, a downward arrow, and a large black percentage symbol. These elements visually represent data trends, growth, and decline. Trend decrease vectors Percentage Growth and Decline Arrow Icon Set Multi Color and Silhouette. Icons on a white background depict percentage symbols combined with arrows and bar graphs. The top row includes red, blue, and yellow arrows with percentage symbols. The middle row shows a multicolored bar graph, green percentage symbols, and a black percentage symbol with a black arrow. The bottom row contains a black bar graph, a downward arrow, and a large black percentage symbol. These elements visually represent data trends, growth, and decline.
Free with trial A blue line drop-down with red bar chart on a white background. Businese concept. Trend decrease vectors A blue line drop-down with red bar chart on white background. Business concept
Free with trial Colorful bar chart visualizing business data, financial growth, and market analysis with a retro aesthetic. Trend decrease illustrations Colorful geometric bar chart displaying data visualization progress. Colorful bar chart visualizing business data, financial growth, and market analysis with a retro aesthetic
Free with trial This image depicts a candlestick chart typically used in financial markets to illustrate the price movements of a cryptocurrency over time. The chart features green and red candles, where green indicates a price increase (bullish) and red indicates a price decrease (bearish). The chart shows a sequence of rising and falling prices, including sharp upward spikes and significant drops, which are. Trend decrease illustrations Cryptocurrency price chart displaying bullish and bearish trends. This image depicts a candlestick chart typically used in financial markets to illustrate the price movements of a cryptocurrency over time. The chart features green and red candles, where green indicates a price increase (bullish) and red indicates a price decrease (bearish). The chart shows a sequence of rising and falling prices, including sharp upward spikes and significant drops, which are
Free with trial A 3D rendering of a small white two-story house with a red roof is displayed on a reflective surface. A red arrow graph is superimposed over the image, trending downward to indicate a decline. Trend decrease illustrations A small white house with a red roof is shown with a downward trending graph. A 3D rendering of a small white two-story house with a red roof is displayed on a reflective surface. A red arrow graph is superimposed over the image, trending downward to indicate a decline
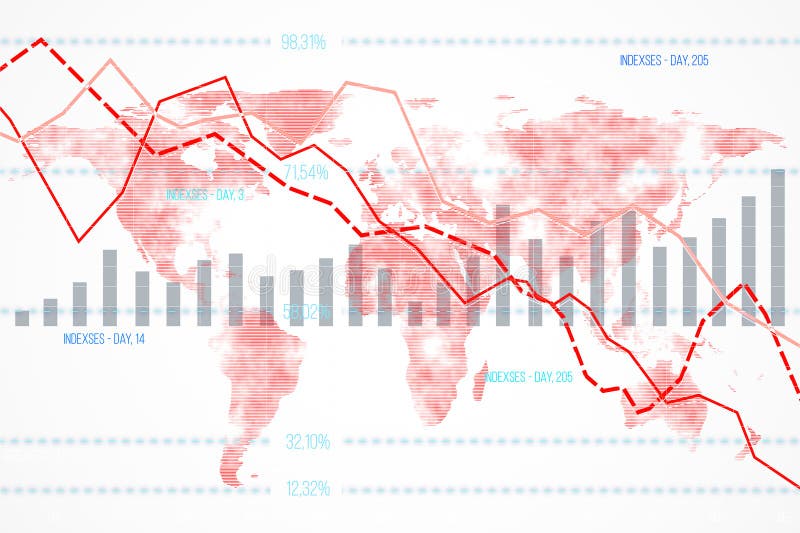
Free with trial Financial data chart featuring declining indexes and bar graphs overlaid on a world map background. Concept of global economic downturn. 3D Rendering. Trend decrease illustrations Financial data chart with declining indexes on a world map background. 3D Rendering. Financial data chart featuring declining indexes and bar graphs overlaid on a world map background. Concept of global economic downturn. 3D Rendering
Free with trial Detailed statistics, a white background, and a downward arrow depicting a stock market crash. 3D rendering. Trend decrease illustrations Detailed statistics, a white background, and a downward arrow depicting a stock market crash. 3D rendering.
Free with trial Hand-drawn graph of business progress, with upward and downward arrows. Trend decrease vectors Hand-drawn graph of business progress, with upward and downward arrows
Free with trial A striking red umbrella stands over blue financial graphs, symbolizing risk management and the protection of money in this 3D illustration. Perfect for finance and business themes. Trend decrease illustrations Red Umbrella Over Financial Graphs Representing Risk Management and Protection of Money in 3D Illustration. A striking red umbrella stands over blue financial graphs, symbolizing risk management and the protection of money in this 3D illustration. Perfect for finance and business themes
Free with trial Collection of various business and financial chart icons in a modern, flat style, set against a dark blue background. Perfect for infographics, presentations, and websites requiring data visualization elements. Trend decrease illustrations Business and Financial Icons Set on Dark Blue Background for Design Elements. Collection of various business and financial chart icons in a modern, flat style, set against a dark blue background. Perfect for infographics, presentations, and websites requiring data visualization elements
Free with trial Stock market data with candlestick chart and declining arrow on a blurred light background. Concept of financial decline. 3D Rendering. Trend decrease illustrations Abstract image of financial stock market data with declining arrow on light background. 3D Rendering. Stock market data with candlestick chart and declining arrow on a blurred light background. Concept of financial decline. 3D Rendering
Free with trial A minimalist bar chart graphic showcasing fluctuating data points. This visual element is perfect for representing financial growth, performance metrics, or statistical analysis in various applications. Trend decrease illustrations Simple bar chart icon representing data growth and analysis trends. A minimalist bar chart graphic showcasing fluctuating data points. This visual element is perfect for representing financial growth, performance metrics, or statistical analysis in various applications
Free with trial A red arrow symbolizing decline rests on a wooden table, capturing the essence of financial downturn and negative trends in business environments and evaluations. Trend decrease illustrations Red Declining Arrow on Wooden Table Representing Financial Downturn. A red arrow symbolizing decline rests on a wooden table, capturing the essence of financial downturn and negative trends in business environments and evaluations
Free with trial A striking red arrow pointing downwards symbolizes a decline in financial performance. Perfect for use in articles on market analysis, investment risks, and business trends. Trend decrease illustrations Red downward arrow representing decline in market or financial loss. A striking red arrow pointing downwards symbolizes a decline in financial performance. Perfect for use in articles on market analysis, investment risks, and business trends
Free with trial A series of colorful bars representing a graph, each with water droplets, illuminated by a spotlight against a dark background with blurred city lights. Trend decrease illustrations Colorful bar graph with water droplets under a spotlight on a dark background with bokeh city lights. A series of colorful bars representing a graph, each with water droplets, illuminated by a spotlight against a dark background with blurred city lights
Free with trial A black magnifying glass is placed over a bar graph on a white background. Clear details and vibrant colors en. Trend decrease illustrations Magnifying Glass Over Bar Graph Icon on White Background chart data. A black magnifying glass is placed over a bar graph on a white background. Clear details and vibrant colors en
Free with trial This compelling 3D illustration visualizes the challenging concept of a bear market, ideal for illustrating economic and financial topics. The image prominently features a bear alongside a significant downward arrow, symbolizing declining stock prices and a potential economic downturn. Representing a bearish sentiment, it highlights the risks inherent in investment and trading. Relevant to finance. Trend decrease illustrations Bear market concept illustration showing a bear with a downward arrow representing declining stock prices and economic downturn. This compelling 3D illustration visualizes the challenging concept of a bear market, ideal for illustrating economic and financial topics. The image prominently features a bear alongside a significant downward arrow, symbolizing declining stock prices and a potential economic downturn. Representing a bearish sentiment, it highlights the risks inherent in investment and trading. Relevant to finance
Free with trial Business finance icons set vector scalable eps collection for stock vector, the image is generated using AI. Trend decrease vectors Business finance icons set vector scalable eps collection for stock vector
Free with trial 3D financial graph, red zigzag, gold coin stacks, blue grid, minimalist. Trend decrease illustrations 3D financial graph, red zigzag, gold coin stacks, blue grid, minimalist
Free with trial A glossy, bright yellow arrow follows a winding, serpentine path downwards, rendered in 3D and isolated against a clean white background for clear visual communication. Trend decrease illustrations Curved yellow arrow pointing downwards isolated on white background. A glossy, bright yellow arrow follows a winding, serpentine path downwards, rendered in 3D and isolated against a clean white background for clear visual communication
Free with trial 3D financial graph, red zigzag, gold coin stacks, blue grid, minimalist. Trend decrease illustrations 3D financial graph, red zigzag, gold coin stacks, blue grid, minimalist
Free with trial This dramatic graph illustrates a sharp decline, set against a stormy and ominous background with lightning. It evokes feelings of crisis and economic downturn, perfect for conveying risk and uncertainty in business or finance contexts created AI. Trend decrease illustrations Dramatic graph showing sharp decline with ominous stormy background. This dramatic graph illustrates a sharp decline, set against a stormy and ominous background with lightning. It evokes feelings of crisis and economic downturn, perfect for conveying risk and uncertainty in business or finance contexts created AI
Free with trial This image displays a sleek, modern icon featuring a blue percentage symbol (%) centered within a hexagonal shape. The design has a glossy, three-dimensional effect with subtle highlights and shadows, giving it a polished and professional appearance suitable for use in business, finance, or data-related contexts. Trend decrease illustrations Stylized blue percentage symbol icon with a modern geometric design. This image displays a sleek, modern icon featuring a blue percentage symbol (%) centered within a hexagonal shape. The design has a glossy, three-dimensional effect with subtle highlights and shadows, giving it a polished and professional appearance suitable for use in business, finance, or data-related contexts
Free with trial A red downward-pointing arrow sits atop a blue bar graph labeled GDP, with white financial data and numbers below on a dark background with a gradient light effect. red, down, arrow. Trend decrease illustrations Red down arrow on blue bar graph with g d p text and financial data. A red downward-pointing arrow sits atop a blue bar graph labeled GDP, with white financial data and numbers below on a dark background with a gradient light effect. red, down, arrow
Free with trial Three green downward-pointing arrows are stacked vertically. Each arrow is bold with a glossy appearance, creating a 3D effect. The setting is simple, using white space to emphasize the green color and shape of the arrows. Trend decrease vectors Three stacked green arrows pointing downwards on a black background. Three green downward-pointing arrows are stacked vertically. Each arrow is bold with a glossy appearance, creating a 3D effect. The setting is simple, using white space to emphasize the green color and shape of the arrows.
Free with trial 3D financial graph, red zigzag, gold coin stacks, blue grid, minimalist. Trend decrease illustrations 3D financial graph, red zigzag, gold coin stacks, blue grid, minimalist
Free with trial The image features a three-dimensional, vibrant green percentage symbol prominently displayed against a clean, white backdrop. The symbol has a sleek, glossy finish with a slight shadow effect, giving it a dynamic and eye-catching appearance. Trend decrease illustrations A bold and modern green percentage symbol on a plain white background. The image features a three-dimensional, vibrant green percentage symbol prominently displayed against a clean, white backdrop. The symbol has a sleek, glossy finish with a slight shadow effect, giving it a dynamic and eye-catching appearance
Free with trial A conceptual portrayal of economic decline, featuring a man walking near stacked coins and a tank. The downward trend signifies market struggles and financial crisis. Trend decrease illustrations Economic Decline Illustration with Man and Tank Representing Crisis. A conceptual portrayal of economic decline, featuring a man walking near stacked coins and a tank. The downward trend signifies market struggles and financial crisis
Free with trial A flat style vector illustration showcasing a laptop displaying a colorful bar chart and a downward trending arrow indicating financial decline or loss. Trend decrease illustrations Laptop Screen Displaying Colorful Bar Chart and Downward Trending Arrow Symbolizing Financial Loss. A flat style vector illustration showcasing a laptop displaying a colorful bar chart and a downward trending arrow indicating financial decline or loss.
Free with trial Euro sign with arrow down sign, 3d rendering. Trend decrease illustrations Euro sign with arrow down sign
Free with trial The image features a collection of colorful chart icons, including bar graphs, line graphs, and pie charts, symbolizing data analysis, business growth, and financial performance. Trend decrease illustrations Colorful chart icons representing data analysis and business growth. The image features a collection of colorful chart icons, including bar graphs, line graphs, and pie charts, symbolizing data analysis, business growth, and financial performance
Free with trial A professional studio shot features a collection of high-end gold jewelry, including rings, necklaces, and watches, arranged on a dark reflective surface. A prominent, 3D-style red downward arrow is positioned beside the jewelry, cutting through the composition. The image serves as a dramatic visual metaphor for the rapid decline in luxury asset value, a bear market in the jewelry industry,. Trend decrease illustrations Luxury Gold Jewelry with Downward Red Arrow Symbolizing Market Value Decline. A professional studio shot features a collection of high-end gold jewelry, including rings, necklaces, and watches, arranged on a dark reflective surface. A prominent, 3D-style red downward arrow is positioned beside the jewelry, cutting through the composition. The image serves as a dramatic visual metaphor for the rapid decline in luxury asset value, a bear market in the jewelry industry,
Free with trial Falling Bar Graph with Downward Arrow Indicating Decline or Recession. Trend decrease vectors Falling Bar Graph with Downward Arrow Indicating Decline or Recession
Free with trial A blue umbrella shelters from a downpour of red downward-pointing arrows forming a descending line graph, set against a stormy sky and dark water. The image depicts protection from economic decline. Trend decrease illustrations Blue Umbrella Protecting from Red Downward Arrows and Graph. A blue umbrella shelters from a downpour of red downward-pointing arrows forming a descending line graph, set against a stormy sky and dark water. The image depicts protection from economic decline
Free with trial A series of wooden human figures of decreasing size, arranged in a line, with a red arrow trending downwards above them, symbolizing a decline or reduction. Trend decrease illustrations Decline in population represented by wooden figures decreasing in size. A series of wooden human figures of decreasing size, arranged in a line, with a red arrow trending downwards above them, symbolizing a decline or reduction
Free with trial Miniature wooden house with a prominent red downward arrow amidst a group of similar houses. Generative AI. Trend decrease illustrations Miniature wooden house with a prominent red downward arrow amidst a group of similar houses
Free with trial Bankruptcy, financial market crash, Red arrow going down stock icon on white background. suitable for web site design, logo, app, UI. graph chart down trend symbol. chart going down sign. Trend decrease vectors Bankruptcy, financial market crash, Red arrow going down stock icon on white background. suitable for web site design, logo, app
Free with trial A stark downward trending graph against a white backdrop signifies economic downturn, financial losses, and negative market performance. It represents a period of decline. Trend decrease vectors Vector art of downward trending graph, depicting economic decline, financial loss, market downturn, and negative performance. A stark downward trending graph against a white backdrop signifies economic downturn, financial losses, and negative market performance. It represents a period of decline
Free with trial A magnifying glass highlights a "Buy" signal amidst a declining stock market graph. Trend decrease illustrations Buy Opportunity Stock Market Downturn Analysis with Magnifying Glass. A magnifying glass highlights a "Buy" signal amidst a declining stock market graph.
Free with trial A white background hosts two prominent 3D rendered thermometers, one red for "HOT" and one blue for "COLD," displaying contrasting temperature levels. Various weather are scattered around them, including suns, clouds with rain, and a snowflake. To the left, red up and down arrows signify rising and falling trends, while to the right, a bar graph with red and blue bars data or statistics,. Trend decrease illustrations Hot and cold thermometers with weather and up down arrows. A white background hosts two prominent 3D rendered thermometers, one red for "HOT" and one blue for "COLD," displaying contrasting temperature levels. Various weather are scattered around them, including suns, clouds with rain, and a snowflake. To the left, red up and down arrows signify rising and falling trends, while to the right, a bar graph with red and blue bars data or statistics,
Free with trial An image depicting a red arrow pointing downwards above a stack of gold coins that decreases in size, symbolizing financial decline or loss. Trend decrease illustrations A descending red arrow above a diminishing stack of gold coins. An image depicting a red arrow pointing downwards above a stack of gold coins that decreases in size, symbolizing financial decline or loss
Free with trial Visualizing cost reduction with a declining graph held in a hand, symbolizing strategic expense management and improved profitability for business growth and financial success. A key concept. Trend decrease illustrations Cost reduction strategies: how to lower expenses and improve profitability for your business growth. visualizing cost reduction with a declining graph held in a hand, symbolizing strategic expense management and improved profitability for business growth and financial success. A key concept.
Free with trial A visually appealing bar chart composed of colorful blocks arranged to represent fluctuating data and growth patterns. Trend decrease illustrations Colorful bar graph showing upward and downward trends on a clean white surface. A visually appealing bar chart composed of colorful blocks arranged to represent fluctuating data and growth patterns
Free with trial A hand places a block on a decreasing bar graph, symbolizing cost reduction, with a magnifying glass highlighting the word COST. Trend decrease illustrations Cost Reduction Strategy Illustrated with Blocks and Magnifying Glass. A hand places a block on a decreasing bar graph, symbolizing cost reduction, with a magnifying glass highlighting the word COST
Free with trial A large green upward arrow stands tall, surrounded by multiple red downward arrows, symbolizing contrasting trends of growth and decline. Trend decrease illustrations Green up arrow dominates red down arrows showing growth and decline. A large green upward arrow stands tall, surrounded by multiple red downward arrows, symbolizing contrasting trends of growth and decline
Free with trial Downward trending chart with open scissors superimposed negative scissors cutting graph cutting Vector illustration for high-quality printing. Trend decrease illustrations Downward trending chart with open scissors superimposed, negative, scissors cutting graph, cutting. Downward trending chart with open scissors superimposed negative scissors cutting graph cutting Vector illustration for high-quality printing
Free with trial Abstract red chart illustrating data trends and fluctuations in finance. This graphic represents market analysis, ideal for professional reports and presentations. Trend decrease vectors Red Chart Illustration Showing Data Trends and Variations in Finance. Abstract red chart illustrating data trends and fluctuations in finance. This graphic represents market analysis, ideal for professional reports and presentations
Free with trial Solid red arrow symbol oriented downwards on white surface. Simple graphic design element for navigation instructions and digital interface indicators. Trend decrease illustrations Red arrow pointing down direction icon isolated on white background. Solid red arrow symbol oriented downwards on white surface. Simple graphic design element for navigation instructions and digital interface indicators
Free with trial Four 3D bar graphs with arrows indicating upward and downward trends on white. Clear details and vibrant colors enhance visual. Trend decrease illustrations Four 3D Bar Graphs Showing Upward and Downward Trends with Arrows on White Keywords: bar graph, chart, data, statistics, analysis. Four 3D bar graphs with arrows indicating upward and downward trends on white. Clear details and vibrant colors enhance visual
Free with trial This image illustrates a financial downturn using a descending stock chart superimposed on a tall skyscraper, symbolizing economic decline. Trend decrease illustrations Financial downturn depicted by descending stock chart on skyscraper. This image illustrates a financial downturn using a descending stock chart superimposed on a tall skyscraper, symbolizing economic decline
Free with trial A black and white conceptual illustration features two interlocking gears labeled Legislation and Sentencing Parole, mechanically connected by a solid rod that holds them in precise alignment above a rising bar graph that visually represents the decreasing correlation between legislative changes and parole sentencing outcomes, creating a powerful metaphor for criminal justice reform, policy. Trend decrease illustrations Black and white conceptual illustration of legislation and sentencing parole gears connected by rod with increasing bar graph. A black and white conceptual illustration features two interlocking gears labeled Legislation and Sentencing Parole, mechanically connected by a solid rod that holds them in precise alignment above a rising bar graph that visually represents the decreasing correlation between legislative changes and parole sentencing outcomes, creating a powerful metaphor for criminal justice reform, policy
Free with trial An open textbook displays a vertical bar graph composed of six brightly colored orange, yellow, and red bars arranged from highest to lowest, symbolizing data analysis, statistical growth, and performance metrics, set against a plain beige background with scattered white dots that add a dynamic and energetic feel, creating a vibrant visual metaphor for progress, research, and educational. Trend decrease illustrations Open book with colorful bar graph on top showing data analysis, statistics, and growth metrics in vibrant orange, yellow, and red. An open textbook displays a vertical bar graph composed of six brightly colored orange, yellow, and red bars arranged from highest to lowest, symbolizing data analysis, statistical growth, and performance metrics, set against a plain beige background with scattered white dots that add a dynamic and energetic feel, creating a vibrant visual metaphor for progress, research, and educational
Free with trial Colorful bar graph chart depicted with crayons. Set against a rustic wooden background, implying decline or financial loss. Perfect for business, economics, and data visualization concepts. Trend decrease illustrations Falling Bar Graph with Crayons Good Resolution Stock Photo. Colorful bar graph chart depicted with crayons. Set against a rustic wooden background, implying decline or financial loss. Perfect for business, economics, and data visualization concepts.
Free with trial A visually striking bar graph illustration depicting both upward and downward trends, set against a clean white background, representing market dynamics and data analysis. Trend decrease vectors Vector art of a dynamic bar graph illustration showcasing both upward and downward trends, , symbolizing market fluctuations and. A visually striking bar graph illustration depicting both upward and downward trends, set against a clean white background, representing market dynamics and data analysis
Free with trial A black jagged arrow points downwards, indicating a sharp decline on a white background. Trend decrease illustrations Black jagged arrow pointing down on a white background sharp decline. A black jagged arrow points downwards, indicating a sharp decline on a white background
Free with trial A businessman in a suit is drawing a downward sloping graph illustrating the decline of profits against the rise of costs the image represents financial challenges business downturns and the need for cost reduction strategies for improved profitability. Trend decrease illustrations Business person drawing a graph representing financial decline and reduced profits due to cost. A businessman in a suit is drawing a downward sloping graph illustrating the decline of profits against the rise of costs the image represents financial challenges business downturns and the need for cost reduction strategies for improved profitability
Free with trial Clean and simple downward-pointing arrow icon, ideal for web design, user interfaces, infographics, and directional signage in digital and print media. Trend decrease vectors Minimalist black arrow pointing down on white background vector icon. Clean and simple downward-pointing arrow icon, ideal for web design, user interfaces, infographics, and directional signage in digital and print media
Free with trial Minimalist black shopping cart icon with downward arrow symbolizing sales decline, discount, or e-commerce downturn. Ideal for business, marketing, and financial presentations. Trend decrease illustrations Downward arrow on empty shopping cart icon isolated on white background. Minimalist black shopping cart icon with downward arrow symbolizing sales decline, discount, or e-commerce downturn. Ideal for business, marketing, and financial presentations
Free with trial A 3d rendering of a bar graph with green bars and a red downward-pointing arrow, illustrating a decline or negative. Trend decrease illustrations 3d bar graph with downward arrow showing decline on white background. A 3d rendering of a bar graph with green bars and a red downward-pointing arrow. A 3d rendering of a bar graph with green bars and a red downward-pointing arrow, illustrating a decline or negative
Free with trial This is a 3D render of a descending bar graph. The bars are blue, purple, yellow, and orange on a transparent background. Trend decrease vectors Colorful descending bar graph illustration on transparent background. This is a 3D render of a descending bar graph. The bars are blue, purple, yellow, and orange on a transparent background.
Free with trial The image depicts a 3D bar chart with bars in varying heights. The bars are colored in shades of green and blue, with the green bars being shorter and the blue bars being taller. The chart is set against a plain white background, which highlights the colors of the bars. Trend decrease illustrations Colorful 3d bar chart with green and blue bars on a white background. The image depicts a 3D bar chart with bars in varying heights. The bars are colored in shades of green and blue, with the green bars being shorter and the blue bars being taller. The chart is set against a plain white background, which highlights the colors of the bars
Free with trial A businessman in a suit gestures towards a yellow upward-curving arrow representing success and growth, while several blue arrows point downwards in the background, symbolizing overcoming market decline and achieving positive results. Trend decrease illustrations Businessman Pointing at Rising Yellow Arrow and Falling Blue Arrows. A businessman in a suit gestures towards a yellow upward-curving arrow representing success and growth, while several blue arrows point downwards in the background, symbolizing overcoming market decline and achieving positive results
Free with trial Three prominent red arrows point downwards, each displaying a white percentage symbol. This imagery powerfully represents declining prices, sales, and financial reduction, ideal for marketing and economic contexts. Trend decrease illustrations Three red downward arrows with percentage symbols symbolizing falling prices and discounts isolated on white background. Three prominent red arrows point downwards, each displaying a white percentage symbol. This imagery powerfully represents declining prices, sales, and financial reduction, ideal for marketing and economic contexts
Free with trial A group of people standing around a large red arrow pointing downwards created AI. Trend decrease illustrations A group of people standing around a large red arrow pointing downwards
Free with trial A businessman in a suit uses a magnifying glass to show cost reduction with graphs and financial data visuals. Trend decrease illustrations Businessman demonstrating cost reduction with data and graphs for financial analysis purpose image. A businessman in a suit uses a magnifying glass to show cost reduction with graphs and financial data visuals.
Free with trial This 3D image features a mountain with upward and downward arrows, symbolizing growth and decline, set against a transparent background. Perfect for presentations, infographics, and web design projects, this vector illustration is versatile and visually appealing. Trend decrease vectors 3d mountain with up and down arrows symbol on transparent background. This 3D image features a mountain with upward and downward arrows, symbolizing growth and decline, set against a transparent background. Perfect for presentations, infographics, and web design projects, this vector illustration is versatile and visually appealing.
Free with trial The image shows two double-headed arrows placed side by side on a plain background. The arrow on the left is red and points both upward and downward, while the arrow on the right is green and also points both upward and downward. The arrows are identical in design but differ in color, suggesting opposing or contrasting directions or states, often used in financial or directional contexts. Trend decrease illustrations Contrasting upward and downward arrows in red and green colors side by side. The image shows two double-headed arrows placed side by side on a plain background. The arrow on the left is red and points both upward and downward, while the arrow on the right is green and also points both upward and downward. The arrows are identical in design but differ in color, suggesting opposing or contrasting directions or states, often used in financial or directional contexts
Free with trial Reduction chart icon set in thin line outline style and linear vector sign. Trend decrease vectors Reduction chart icon Thin line art isolated. Reduction chart icon set in thin line outline style and linear vector sign
Free with trial 3D sticker of a red downturn arrow, designed with a transparent background. Trend decrease illustrations 3D sticker of a red downturn arrow, designed with a transparent background.
Free with trial An open notebook displays two pages of business data visualization with a vertical bar graph on the left page featuring green, red, and blue bars alongside a central pie chart divided into red, blue, and green segments showing 70% in red with upward and downward arrows indicating percentage changes, all set against a clean white background ideal for concepts of analytics, financial reporting,. Trend decrease illustrations Business data analysis shown in an open notebook with colorful bar graph and pie chart illustrating statistics and percentages. An open notebook displays two pages of business data visualization with a vertical bar graph on the left page featuring green, red, and blue bars alongside a central pie chart divided into red, blue, and green segments showing 70% in red with upward and downward arrows indicating percentage changes, all set against a clean white background ideal for concepts of analytics, financial reporting,
Free with trial Red arrow chart is rapidly declining, representing a financial crisis. Trend decrease vectors Red arrow chart showing economic crisis and recession. Red arrow chart is rapidly declining, representing a financial crisis
Free with trial Blue pencil drawing a downward trending graph with yellow nodes on a dark gray background, illustrating financial decline or strategy planning. Trend decrease illustrations Blue pencil drawing a downward trending graph with yellow nodes on a dark gray background, illustrating financial decline or
Free with trial The image depicts a city map overlaid with stock market trend lines, illustrating various financial movements. Different colored lines represent upward and downward trends with percentage changes, indicating stock performance or indices across different regions. The visual juxtaposition of financial data against a geographical layout highlights how market movements correlate with specific. Trend decrease illustrations Stock market trends and performance analysis on a city map background. The image depicts a city map overlaid with stock market trend lines, illustrating various financial movements. Different colored lines represent upward and downward trends with percentage changes, indicating stock performance or indices across different regions. The visual juxtaposition of financial data against a geographical layout highlights how market movements correlate with specific
Free with trial A set of twelve diverse and versatile vector icons depicting various types of charts commonly used in business and data analysis. These include line graphs showing upward and fluctuating trends, bar charts illustrating data comparisons, and pie charts representing proportions. Ideal for presentations, reports, websites, and infographics related to finance, marketing, and statistics. Trend decrease vectors Collection of Line and Bar Charts & Pie Charts - Business Data Visualization Icons. A set of twelve diverse and versatile vector icons depicting various types of charts commonly used in business and data analysis. These include line graphs showing upward and fluctuating trends, bar charts illustrating data comparisons, and pie charts representing proportions. Ideal for presentations, reports, websites, and infographics related to finance, marketing, and statistics.
Free with trial The image shows five wooden figures arranged in a row, decreasing in size from left to right. A red arrow points downwards from the largest figure on the left to the smallest figure on the right. The background is a solid blue color. Trend decrease illustrations Wooden figures decreasing in size with a red arrow pointing downwards. The image shows five wooden figures arranged in a row, decreasing in size from left to right. A red arrow points downwards from the largest figure on the left to the smallest figure on the right. The background is a solid blue color
Free with trial This image depicts a warning sign with an exclamation mark, indicating a potential financial risk or market downturn. The yellow triangle with a black outline and a downward-trending graph in the background suggests a sense of caution and alertness. This image can be used to represent financial warning signs, market volatility, or economic recession in a business or commercial context. Trend decrease vectors A warning sign indicating a potential financial risk or market downturn. This image depicts a warning sign with an exclamation mark, indicating a potential financial risk or market downturn. The yellow triangle with a black outline and a downward-trending graph in the background suggests a sense of caution and alertness. This image can be used to represent financial warning signs, market volatility, or economic recession in a business or commercial context.