Free with trial Bold red arrow points downward on clean white background. Simple 3D graphic suggests decline or direction. Useful for business, web or design concepts. Trend decrease illustrations Bold red arrow points downward on clean white background. Simple 3D graphic suggests decline or direction. Useful for business
Free with trial Concept Financial Decline, Red Candlestick Graph, Stock Market, Economic Downturn, Financial Crisis Decline in financial status illustrated by red candlestick background in stock market graph. Trend decrease illustrations Decline in financial status illustrated by red candlestick background in stock market graph. Concept Financial Decline, Red Candlestick Graph, Stock Market, Economic Downturn, Financial Crisis Decline in financial status illustrated by red candlestick background in stock market graph
Free with trial Golden bear statue on wall street in financial district - bear market recession concept. Generative AI. Trend decrease illustrations Golden bear statue on wall street in financial district - bear market recession concept
Free with trial This image features an intricate bar graph displaying colorful statistical data trends, perfect for business reports and presentations. Analyze metrics effectively. Trend decrease illustrations Colorful Data Visualization with Bar Graphs and Trends Displaying Statistical Information on a White Background. This image features an intricate bar graph displaying colorful statistical data trends, perfect for business reports and presentations. Analyze metrics effectively
Free with trial Colorful business graph illustrating a decline in data, featuring a bold red arrow pointing downward. Ideal for enhancing presentations and finance reports with clear visual analysis. Trend decrease vectors Colorful business graph illustrating a decline in data, featuring a bold red arrow pointing downward. Ideal for
Free with trial A real estate market drop red arrow housing downturn wooden house property price decline concept mortgage crisis symbol investment risk negative, Generative AI. Trend decrease illustrations Real estate market drop red arrow housing downturn wooden house property price decline concept mortgage crisis symbol investment
Free with trial Blue stacked arrows illustrate financial growth, market trends. Graphic displays upward, downward movement, signifying progress, decline in business economy. Represents strategy,. Trend decrease illustrations Blue stacked arrows illustrate financial growth, market trends. Graphic displays upward, downward movement, signifying progress
Free with trial Colorful wooden blocks arranged curve symbolize global economy slowdown and economic crisis impacting finance, business, market, inflation. Generative AI. Trend decrease illustrations Colorful wooden blocks arranged curve symbolize global economy slowdown and economic crisis impacting finance business market. Colorful wooden blocks arranged curve symbolize global economy slowdown and economic crisis impacting finance, business, market, inflation. Generative AI
Free with trial A colorful bar chart overlays blueprint showcasing data visualization for business analysis colorful on top of blueprinted paper ,Generative ai. Trend decrease illustrations A vibrant and informative colorful bar chart displayed on top of detailed blueprinted paper for comprehensive data analysis. A colorful bar chart overlays blueprint showcasing data visualization for business analysis colorful on top of blueprinted paper ,Generative ai
Free with trial This image displays financial performance indicators, highlighting data trends and market volatility. It represents economic analysis and strategic decision-making processes. Trend decrease vectors Vector art of financial performance indicators, showcasing data trends, market volatility, and economic analysis for strategic. This image displays financial performance indicators, highlighting data trends and market volatility. It represents economic analysis and strategic decision-making processes
Free with trial Global financial market chart with downward arrows candlestick data and world map background representing stock decline economic crisis trading volatility and investment risk analysis. Trend decrease illustrations AI generated global financial market chart with downward arrows candlestick data and world map background representing stock. global financial market chart with downward arrows candlestick data and world map background representing stock decline economic crisis trading volatility and investment risk analysis
Free with trial Hand-Drawn Red Arrow Pointing Down: A simple, universally understood icon symbolizing decline, reduction, and downward movement on a clean white background. Trend decrease illustrations Hand-Drawn Red Arrow Pointing Down: A simple, universally understood icon symbolizing decline, reduction, and downward movement on
Free with trial Red arrow plunging over gold coins, symbolizing financial downturn, market crash, economic recession, stock losses, and decreased profits. Ideal for business, finance reports, this image is generated using AI. Trend decrease vectors Red arrow plunging over gold coins, symbolizing financial downturn, market crash, economic recession, stock losses, and decreased
Free with trial Discount percentage arrow icon representing price reductions, financial market decline, interest rate drops, economic recession, and sales promotions, isolated on white & transparent background, this image is generated using AI. Trend decrease vectors Discount percentage arrow icon representing price reductions, financial market decline, interest rate drops, economic recession
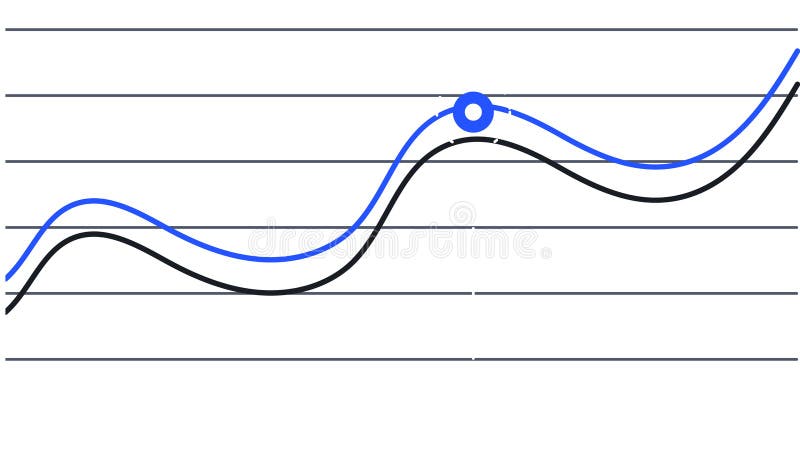
Free with trial Two lines are representing data progression over time, one blue and one black, creating a visual representation of trends and a key intersection point is marked with a blue circle. Trend decrease illustrations Two lines are representing data progression over time, one blue and one black, creating a visual representation of
Free with trial Two lines are representing data progression over time, one blue and one black, creating a visual representation of trends and a key intersection point is marked with a blue circle. Trend decrease vectors Two lines are representing data progression over time, one blue and one black, creating a visual representation of
Free with trial An abstract image depicting stylized blue mountains and orange data points suggesting growth or a dynamic process. Trend decrease illustrations Abstract Blue Mountainscape With Orange Data Points. An abstract image depicting stylized blue mountains and orange data points suggesting growth or a dynamic process
Free with trial Blue calculator and gold coins near downward trending blue graph. Financial loss and budget, calculation concept. Business analytics data. Economic recession illustration. Digital accounting. Trend decrease illustrations Blue calculator and gold coins near downward trending blue graph. Financial loss and budget calculation concept. Business. Blue calculator and gold coins near downward trending blue graph. Financial loss and budget, calculation concept. Business analytics data. Economic recession illustration. Digital accounting
Free with trial Red glossy 3D arrow with percentage symbol pointing down, representing price drops, sales, discount offers, interest rate cuts, or economic recession. Ideal for financial news, marketing campaigns, this image is generated using AI. Trend decrease vectors Red glossy 3D arrow with percentage symbol pointing down, representing price drops, sales, discount offers, interest rate cuts, or
Free with trial Financial market downturn stock chart arrows falling business decline. Trend decrease illustrations Visual representation of financial market decline with falling stock charts and downward arrows signifying economic recession. Financial market downturn stock chart arrows falling business decline
Free with trial Watercolor illustration shows baby bottle with declining birth rate chart. Concept art about falling population decreasing birth rate statistic. Fewer babies. Modern concept of modern. Trend decrease illustrations Watercolor illustration shows baby bottle with declining birth rate chart. Concept art about falling population decreasing birth
Free with trial Two lines are representing increasing and declining trends over a grid background, symbolizing market analysis, financial performance, or business progress. Trend decrease illustrations Two lines are representing increasing and declining trends over a grid background, symbolizing market analysis
Free with trial Financial downturn depicted by PDG text on wooden blocks, decreasing coin stacks, and red arrow showing decline, economic recession, and investment loss. Trend decrease illustrations PDG text on wooden blocks with declining stack of coins and red arrow indicating decrease representing financial downturn. Financial downturn depicted by PDG text on wooden blocks, decreasing coin stacks, and red arrow showing decline, economic recession, and investment loss
Free with trial Sharp retail sales decline graph with a shopping cart, isolated on white & transparent background. Ideal for illustrating economic recession, consumer spending drops, business losses, this image is generated using AI. Trend decrease vectors Sharp retail sales decline graph with a shopping cart, isolated on white & transparent background. Ideal for illustrating economic
Free with trial A line of quaint wooden homes stands beneath a bold red arrow pointing downward, illustrating a drop in property values amid a muted, out-of-focus gray backdrop. Trend decrease illustrations Row of small wooden houses with a prominent red downward arrow symbolizing decline in housing market or property values against a. A line of quaint wooden homes stands beneath a bold red arrow pointing downward, illustrating a drop in property values amid a muted, out-of-focus gray backdrop
Free with trial Line drawing of a flipchart showing a graph with a downward arrow representing economic downturn. Trend decrease vectors Flipchart showing arrow graph going down representing financial crisis. Line drawing of a flipchart showing a graph with a downward arrow representing economic downturn
Free with trial Red arrow pointing down with stacks of gold coins. Represents financial market decline, economic recession, and investment loss. Business downturn and decreasing profits. Trend decrease illustrations Red arrow pointing down with stacks of gold coins financial market decline recession. Red arrow pointing down with stacks of gold coins. Represents financial market decline, economic recession, and investment loss. Business downturn and decreasing profits
Free with trial Futuristic digital red arrow moving downward showing stock market crash, technology financial loss, and economic recession concept. Generative AI. Trend decrease illustrations Futuristic digital red arrow moving downward showing stock market crash technology financial loss and economic recession concept
Free with trial Seamless pattern featuring colorful financial arrows pointing up and down representing market trends isolated on a bright white. Generative AI Illustration. Trend decrease illustrations Seamless pattern featuring colorful financial arrows pointing up and down representing market trends isolated on a bright white
Free with trial Seamless pattern featuring colorful financial arrows pointing up and down representing market trends isolated on a bright white. Generative AI Illustration. Trend decrease illustrations Seamless pattern featuring colorful financial arrows pointing up and down representing market trends isolated on a bright white
Free with trial Seamless pattern featuring colorful financial arrows pointing up and down representing market trends isolated on a bright white. Generative AI Illustrations. Trend decrease illustrations Seamless pattern featuring colorful financial arrows pointing up and down representing market trends isolated on a bright white
Free with trial Seamless pattern featuring colorful financial arrows pointing up and down representing market trends isolated on a bright white. Generative AI Illustration. Trend decrease illustrations Seamless pattern featuring colorful financial arrows pointing up and down representing market trends isolated on a bright white
Free with trial A businessman presents a glowing holographic bar and line graph displaying a peak followed by a sharp financial downturn and market decline. This visual represents economic challenges and risk. Trend decrease illustrations Business professional holding a glowing financial chart showing a significant market downturn and economic decline in performance. A businessman presents a glowing holographic bar and line graph displaying a peak followed by a sharp financial downturn and market decline. This visual represents economic challenges and risk.
Free with trial Minimalistic animated red bar chart visualizing steady decline and downward performance. Represents business losses, market downturn, economic slowdown, financial risk, crisis scenarios, and negative growth in a modern digital style. Trend decrease illustrations Declining Business Chart Showing Negative Market Trend. Minimalistic animated red bar chart visualizing steady decline and downward performance. Represents business losses, market downturn, economic slowdown, financial risk, crisis scenarios, and negative growth in a modern digital style.
Free with trial Gross domestic product GDP analysis with magnifying glass on red chart showing decline and gold coins in jar. Financial downturn and investment loss indicated. Trend decrease illustrations Gross domestic product GDP analysis with magnifying glass on red chart indicating decline and gold coins in jar on wooden table. Gross domestic product GDP analysis with magnifying glass on red chart showing decline and gold coins in jar. Financial downturn and investment loss indicated
Free with trial Decline Curve A Visual Representation of Increasing Trends Curving Downward and Overcoming Previous Bars Against a Dark Blue Background by SD. Trend decrease illustrations Decline Curve A Visual Representation of Increasing Trends Curving Downward and Overcoming Previous Bars Against a Dark Blue Backg
Free with trial A jar filled with stacked coins, symbolizing savings and financial growth in a modern, blurred background, Generative AI. Trend decrease illustrations A jar filled with stacked coins, symbolizing savings and financial growth in a modern, blurred background
Free with trial This illustration features two colorful bar graphs on a white background, showcasing data comparison with distinct color palettes for engaging visual analysis and presentations. Trend decrease illustrations Colorful Bar Graphs on White Background Representing Data Comparison and Growth with Different Color Schemes for Visual Analysis. This illustration features two colorful bar graphs on a white background, showcasing data comparison with distinct color palettes for engaging visual analysis and presentations
Free with trial Striking AI-generated visualization of a sharp financial crisis. This 3D render, featuring a bar chart and a glowing downward arrow, clearly communicates economic distress and market volatility, providing essential data imagery for investors and businesses tracking performance decline. Trend decrease illustrations Conceptual 3D bar chart illustrating drastic market collapse and financial loss with a glowing downward arrow on a neutral backgro. Striking AI-generated visualization of a sharp financial crisis. This 3D render, featuring a bar chart and a glowing downward arrow, clearly communicates economic distress and market volatility, providing essential data imagery for investors and businesses tracking performance decline.
Free with trial 3d isometric illustration of a brown paper shopping bag with a downward red arrow, symbolizing negative sales growth. Trend decrease vectors Isometric brown shopping bag with negative growth arrow. 3d isometric illustration of a brown paper shopping bag with a downward red arrow, symbolizing negative sales growth
Free with trial Red Downward Arrow Showing Global Stock Market Crash and Economic Recession with Falling Percentages Representing Tariff Effects and Financial Crisis 3d rendering. Trend decrease illustrations Red Downward Arrow Showing Global Stock Market Crash and Economic Recession with Falling Percentages Representing Tariff Effects
Free with trial This illustration portrays money circulation with arrows around a dollar coin, symbolizing financial flow and economic activity in a dynamic system. Trend decrease vectors Vector art of illustration depicting money circulation with arrows around a dollar coin, representing financial flow and economic. This illustration portrays money circulation with arrows around a dollar coin, symbolizing financial flow and economic activity in a dynamic system
Free with trial Modern abstract zigzag-shaped chart depicting fluctuations in data analysis representing concept. Trend decrease illustrations Modern abstract zigzag-shaped line chart representing fluctuations in data analysis concept. Modern abstract zigzag-shaped chart depicting fluctuations in data analysis representing concept
Free with trial Curved red down arrow and green up arrow icons for visualizing growth, decline, trends, performance metrics, charts, and financial data. Trend decrease vectors Curved red down and green up arrows for growth and decline indicators. Curved red down arrow and green up arrow icons for visualizing growth, decline, trends, performance metrics, charts, and financial data
Free with trial The visual depicts a financial bar chart in a minimalist style, showcasing a decline with bars in gradient hues, creating a striking contrast against a dark background. Trend decrease illustrations A minimalist representation of a collapsing financial bar chart with vibrant colors. The visual depicts a financial bar chart in a minimalist style, showcasing a decline with bars in gradient hues, creating a striking contrast against a dark background.
Free with trial A white piggy bank alongside coins and a rising graph, symbolizing savings growth and financial prosperity, Generative AI. Trend decrease illustrations Shrinking savings account balance with a descending interest rate graph, financial anxiety. A white piggy bank alongside coins and a rising graph, symbolizing savings growth and financial prosperity, Generative AI.
Free with trial A close-up of a piggy bank beside glasses and coins, symbolizing savings and financial growth on a chart, Generative AI. Trend decrease illustrations Shrinking savings account balance with a descending interest rate graph, financial anxiety. A close-up of a piggy bank beside glasses and coins, symbolizing savings and financial growth on a chart, Generative AI.
Free with trial Growth chart icon. Decline line symbol. Vector business graphic. Profit and loss shape. EPS 10. Trend decrease vectors Growth chart icon. Decline line symbol. Vector business graphic. Profit and loss shape.
Free with trial This vibrant line chart illustrates growth and decline trends with colored circles, making it suitable for business presentations, reports, and educational material. Trend decrease illustrations Colorful Line Chart Showing Growth and Decline Trends with Green, Yellow, and Red Circles Representing Data Points over Time. This vibrant line chart illustrates growth and decline trends with colored circles, making it suitable for business presentations, reports, and educational material
Free with trial This vibrant image features a collection of colorful 3D bar graphs representing data trends, perfect for visualizing statistics in business presentations and analyses. Trend decrease illustrations Colorful Bar Graph with 3D Shapes Representing Data Trends and Visualizing Statistics in Business and Finance Environments. This vibrant image features a collection of colorful 3D bar graphs representing data trends, perfect for visualizing statistics in business presentations and analyses
Free with trial A person holding a glowing globe with arrows indicating rising quality and falling costs. Trend decrease illustrations Concept of improving quality while reducing costs with a global view. A person holding a glowing globe with arrows indicating rising quality and falling costs
Free with trial A conceptual illustration showing stacks of gold coins arranged in a descending graph pattern with a large red arrow pointing downwards, symbolizing economic loss, financial crisis, market decline, and reduced business revenue. Trend decrease vectors A red arrow pointing down over stacks of gold coins representing falling profits and decreasing financial business growth isolated. A conceptual illustration. A conceptual illustration showing stacks of gold coins arranged in a descending graph pattern with a large red arrow pointing downwards, symbolizing economic loss, financial crisis, market decline, and reduced business revenue
Free with trial Wooden blocks display plus minus and percentage symbols representing financial concepts like profit loss interest rates discounts and investment growth used in business education and marketing materi. Trend decrease illustrations Wooden blocks plus minus percentage math finance investment growth profit loss calculation interest rate discount sale promotion m. Wooden blocks display plus minus and percentage symbols representing financial concepts like profit loss interest rates discounts and investment growth used in business education and marketing materi
Free with trial Gross Domestic Product (GDP) text on a world map, indicating economic analysis direction with up and down arrows, symbolizing global investment and financial trends. Trend decrease illustrations Gross Domestic Product GDP text in center of global map with arrows indicating economic analysis direction of stock and investment. Gross Domestic Product (GDP) text on a world map, indicating economic analysis direction with up and down arrows, symbolizing global investment and financial trends
Free with trial Bitcoin BTC Cryptocurrency on the display board with red arrow down, 3d rendering. Trend decrease illustrations Bitcoin BTC Cryptocurrency on the display board with red arrow down
Free with trial Colorful bar charts illustrating positive and negative business trends from january to may provide a clear visual representation of performance. Trend decrease vectors Colorful bar charts illustrating positive and negative business trends from january to may provide a clear visual
Free with trial Elevate your financial presentations and data visualizations with these captivating vintage-style arrow graphics. Perfect for illustrating price fluctuations, interest rate movements, and market trends, these retro-inspired up and down arrow designs are a visually engaging way to convey complex information. The sepia tone and textured background add a touch of vintage charm, bringing a classic. Trend decrease illustrations Vintage-Inspired Arrow Graphics for Illustrating Price & Interest Rate Trends: A Retro Style Design Element. Elevate your financial presentations and data visualizations with these captivating vintage-style arrow graphics. Perfect for illustrating price fluctuations, interest rate movements, and market trends, these retro-inspired up and down arrow designs are a visually engaging way to convey complex information. The sepia tone and textured background add a touch of vintage charm, bringing a classic
Free with trial Market Downturn Red candlestick chart on a grid background with metallic cylinder accents. Depth of field effect. Stock photo. Trend decrease illustrations Market Downturn Red candlestick chart on a grid background with metallic cylinder accents. Depth of field effect
Free with trial This illustration features two colorful bar graphs on a white background, showcasing data comparison with distinct color palettes for engaging visual analysis and presentations. Trend decrease illustrations Colorful Bar Graphs on White Background Representing Data Comparison and Growth with Different Color Schemes for Visual Analysis. This illustration features two colorful bar graphs on a white background, showcasing data comparison with distinct color palettes for engaging visual analysis and presentations
Free with trial Dynamic red and blue stock market graph with data points and financial charts on a dark background. Generative AI. Trend decrease illustrations Dynamic red and blue stock market graph with data points and financial charts on a dark background
Free with trial Intersecting colorful lines trending up and down across a graph illustrate weekly progress from monday to sunday, capturing fluctuations in performance over time. Trend decrease illustrations Intersecting colorful lines trending up and down across a graph illustrate weekly progress from monday to sunday
Free with trial A layered arrangement of dark wooden blocks displaying decreasing red and tan bars, with a downward arrow illustrating a downturn in financial or market performance. Trend decrease illustrations Stacked black wooden cubes with red and tan descending bar charts and downward arrow symbolizing financial or business decline. A layered arrangement of dark wooden blocks displaying decreasing red and tan bars, with a downward arrow illustrating a downturn in financial or market performance
Free with trial Vector illustration of a graph with a downward arrow, representing decline or negative growth. Trend decrease vectors Professional Graph with Arrow Down Outline Icon Vector Illustration. Vector illustration of a graph with a downward arrow, representing decline or negative growth.
Free with trial Man in blue shirt analyzing colorful bar chart, business performance review and data analysis,Generative AI. Trend decrease illustrations Man in blue shirt analyzing colorful bar chart, business performance review and data analysis
Free with trial Simple percent decline or low cost price icon. concept of debt sign or recession. simple style trend modern business or gdp logotype graphic art design web element isolated on white background. Trend decrease vectors Simple percent decline or low cost price icon
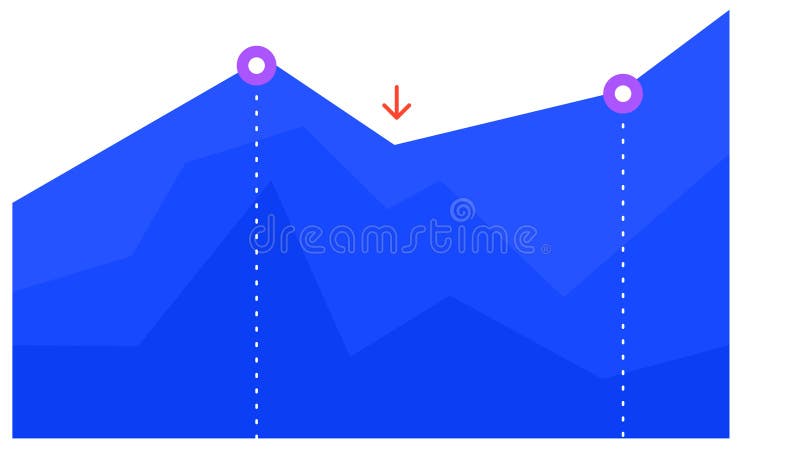
Free with trial Blue graph chart is visually representing growth, decline, and subsequent recovery, with two key points highlighted by purple circles and a red arrow indicating a temporary dip. Trend decrease vectors Blue graph chart is visually representing growth, decline, and subsequent recovery, with two key points highlighted by
Free with trial Blue graph chart is visually representing growth, decline, and subsequent recovery, with two key points highlighted by purple circles and a red arrow indicating a temporary dip. Trend decrease illustrations Blue graph chart is visually representing growth, decline, and subsequent recovery, with two key points highlighted by
Free with trial A chart that shows a decline. A falling chart that goes down sharply, a market crash. Vector illustration. Trend decrease vectors A chart that shows a decline. A falling chart that goes down sharply, a market crash. Vector
Free with trial This vibrant bar graph showcases varying heights for data visualization, perfect for representing trends in finance or business analysis against a clean white background. Trend decrease illustrations Colorful Bar Graph with Varying Heights Representing Data Trends and Insights in a Minimalist Art Style on White Background. This vibrant bar graph showcases varying heights for data visualization, perfect for representing trends in finance or business analysis against a clean white background
Free with trial A vibrant 3D bar graph illustration shows financial growth trends with colorful bars. Perfect for business presentations, analytics, and creative projects. Trend decrease illustrations Colorful 3D bar graph illustration depicting financial growth and performance trends with vibrant hues and clean modern design for. A vibrant 3D bar graph illustration shows financial growth trends with colorful bars. Perfect for business presentations, analytics, and creative projects
Free with trial A visually appealing line graph illustrates data fluctuations and trends over time. The minimalist design makes it suitable for presentations and reports in various fields. Trend decrease illustrations Line graph depicting data trends with fluctuations and peaks over time in a minimalist style, showcasing analytical insights and. A visually appealing line graph illustrates data fluctuations and trends over time. The minimalist design makes it suitable for presentations and reports in various fields
Free with trial Red arrow going down stock icon on white background. Bankruptcy, financial market crash icon for your web site design, logo, app, UI. graph chart down trend symbol. chart going down sign. Trend decrease vectors Red arrow going down stock icon on white background. Bankruptcy, financial market crash icon for your web site design
Free with trial Colorful bar charts illustrating positive and negative business trends from january to may provide a clear visual representation of performance. Trend decrease illustrations Colorful bar charts illustrating positive and negative business trends from january to may provide a clear visual
Free with trial A tall stack of coins is shown, with a red downward arrow prominently positioned beside it. The coins are various denominations, and the background is a blurred, out-of-focus image suggesting a neutral, possibly slightly textured surface. The overall impression is one of financial loss and economic downturn. Trend decrease illustrations DecreasingValue A Stack of Coins Diminishes, symbolized by a sharp red downward arrow, illustrating financial decline and economic. A tall stack of coins is shown, with a red downward arrow prominently positioned beside it. The coins are various denominations, and the background is a blurred, out-of-focus image suggesting a neutral, possibly slightly textured surface. The overall impression is one of financial loss and economic downturn
Free with trial Featuring four vibrant business charts illustrating increasing, decreasing, fluctuating, and peaking trends, perfect for enhancing presentations and reports with clear visual data analysis. Trend decrease vectors Featuring four vibrant business charts illustrating increasing, decreasing, fluctuating, and peaking trends, perfect for
Free with trial Colorful horizontal bar chart is displaying monthly statistics from january to may, indicating trends and performance with a speech bubble above. Trend decrease vectors Colorful horizontal bar chart is displaying monthly statistics from january to may, indicating trends and performance
Free with trial Percentage sign with downward red and white arrows, financial decline, economic downturn, minimalist design, dark background, 3D render, market crash. Trend decrease illustrations Percentage sign with downward red and white arrows, financial decline
Free with trial Percentage sign with downward red and white arrows, financial decline, economic downturn, minimalist design, dark background, 3D render, market crash. Trend decrease illustrations Percentage sign with downward red and white arrows, financial decline
Free with trial Percentage sign with downward red and white arrows, financial decline, economic downturn, minimalist design, dark background, 3D render, market crash. Trend decrease illustrations Percentage sign with downward red and white arrows, financial decline
Free with trial Percentage sign with downward red and white arrows, financial decline, economic downturn, minimalist design, dark background, 3D render, market crash. Trend decrease illustrations Percentage sign with downward red and white arrows, financial decline