Free with trial Bankrupt businesswoman put head on table near chart demonstrating crisis fall of stock market. Bankrupt woman investor upset by bad news about stock price decline or fed rate cut for lending. Trend decrease vectors Bankrupt businesswoman put head on table near chart demonstrating crisis fall of stock market
Free with trial Confident businessman holding a large gold arrow pointing down. Professional challenges and market downturn concept. Vector illustration. Trend decrease vectors Businessman. Flat Vector Illustration. Confident businessman holding a large gold arrow pointing down. Professional challenges and market downturn concept. Vector illustration.
Free with trial Reduction chart icon isolated on white background. Eps 10. Trend decrease vectors Reduction Chart Icon Set. Downward graph vector symbol in a black filled and outlined style. Decline Trend Sign. Reduction chart icon isolated on white background. Eps 10
Free with trial 3D Isometric Flat Vector Illustration of Economy Recession, Company Bankruptcy. Trend decrease vectors 3D Isometric Flat Vector Illustration of Economy Recession
Free with trial Collapse stock market is seen by man invested money, standing near collapsing financial chart. Crisis in stock market and sharp stop in growth or beginning of decline in prices for stocks and bonds. Trend decrease vectors Collapse of stock market is seen by man invested money, standing near collapsing financial chart. Collapse stock market is seen by man invested money, standing near collapsing financial chart. Crisis in stock market and sharp stop in growth or beginning of decline in prices for stocks and bonds
Free with trial Stock market trading graph in red color as economy 3D illustration background. Trend decrease illustrations Stock market trading graph in red color as economy 3D
Free with trial Stock market trading graph in red color as economy 3D illustration background. Trend decrease illustrations Stock market trading graph in red color as economy 3D
Free with trial Stock market trading graph in red color as economy 3D illustration background. Trend decrease illustrations Stock market trading graph in red color as economy 3D
Free with trial Ascending and descending arrow set. Dynamic movement and direction theme. Vector illustration. EPS 10. Stock image. Trend decrease vectors Ascending and descending arrow set. Dynamic movement and direction theme. Vector illustration. EPS 10. S
Free with trial Calculator, coin, dollar sign, green arrows, up, down. Trend decrease vectors Calculator, coin, dollar sign
Free with trial Economic downturn shown with large red arrow pointing down, financial decline and recession graph concept. Trend decrease illustrations Economic downturn shown with large red arrow pointing down
Free with trial Recession concept. Falling market. The trading broker is horrified at the falling market. Financial graph down. Vector illustration isometric design. Trend decrease illustrations Recession concept. Falling market. Vector illustration isometric design. Recession concept. Falling market. The trading broker is horrified at the falling market. Financial graph down. Vector illustration isometric design.
Free with trial Recession concept. Falling market. The trading broker is horrified at the falling market. Financial graph down. Vector illustration isometric design. Trend decrease vectors Recession concept. Falling market. Vector illustration isometric design. Recession concept. Falling market. The trading broker is horrified at the falling market. Financial graph down. Vector illustration isometric design.
Free with trial Recession concept. Falling market. The trading broker is horrified at the falling market. Financial graph down. Vector illustration isometric design. Trend decrease vectors Recession concept. Falling market. Vector illustration isometric design. Recession concept. Falling market. The trading broker is horrified at the falling market. Financial graph down. Vector illustration isometric design.
Free with trial Discover the correlation between age and salary growth. A visual representation highlights trends in compensation over time. Trend decrease illustrations Explore the balance between age and creativity. Understand how they decline and improve in the professional journey. Discover the correlation between age and salary growth. A visual representation highlights trends in compensation over time
Free with trial Interest rate concept percent sign with coins and graph arrow Vertical Mobile Wallpaper. Trend decrease illustrations Interest rate concept percent sign with coins and graph arrow
Free with trial Interest rate concept percent sign with coins and graph arrow Vertical Mobile Wallpaper. Trend decrease illustrations Interest rate concept percent sign with coins and graph arrow
Free with trial Interest rate concept percent sign with coins and graph arrow Vertical Mobile Wallpaper. Trend decrease illustrations Interest rate concept percent sign with coins and graph arrow
Free with trial Decline graph prohibited. No downturn allowed signs. Anti-recession symbols. Vector illustration. EPS 10. Stock image. Trend decrease vectors Decline graph prohibited. No downturn allowed signs. Anti-recession symbols. Vector illustration. EPS 10.
Free with trial Interest rate concept percent sign with coins and graph arrow For Social Media Post Size. Trend decrease illustrations Interest rate concept percent sign with coins and graph arrow
Free with trial Interest rate concept percent sign with coins and graph arrow For Social Media Post Size. Trend decrease illustrations Interest rate concept percent sign with coins and graph arrow
Free with trial Graph table graphs illustration data variables, time precision, connection interpret graph table graphs. Trend decrease illustrations Graph table graphs
Free with trial Hand holding graph symbolizing increasing and decreasing value. Trend decrease vectors Hand holding graph
Free with trial A vibrant pink graph line ascends diagonally against a dark background, representing upward growth. The image evokes a sense of dynamic increase. The style is reminiscent of a modern, technological aesthetic. The subtle grid pattern in the background adds depth, created to simulate a data visualizat. Trend decrease illustrations Uptrend. A vibrant pink graph line ascends diagonally against a dark background, representing upward growth. The image evokes a sense of dynamic increase. The style is reminiscent of a modern, technological aesthetic. The subtle grid pattern in the background adds depth, created to simulate a data visualizat
Free with trial Stock market or forex trading candlestick graph in graphic design for financial investment concept. Motion. Financial data and diagrams showing increase and decrease in profits. Trend decrease illustrations Stock market or forex trading candlestick graph in graphic design for financial investment concept. Motion. Financial
Free with trial A man is writing in a notebook while looking at a graph. The graph shows a downward trend, which may indicate a decrease in sales or a negative outcome. Trend decrease illustrations A man is writing in a notebook while looking at a graph
Free with trial A glowing digital bull surrounded by stock market data, representing financial growth and bullish market trends. Trend decrease illustrations A glowing digital bull surrounded by stock market data, representing financial growth and bullish market trends
Free with trial Businessman in suit jumps between cliffs with red downward arrow on left and green upward arrow on right, symbolizing financial recovery and growth. Trend decrease illustrations Businessman jumping from financial decline to success. Businessman in suit jumps between cliffs with red downward arrow on left and green upward arrow on right, symbolizing financial recovery and growth
Free with trial Blue 3D Percentage Symbol With Arrow Pointing Down on Yellow Background as Blank Banner for Displaying a Marketing Ad. Vector Illustration. Trend decrease vectors Blue 3D Percentage Symbol With Arrow Pointing Down on Yellow Background as Blank Banner for Displaying a Marketing Ad.
Free with trial Red arrow graph depicting a downward trend on a white background. The arrow has a zigzag shape, indicating a decrease or decline, often used in financial contexts to represent falling figures or negative growth. The bold red color enhances its visibility and conveys urgency or alert. Trend decrease vectors Red downturn arrow. Red arrow graph depicting a downward trend on a white background. The arrow has a zigzag shape, indicating a decrease or decline, often used in financial contexts to represent falling figures or negative growth. The bold red color enhances its visibility and conveys urgency or alert.
Free with trial Reduction chart icon isolated on white background. Eps 10. Trend decrease vectors Reduction Chart Icon Set. Downward graph vector symbol in a black filled and outlined style. Decline Trend Sign. Reduction chart icon isolated on white background. Eps 10
Free with trial Reduction chart icon isolated on white background. Eps 10. Trend decrease vectors Reduction Chart Icon Set. Downward graph vector symbol in a black filled and outlined style. Decline Trend Sign. Reduction chart icon isolated on white background. Eps 10
Free with trial Reduction chart icon isolated on white background. Eps 10. Trend decrease vectors Reduction Chart Icon Set. Downward graph vector symbol in a black filled and outlined style. Decline Trend Sign. Reduction chart icon isolated on white background. Eps 10
Free with trial Reduction chart icon isolated on white background. Eps 10. Trend decrease vectors Reduction Chart Icon Set. Downward graph vector symbol in a black filled and outlined style. Decline Trend Sign. Reduction chart icon isolated on white background. Eps 10
Free with trial Stacked gold coins next to a red downward arrow on a gray grid background, representing financial decline. 3D Rendering. Trend decrease illustrations Stack of coins with red downward arrow on grid background. 3D Rendering. Stacked gold coins next to a red downward arrow on a gray grid background, representing financial decline. 3D Rendering
Free with trial Graph chart going up and down sign arrows flat design vector illustration on white background. Trend decrease vectors Graph chart going up and down sign arrows flat design vector illustration
Free with trial Curved white arches form a tunnel-like structure with a smooth, continuous flow. The arches decrease in size as they recede into the bright distance. The design is sleek and modern, with light filtering through a textured ceiling pattern, casting dynamic shadows on the floor. The overall ambiance is serene and futuristic, emphasizing minimalism with its monochromatic scheme and smooth surfaces. Trend decrease illustrations Curved Arches. Curved white arches form a tunnel-like structure with a smooth, continuous flow. The arches decrease in size as they recede into the bright distance. The design is sleek and modern, with light filtering through a textured ceiling pattern, casting dynamic shadows on the floor. The overall ambiance is serene and futuristic, emphasizing minimalism with its monochromatic scheme and smooth surfaces.
Free with trial A vibrant red arrow points downward, resting on a silver coin, signifying a market decline. This 3D rendering, generated by AI, visually represents economic downturn or price reduction. Use it to illustrate concepts related to financial loss, market trends, and economic instability. Trend decrease illustrations Falling Prices. A vibrant red arrow points downward, resting on a silver coin, signifying a market decline. This 3D rendering, generated by AI, visually represents economic downturn or price reduction. Use it to illustrate concepts related to financial loss, market trends, and economic instability.
Free with trial Bear market growth icon. Simple bear market growth icon for social media, app, and web design. Vector illustration. Trend decrease vectors Bear Market Growth Icon
Free with trial Axis lighting up line graph illustration plot point, grid series, marker label axis lighting up line graph. Trend decrease illustrations Axis lighting up line graph
Free with trial Spilled oil beside a sharply downward trending graph, generated by AI, visually represents the dramatic fall in oil prices. The image suggests instability and economic downturn within the oil market. Trend decrease illustrations Oil Price Crash. Spilled oil beside a sharply downward trending graph, generated by AI, visually represents the dramatic fall in oil prices. The image suggests instability and economic downturn within the oil market.
Free with trial Analysis shifting line chart illustration visualization movement, axis series, dynamic fluctuation analysis shifting line chart. Trend decrease illustrations Analysis shifting line chart
Free with trial Graph chart infographic report set with statistic arrow data elements for financial market analysis and planning in business performance research for your illustration. Trend decrease vectors Graph chart infographic report set
Free with trial Graph chart infographic report set with statistic arrow data elements for financial market analysis and planning in business performance research for your illustration. Trend decrease vectors Graph chart infographic report set
Free with trial Graph chart infographic report set with statistic arrow data elements for financial market analysis and planning in business performance research for your illustration. Trend decrease vectors Graph chart infographic report set
Free with trial A 3D illustration of a money coin with an arrow pointing down, isolated on a white background, symbolizing loss, decline, and finance. Trend decrease illustrations Money coin arrow down 3D icon illustration. A 3D illustration of a money coin with an arrow pointing down, isolated on a white background, symbolizing loss, decline, and finance
Free with trial Bull and bear market icon. Simple bull and bear market icon for social media, app, and web design. Vector illustration. Trend decrease vectors Bull and bear market icon
Free with trial A vibrant 3D bar chart icon isolated on a clean white background. This minimalist data visualization features five colorful bars in a soft, pastel palette of yellow, pink, and purple, arranged in descending order. The clean, modern render is perfect for illustrating concepts like business statistics, financial reports, market analysis, and performance metrics. An ideal graphic element for presentations, infographics, websites, and educational materials, symbolizing data, comparison, and analytics in a visually appealing way. 3D illustration. Trend decrease illustrations 3D Colorful Bar Chart for Business and Data Analysis. A vibrant 3D bar chart icon isolated on a clean white background. This minimalist data visualization features five colorful bars in a soft, pastel palette of yellow, pink, and purple, arranged in descending order. The clean, modern render is perfect for illustrating concepts like business statistics, financial reports, market analysis, and performance metrics. An ideal graphic element for presentations, infographics, websites, and educational materials, symbolizing data, comparison, and analytics in a visually appealing way. 3D illustration.
Free with trial Hydropower concept. Illustration of efficient energy use leading to lower utility expenses with happy individuals. Vector illustration. Trend decrease vectors Hydropower. Flat Vector Illustration. Hydropower concept. Illustration of efficient energy use leading to lower utility expenses with happy individuals. Vector illustration.
Free with trial Reduction chart icon isolated on white background. Eps 10. Trend decrease vectors Reduction Chart Icon Set. Downward graph vector symbol in a black filled and outlined style. Decline Trend Sign. Reduction chart icon isolated on white background. Eps 10
Free with trial This image shows a declining bar graph and a person reacting to a financial crisis. Vector illustration design using ai tool. Trend decrease vectors Economic collapse is coming. This image shows a declining bar graph and a person reacting to a financial crisis. Vector illustration design using ai tool.
Free with trial Red arrows pointing downward over a world map symbolize global financial decline. Trend decrease vectors Global stock market crash with red falling arrows. Red arrows pointing downward over a world map symbolize global financial decline
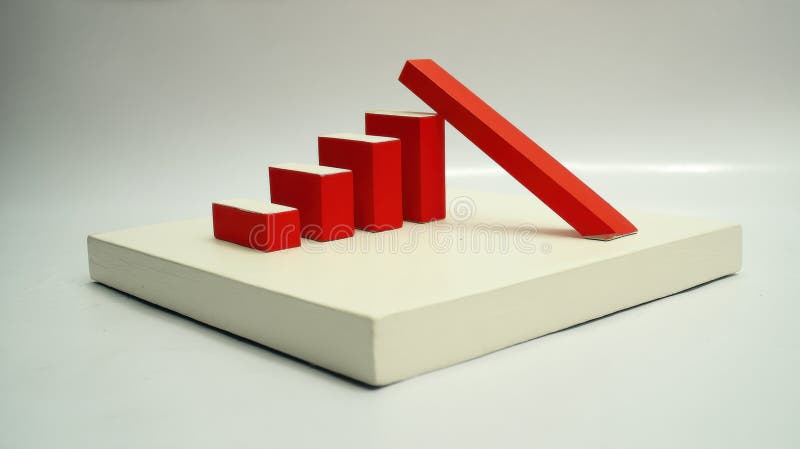
Free with trial This image shows a 3D model of a bar graph, where one bar is falling, symbolizing decline or failure. This striking visual representation was generated by AI, offering a unique perspective on downward trends and economic instability. The clean design makes it ideal for illustrating various concepts. Trend decrease illustrations Falling Bar Graph. This image shows a 3D model of a bar graph, where one bar is falling, symbolizing decline or failure. This striking visual representation was generated by AI, offering a unique perspective on downward trends and economic instability. The clean design makes it ideal for illustrating various concepts
Free with trial Illustration of a descending bar chart icon consisting of three bars of different heights, showing a gradual decrease in data from left to right. Trend decrease illustrations Bar Chart free icon. Illustration of a descending bar chart icon consisting of three bars of different heights, showing a gradual decrease in data from left to right
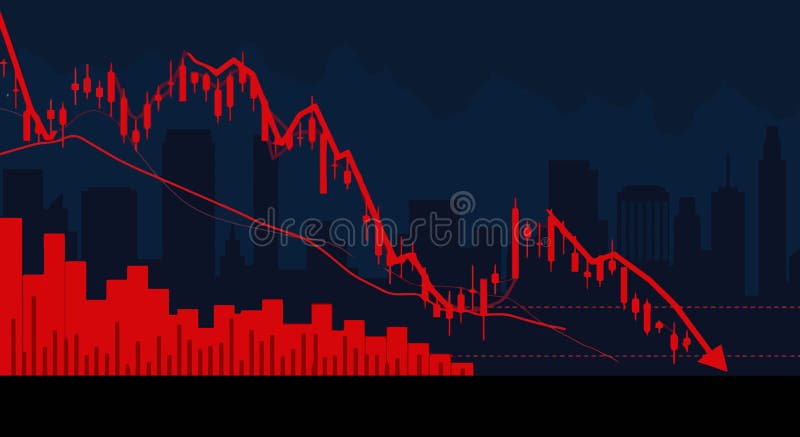
Free with trial This image shows a declining stock market graph with red candlesticks and bars. Vector illustration design using ai tool. Trend decrease vectors Stock market crash recession. This image shows a declining stock market graph with red candlesticks and bars. Vector illustration design using ai tool.
Free with trial Blue and red lines show economic decline. Vector illustration design using ai tool. Trend decrease vectors Recession chart. Blue and red lines show economic decline. Vector illustration design using ai tool.
Free with trial Stacks of golden coins arranged in ascending order, representing financial growth and investment. The background features a blurred stock market graph, symbolizing market trends and investment opportunities. The image conveys concepts of wealth accumulation, financial planning, and economic prosperity. Suitable for illustrating articles, presentations, or advertisements related to finance, investment, and business. Trend decrease illustrations Financial Growth and Investment
Free with trial GHG, greenhouse gas emissions chart vector icon, eps 10 file, easy to edit. Trend decrease vectors GHG, greenhouse gas emissions chart vector icon
Free with trial Strategy for surviving economic crisis or recession, finding way out of business problems, maintaining financial position and cash during stock market crash, risky investments, man holds graph column. Trend decrease vectors Man holds graph column
Free with trial Conceptual financial illustration of a falling stock market index. Red line graph showing sharp decline, volatility, and economic crisis point with a target circle on a dark grid background. Trend decrease illustrations Red stock market graph showing economic crash and financial crisis on dark background. Conceptual financial illustration of a falling stock market index. Red. Conceptual financial illustration of a falling stock market index. Red line graph showing sharp decline, volatility, and economic crisis point with a target circle on a dark grid background.
Free with trial A downward trending red arrow, generated by AI, rests on a smartphone displaying a graph, symbolizing a market decline. This visualization is a powerful representation of negative financial trends and economic downturn, ideal for illustrating news reports or financial analyses. Trend decrease illustrations Mobile Market Crash. A downward trending red arrow, generated by AI, rests on a smartphone displaying a graph, symbolizing a market decline. This visualization is a powerful representation of negative financial trends and economic downturn, ideal for illustrating news reports or financial analyses.
Free with trial A hand-drawn chart on a napkin depicts a market downturn, alongside cash and coins. This image, generated by AI, symbolizes economic uncertainty and the informal nature of financial planning. It visually represents potential anxieties surrounding investments and personal finances. Trend decrease illustrations Napkin Market Crash. A hand-drawn chart on a napkin depicts a market downturn, alongside cash and coins. This image, generated by AI, symbolizes economic uncertainty and the informal nature of financial planning. It visually represents potential anxieties surrounding investments and personal finances.
Free with trial A businessman stands with a briefcase, surrounded by declining bar charts and downward arrows. Vector art design using ai tool. Trend decrease vectors Stock Market Down Illustration. A businessman stands with a briefcase, surrounded by declining bar charts and downward arrows. Vector art design using ai tool.
Free with trial This image, generated by AI, depicts a downward trending graph inside a caged cube, symbolizing economic downturn. A jar of coins nearby further emphasizes the financial implications. The red arrow dramatically highlights the severity of the decline. Trend decrease illustrations Declining Economy: AI. This image, generated by AI, depicts a downward trending graph inside a caged cube, symbolizing economic downturn. A jar of coins nearby further emphasizes the financial implications. The red arrow dramatically highlights the severity of the decline.
Free with trial This AI-generated image depicts a bar graph where the bars are covered in a melting, metallic substance, suggesting a market downturn. The dripping metal symbolizes loss and decline, generated by AI for visual representation. Trend decrease illustrations Melting Market Graph. This AI-generated image depicts a bar graph where the bars are covered in a melting, metallic substance, suggesting a market downturn. The dripping metal symbolizes loss and decline, generated by AI for visual representation.
Free with trial Analyzing the business failure and decline. White magnifying glass analyzing a growth chart on a blue background, representing market analysis and business growth. 3D render. Trend decrease illustrations Magnifying glass analyzing growth chart on blue background. Analyzing the business failure and decline. White magnifying glass analyzing a growth chart on a blue background, representing market analysis and business growth. 3D render
Free with trial Creative abstract background with multiple glowing downward arrows in red and orange tones. Graphic representation of financial loss, bear market, economic downturn, and business failure. High-tech digital design with selective focus and light effects for financial and data analysis concepts. Trend decrease illustrations Glowing downward arrows on red background representing economic crash and market decline. Creative abstract background with multiple glowing downward arrows in red and orange tones. Graphic representation of financial loss, bear market, economic downturn, and business failure. High-tech digital design with selective focus and light effects for financial and data analysis concepts.
Free with trial Abstract isometric view of multiple red arrows moving downward on a dark grid texture with selective focus. Business and finance concept illustrating a market crash, economic downturn, negative growth, and decreasing investment value. Trend decrease illustrations Red down arrows on grid background representing financial decline and stock market crash. Abstract isometric view of multiple red arrows moving downward on a dark grid texture with selective focus. Business and finance concept illustrating a market crash, economic downturn, negative growth, and decreasing investment value.
Free with trial Digital analyst showcases Bounce Rate on a comprehensive dashboard. Monitoring user retention, pinpointing site issues. Ensuring optimal user experience and web engagement. Flat vector illustration. Trend decrease vectors Digital analyst showcases Bounce Rate on a comprehensive dashboard
Free with trial A person analyzing stock market charts with a pointer. Vector art design using ai tool. Trend decrease vectors Stock Market Illustration Charts. A person analyzing stock market charts with a pointer. Vector art design using ai tool.
Free with trial A close-up of a stock market chart showing a sharp downturn. The orange line graph against a dark background with gridlines illustrates the volatility and potential risks in financial markets. The image captures the urgency and anxiety associated with market fluctuations. The "MA 1000" text is visib. Trend decrease illustrations Stock Market Downturn. A close-up of a stock market chart showing a sharp downturn. The orange line graph against a dark background with gridlines illustrates the volatility and potential risks in financial markets. The image captures the urgency and anxiety associated with market fluctuations. The "MA 1000" text is visib
Free with trial Uptrend and downtrend arrow vector icon. Trend decrease illustrations Uptrend and downtrend arrow vector icon
Free with trial This image depicts a sharply declining stock market graph, generated by AI, highlighting the severity of the downturn. The red arrow emphasizes the dramatic fall in market values, representing a potential crisis for investors. Trend decrease illustrations Market Crash: Red Alert. This image depicts a sharply declining stock market graph, generated by AI, highlighting the severity of the downturn. The red arrow emphasizes the dramatic fall in market values, representing a potential crisis for investors.
Free with trial A 3D rendered illustration depicting business growth. The image showcases two upward-trending arrow charts, one in gold and the other in blue, representing positive trends, progress, and success. The charts are set against a clean, light background, emphasizing the upward movement and potential for financial gain. Suitable for illustrating economic growth, investment strategies, and business performance. Trend decrease illustrations Growth Chart with Arrows. A 3D rendered illustration depicting business growth. The image showcases two upward-trending arrow charts, one in gold and the other in blue, representing positive trends, progress, and success. The charts are set against a clean, light background, emphasizing the upward movement and potential for financial gain. Suitable for illustrating economic growth, investment strategies, and business performance.
Free with trial Two pairs of arrows with green and red percentages, symbolizing positive and negative trends, with urban background Generative AI. Trend decrease illustrations Two pairs of arrows with green and red percentages, symbolizing positive and negative trends, with urban background
Free with trial Two pairs of arrows with green and red percentages, symbolizing positive and negative trends, with urban background Generative AI. Trend decrease illustrations Two pairs of arrows with green and red percentages, symbolizing positive and negative trends, with urban background
Free with trial Data merging loss graph illustration analysis metrics, performance validation, accuracy convergence data merging loss graph. Trend decrease illustrations Data merging loss graph
Free with trial A minimalist black and white icon representing a financial growth chart. It features a series of vertical bars of varying heights, symbolizing data points or periods, overlaid with a line graph connecting circular nodes. This graphic effectively conveys concepts of financial analysis, business growth, performance tracking, and data visualization. Ideal for presentations, reports, websites, and applications related to finance, economics, and business intelligence. Trend decrease vectors Growth Analysis Finance Chart Icon. A minimalist black and white icon representing a financial growth chart. It features a series of vertical bars of varying heights, symbolizing data points or periods, overlaid with a line graph connecting circular nodes. This graphic effectively conveys concepts of financial analysis, business growth, performance tracking, and data visualization. Ideal for presentations, reports, websites, and applications related to finance, economics, and business intelligence.
Free with trial Downturn red stock chart illustration selloff recession, volatility dip, crash slump downturn red stock chart. Trend decrease illustrations Downturn red stock chart
Free with trial This image shows a financial report with bar graphs and numerical data, generated by AI, suggesting business performance or investment analysis. The document rests on a wooden desk, with coins blurred in the background, hinting at financial matters. Trend decrease illustrations Financial Report Analysis. This image shows a financial report with bar graphs and numerical data, generated by AI, suggesting business performance or investment analysis. The document rests on a wooden desk, with coins blurred in the background, hinting at financial matters.