Free with trial Flat bar chart uses dramatically shorter red bars on black to emphasize a sharp fall. Trend decrease illustrations Flat design simple bar chart with dramatically decreasing red bars on black background, emphasizing fall. Flat bar chart uses dramatically shorter red bars on black to emphasize a sharp fall.
Free with trial A bear market, such as stocks or cryptocurrencies, that is in a downtrend , which creates a huge disaster for investors. It is suitable to use the image in articles analyzing various price trends. Trend decrease illustrations A bear market, such as stocks or cryptocurrencies, that is in a downtrend , which creates a huge disaster for investors. It is
Free with trial A bear market, such as stocks or cryptocurrencies, that is in a downtrend , which creates a huge disaster for investors. It is suitable to use the image in articles analyzing various price trends. Trend decrease illustrations A bear market, such as stocks or cryptocurrencies, that is in a downtrend , which creates a huge disaster for investors. It is
Free with trial Flat bar chart uses dramatically shorter red bars on black to emphasize a sharp fall. Trend decrease illustrations Flat design simple bar chart with dramatically decreasing red bars on black background, emphasizing fall. Flat bar chart uses dramatically shorter red bars on black to emphasize a sharp fall.
Free with trial Flat bar chart uses dramatically shorter red bars on black to emphasize a sharp fall. Trend decrease illustrations Flat design simple bar chart with dramatically decreasing red bars on black background, emphasizing fall. Flat bar chart uses dramatically shorter red bars on black to emphasize a sharp fall.
Free with trial A stylized image depicting the depreciation of the Japanese Yen. A glowing red downward trending graph with the word 'DEPRECIATION' and the yen symbol is overlaid on a blurred Japanese flag in the background. The image conveys a sense of economic downturn and financial crisis in Japan. Trend decrease illustrations Japanese Yen Depreciation Chart. A stylized image depicting the depreciation of the Japanese Yen. A glowing red downward trending graph with the word 'DEPRECIATION' and the yen symbol is overlaid on a blurred Japanese flag in the background. The image conveys a sense of economic downturn and financial crisis in Japan.
Free with trial Illustrates a stock market crash with declining graphs and red arrows. Represents economic downturn, financial crisis, and recession. Symbolizes loss, risk, and negative trends in business. Trend decrease illustrations Stock market crash financial crisis recession economic downturn red arrow graph chart diagram decline 2024. Illustrates a stock market crash with declining graphs and red arrows. Represents economic downturn, financial crisis, and recession. Symbolizes loss, risk, and negative trends in business.
Free with trial Generated with the use of AI. Business Analyst Touching a Glowing Cost Reduction Graph on a Virtual Interface Above Laptop Indicating Financial Strategy. Trend decrease illustrations Business Analyst Touching a Glowing Cost Reduction Graph on a Virtual Interface Above Laptop Indicating Financial Strategy
Free with trial Generated with the use of AI. Business Analyst Touching a Glowing Cost Reduction Graph on a Virtual Interface Above Laptop Indicating Financial Strategy. Trend decrease illustrations Business Analyst Touching a Glowing Cost Reduction Graph on a Virtual Interface Above Laptop Indicating Financial Strategy
Free with trial Reduction chart icon isolated on white background. Eps 10. Trend decrease vectors Reduction Chart Icon Set. Downward graph vector symbol in a black filled and outlined style. Decline Trend Sign. Reduction chart icon isolated on white background. Eps 10
Free with trial The image displays a bar chart representing yearly data spanning from 2011 to 2021. The bars are colored in blue, with a notable decrease in bar height in 2020, followed by a large increase in 2021. The chart includes a Y-axis with numerical values, though specific labels are not clearly visible. The bars on the right side of the chart have color-coded sections in green, orange, and yellow,. Trend decrease illustrations Bar chart showing yearly data from 2011 to 2021 with a significant drop in 2020. The image displays a bar chart representing yearly data spanning from 2011 to. The image displays a bar chart representing yearly data spanning from 2011 to 2021. The bars are colored in blue, with a notable decrease in bar height in 2020, followed by a large increase in 2021. The chart includes a Y-axis with numerical values, though specific labels are not clearly visible. The bars on the right side of the chart have color-coded sections in green, orange, and yellow,
Free with trial Real Estate prices and market crashing in United Kingdom with arrows going down, property background. Trend decrease illustrations Real Estate prices and market crashing in United Kingdom with arrows going down, property background
Free with trial The image depicts several miniature Chinese flags placed on a stock market graph showing a significant decline, symbolizing economic instability. Trend decrease illustrations Chinese Flags on a Declining Stock Market Graph. The image depicts several miniature Chinese flags placed on a stock market graph showing a significant decline, symbolizing economic instability
Free with trial Visualizing stock market decline and economic recession with a red chart and downward arrows, showing financial loss and investment risk in a dark background. A sign of economic downturn. Trend decrease illustrations Stock market crash recession financial crisis investment loss economic downturn chart analysis data fall 2024. visualizing stock market decline and economic recession with a red chart and downward arrows, showing financial loss and investment risk in a dark background. A sign of economic downturn.
Free with trial A dramatic illustration of a stock market crash, featuring a sharp, red line graph plummeting downwards. This image symbolizes financial downfall, economic recession, and investment risk in business. Trend decrease illustrations Stock market crash red line graph financial downfall economic recession business loss investment risk chart 2024. A dramatic illustration of a stock market crash, featuring a sharp, red line graph plummeting downwards. This image symbolizes financial downfall, economic recession, and investment risk in business.
Free with trial A business professional presents carbon emission reduction targets on a tablet screen, emphasizing environmental sustainability initiatives. The image showcases a detailed presentation with clear data visualizations, including graphs and charts, illustrating key strategies for achieving net-zero emissions. This modern illustration highlights the importance of corporate responsibility in combating. Trend decrease illustrations A businessperson presenting carbon emission reduction targets on a tablet screen with environmental sustainability icons. A business professional presents carbon emission reduction targets on a tablet screen, emphasizing environmental sustainability initiatives. The image showcases a detailed presentation with clear data visualizations, including graphs and charts, illustrating key strategies for achieving net-zero emissions. This modern illustration highlights the importance of corporate responsibility in combating
Free with trial Data charts shown on mobile devices displayed with a bar graph represent growth and financial analysis on a tech interface Perfect for illustrating investment or business trends. Trend decrease illustrations Analyzing Stock Market Data with Mobile Tech and Bar Graph. Data charts shown on mobile devices displayed with a bar graph represent growth and financial analysis on a tech interface Perfect for illustrating investment or business trends
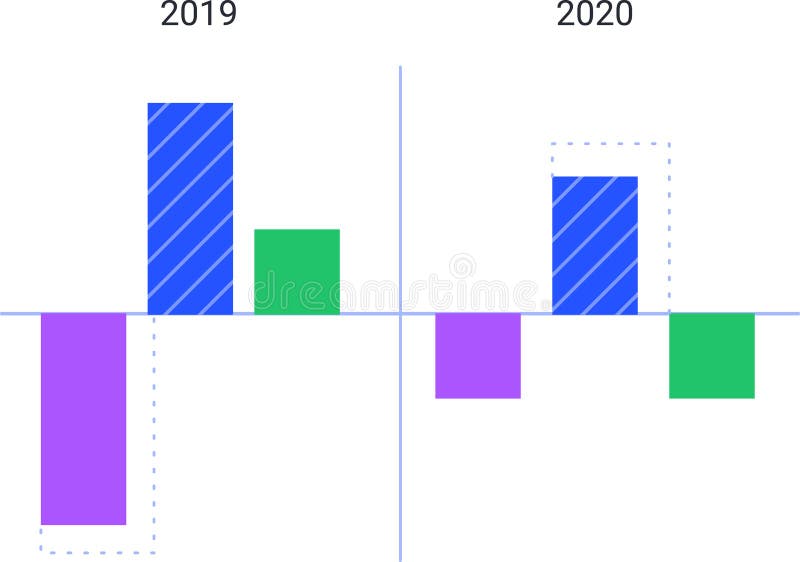
Free with trial Colorful bar charts are comparing data from 2019 and 2020, visualizing trends and statistics with positive and negative values represented by upward and downward bars. Trend decrease vectors Colorful bar charts are comparing data from 2019 and 2020, visualizing trends and statistics with positive and negative
Free with trial Colorful bar charts are comparing data from 2019 and 2020, visualizing trends and statistics with positive and negative values represented by upward and downward bars. Trend decrease illustrations Colorful bar charts are comparing data from 2019 and 2020, visualizing trends and statistics with positive and negative
Free with trial Decline from happy new year 2025 to 2026. Falling black arrow symbol. Wooden blocks representing time passing with grey background. Trend decrease illustrations Decline concept of happy new year from 2025 to 2026 on wooden blocks with falling black arrow symbol over grey background. Decline from happy new year 2025 to 2026. Falling black arrow symbol. Wooden blocks representing time passing with grey background
Free with trial Concept of economic collapse by falling graph, chart, highlighting global recession fueled by inflation, stock market crash, financial crisis, falling income, GDP decline, capital reduction. Trend decrease illustrations Concept of economic collapse by falling graph, chart, highlighting global recession fueled by inflation, stock market crash
Free with trial A bear market, such as stocks or cryptocurrencies, that is in a downtrend , which creates a huge disaster for investors. It is suitable to use the image in articles analyzing various price trends. Trend decrease illustrations A bear market, such as stocks or cryptocurrencies, that is in a downtrend , which creates a huge disaster for investors. It is
Free with trial A bear market, such as stocks or cryptocurrencies, that is in a downtrend , which creates a huge disaster for investors. It is suitable to use the image in articles analyzing various price trends. Trend decrease illustrations A bear market, such as stocks or cryptocurrencies, that is in a downtrend , which creates a huge disaster for investors. It is
Free with trial A bear market, such as stocks or cryptocurrencies, that is in a downtrend , which creates a huge disaster for investors. It is suitable to use the image in articles analyzing various price trends. Trend decrease illustrations A bear market, such as stocks or cryptocurrencies, that is in a downtrend , which creates a huge disaster for investors. It is
Free with trial A bear market, such as stocks or cryptocurrencies, that is in a downtrend , which creates a huge disaster for investors. It is suitable to use the image in articles analyzing various price trends. Trend decrease illustrations A bear market, such as stocks or cryptocurrencies, that is in a downtrend , which creates a huge disaster for investors. It is
Free with trial A bear market, such as stocks or cryptocurrencies, that is in a downtrend , which creates a huge disaster for investors. It is suitable to use the image in articles analyzing various price trends. Trend decrease illustrations A bear market, such as stocks or cryptocurrencies, that is in a downtrend , which creates a huge disaster for investors. It is
Free with trial A bear market, such as stocks or cryptocurrencies, that is in a downtrend , which creates a huge disaster for investors. It is suitable to use the image in articles analyzing various price trends. Trend decrease illustrations A bear market, such as stocks or cryptocurrencies, that is in a downtrend , which creates a huge disaster for investors. It is
Free with trial A bear market, such as stocks or cryptocurrencies, that is in a downtrend , which creates a huge disaster for investors. It is suitable to use the image in articles analyzing various price trends. Trend decrease illustrations A bear market, such as stocks or cryptocurrencies, that is in a downtrend , which creates a huge disaster for investors. It is
Free with trial A bear market, such as stocks or cryptocurrencies, that is in a downtrend , which creates a huge disaster for investors. It is suitable to use the image in articles analyzing various price trends. Trend decrease illustrations A bear market, such as stocks or cryptocurrencies, that is in a downtrend , which creates a huge disaster for investors. It is
Free with trial A bear market, such as stocks or cryptocurrencies, that is in a downtrend , which creates a huge disaster for investors. It is suitable to use the image in articles analyzing various price trends. Trend decrease illustrations A bear market, such as stocks or cryptocurrencies, that is in a downtrend , which creates a huge disaster for investors. It is
Free with trial A bear market, such as stocks or cryptocurrencies, that is in a downtrend , which creates a huge disaster for investors. It is suitable to use the image in articles analyzing various price trends. Trend decrease illustrations A bear market, such as stocks or cryptocurrencies, that is in a downtrend , which creates a huge disaster for investors. It is
Free with trial A bear market, such as stocks or cryptocurrencies, that is in a downtrend , which creates a huge disaster for investors. It is suitable to use the image in articles analyzing various price trends. Trend decrease illustrations A bear market, such as stocks or cryptocurrencies, that is in a downtrend , which creates a huge disaster for investors. It is
Free with trial A bear market, such as stocks or cryptocurrencies, that is in a downtrend , which creates a huge disaster for investors. It is suitable to use the image in articles analyzing various price trends. Trend decrease illustrations A bear market, such as stocks or cryptocurrencies, that is in a downtrend , which creates a huge disaster for investors. It is
Free with trial A bear market, such as stocks or cryptocurrencies, that is in a downtrend , which creates a huge disaster for investors. It is suitable to use the image in articles analyzing various price trends. Trend decrease illustrations A bear market, such as stocks or cryptocurrencies, that is in a downtrend , which creates a huge disaster for investors. It is
Free with trial A bear market, such as stocks or cryptocurrencies, that is in a downtrend , which creates a huge disaster for investors. It is suitable to use the image in articles analyzing various price trends. Trend decrease illustrations A bear market, such as stocks or cryptocurrencies, that is in a downtrend , which creates a huge disaster for investors. It is
Free with trial A bear market, such as stocks or cryptocurrencies, that is in a downtrend , which creates a huge disaster for investors. It is suitable to use the image in articles analyzing various price trends. Trend decrease illustrations A bear market, such as stocks or cryptocurrencies, that is in a downtrend , which creates a huge disaster for investors. It is
Free with trial A bear market, such as stocks or cryptocurrencies, that is in a downtrend , which creates a huge disaster for investors. It is suitable to use the image in articles analyzing various price trends. Trend decrease illustrations A bear market, such as stocks or cryptocurrencies, that is in a downtrend , which creates a huge disaster for investors. It is
Free with trial A bear market, such as stocks or cryptocurrencies, that is in a downtrend , which creates a huge disaster for investors. It is suitable to use the image in articles analyzing various price trends. Trend decrease illustrations A bear market, such as stocks or cryptocurrencies, that is in a downtrend , which creates a huge disaster for investors. It is
Free with trial A bear market, such as stocks or cryptocurrencies, that is in a downtrend , which creates a huge disaster for investors. It is suitable to use the image in articles analyzing various price trends. Trend decrease illustrations A bear market, such as stocks or cryptocurrencies, that is in a downtrend , which creates a huge disaster for investors. It is
Free with trial A bear market, such as stocks or cryptocurrencies, that is in a downtrend , which creates a huge disaster for investors. It is suitable to use the image in articles analyzing various price trends. Trend decrease illustrations A bear market, such as stocks or cryptocurrencies, that is in a downtrend , which creates a huge disaster for investors. It is
Free with trial A bear market, such as stocks or cryptocurrencies, that is in a downtrend , which creates a huge disaster for investors. It is suitable to use the image in articles analyzing various price trends. Trend decrease illustrations A bear market, such as stocks or cryptocurrencies, that is in a downtrend , which creates a huge disaster for investors. It is
Free with trial A bear market, such as stocks or cryptocurrencies, that is in a downtrend , which creates a huge disaster for investors. It is suitable to use the image in articles analyzing various price trends. Trend decrease illustrations A bear market, such as stocks or cryptocurrencies, that is in a downtrend , which creates a huge disaster for investors. It is
Free with trial A bear market, such as stocks or cryptocurrencies, that is in a downtrend , which creates a huge disaster for investors. It is suitable to use the image in articles analyzing various price trends. Trend decrease illustrations A bear market, such as stocks or cryptocurrencies, that is in a downtrend , which creates a huge disaster for investors. It is
Free with trial A bear market, such as stocks or cryptocurrencies, that is in a downtrend , which creates a huge disaster for investors. It is suitable to use the image in articles analyzing various price trends. Trend decrease illustrations A bear market, such as stocks or cryptocurrencies, that is in a downtrend , which creates a huge disaster for investors. It is
Free with trial A bear market, such as stocks or cryptocurrencies, that is in a downtrend , which creates a huge disaster for investors. It is suitable to use the image in articles analyzing various price trends. Trend decrease illustrations A bear market, such as stocks or cryptocurrencies, that is in a downtrend , which creates a huge disaster for investors. It is
Free with trial A bear market, such as stocks or cryptocurrencies, that is in a downtrend , which creates a huge disaster for investors. It is suitable to use the image in articles analyzing various price trends. Trend decrease illustrations A bear market, such as stocks or cryptocurrencies, that is in a downtrend , which creates a huge disaster for investors. It is
Free with trial A bear market, such as stocks or cryptocurrencies, that is in a downtrend , which creates a huge disaster for investors. It is suitable to use the image in articles analyzing various price trends. Trend decrease illustrations A bear market, such as stocks or cryptocurrencies, that is in a downtrend , which creates a huge disaster for investors. It is
Free with trial A bear market, such as stocks or cryptocurrencies, that is in a downtrend , which creates a huge disaster for investors. It is suitable to use the image in articles analyzing various price trends. Trend decrease illustrations A bear market, such as stocks or cryptocurrencies, that is in a downtrend , which creates a huge disaster for investors. It is
Free with trial A bear market, such as stocks or cryptocurrencies, that is in a downtrend , which creates a huge disaster for investors. It is suitable to use the image in articles analyzing various price trends. Trend decrease illustrations A bear market, such as stocks or cryptocurrencies, that is in a downtrend , which creates a huge disaster for investors. It is
Free with trial A bear market, such as stocks or cryptocurrencies, that is in a downtrend , which creates a huge disaster for investors. It is suitable to use the image in articles analyzing various price trends. Trend decrease illustrations A bear market, such as stocks or cryptocurrencies, that is in a downtrend , which creates a huge disaster for investors. It is
Free with trial A bear market, such as stocks or cryptocurrencies, that is in a downtrend , which creates a huge disaster for investors. It is suitable to use the image in articles analyzing various price trends. Trend decrease illustrations A bear market, such as stocks or cryptocurrencies, that is in a downtrend , which creates a huge disaster for investors. It is
Free with trial A bear market, such as stocks or cryptocurrencies, that is in a downtrend , which creates a huge disaster for investors. It is suitable to use the image in articles analyzing various price trends. Trend decrease illustrations A bear market, such as stocks or cryptocurrencies, that is in a downtrend , which creates a huge disaster for investors. It is
Free with trial A bear market, such as stocks or cryptocurrencies, that is in a downtrend , which creates a huge disaster for investors. It is suitable to use the image in articles analyzing various price trends. Trend decrease illustrations A bear market, such as stocks or cryptocurrencies, that is in a downtrend , which creates a huge disaster for investors. It is
Free with trial A bear market, such as stocks or cryptocurrencies, that is in a downtrend , which creates a huge disaster for investors. It is suitable to use the image in articles analyzing various price trends. Trend decrease illustrations A bear market, such as stocks or cryptocurrencies, that is in a downtrend , which creates a huge disaster for investors. It is
Free with trial A bear market, such as stocks or cryptocurrencies, that is in a downtrend , which creates a huge disaster for investors. It is suitable to use the image in articles analyzing various price trends. Trend decrease illustrations A bear market, such as stocks or cryptocurrencies, that is in a downtrend , which creates a huge disaster for investors. It is
Free with trial A bear market, such as stocks or cryptocurrencies, that is in a downtrend , which creates a huge disaster for investors. It is suitable to use the image in articles analyzing various price trends. Trend decrease illustrations A bear market, such as stocks or cryptocurrencies, that is in a downtrend , which creates a huge disaster for investors. It is
Free with trial A bear market, such as stocks or cryptocurrencies, that is in a downtrend , which creates a huge disaster for investors. It is suitable to use the image in articles analyzing various price trends. Trend decrease illustrations A bear market, such as stocks or cryptocurrencies, that is in a downtrend , which creates a huge disaster for investors. It is
Free with trial A bear market, such as stocks or cryptocurrencies, that is in a downtrend , which creates a huge disaster for investors. It is suitable to use the image in articles analyzing various price trends. Trend decrease illustrations A bear market, such as stocks or cryptocurrencies, that is in a downtrend , which creates a huge disaster for investors. It is
Free with trial A bear market, such as stocks or cryptocurrencies, that is in a downtrend , which creates a huge disaster for investors. It is suitable to use the image in articles analyzing various price trends. Trend decrease illustrations A bear market, such as stocks or cryptocurrencies, that is in a downtrend , which creates a huge disaster for investors. It is
Free with trial A bear market, such as stocks or cryptocurrencies, that is in a downtrend , which creates a huge disaster for investors. It is suitable to use the image in articles analyzing various price trends. Trend decrease illustrations A bear market, such as stocks or cryptocurrencies, that is in a downtrend , which creates a huge disaster for investors. It is
Free with trial KYIV, UKRAINE - JANUARY 29, 2025 Nvidia corporation logotype showed on iPhone 15 smartphone display screen. Nvidia is a global leader in artificial intelligence hardware and software. Trend decrease illustrations KYIV, UKRAINE - JANUARY 29, 2025 Nvidia corporation logotype showed on iPhone 15 smartphone display screen. Nvidia is a
Free with trial KYIV, UKRAINE - JANUARY 29, 2025 Nvidia corporation logotype showed on iPhone 15 smartphone display screen. Nvidia is a global leader in artificial intelligence hardware and software. Trend decrease illustrations KYIV, UKRAINE - JANUARY 29, 2025 Nvidia corporation logotype showed on iPhone 15 smartphone display screen. Nvidia is a
Free with trial KYIV, UKRAINE - JANUARY 29, 2025 Nvidia corporation logotype showed on iPhone 15 smartphone display screen. Nvidia is a global leader in artificial intelligence hardware and software. Trend decrease illustrations KYIV, UKRAINE - JANUARY 29, 2025 Nvidia corporation logotype showed on iPhone 15 smartphone display screen. Nvidia is a
Free with trial KYIV, UKRAINE - JANUARY 29, 2025 Nvidia corporation logotype showed on iPhone 15 smartphone display screen. Nvidia is a global leader in artificial intelligence hardware and software. Trend decrease illustrations KYIV, UKRAINE - JANUARY 29, 2025 Nvidia corporation logotype showed on iPhone 15 smartphone display screen. Nvidia is a
Free with trial KYIV, UKRAINE - JANUARY 29, 2025 Nvidia corporation logotype showed on iPhone 15 smartphone display screen. Nvidia is a global leader in artificial intelligence hardware and software. Trend decrease illustrations KYIV, UKRAINE - JANUARY 29, 2025 Nvidia corporation logotype showed on iPhone 15 smartphone display screen. Nvidia is a
Free with trial KYIV, UKRAINE - JANUARY 29, 2025 Nvidia corporation logotype showed on iPhone 15 smartphone display screen. Nvidia is a global leader in artificial intelligence hardware and software. Trend decrease illustrations KYIV, UKRAINE - JANUARY 29, 2025 Nvidia corporation logotype showed on iPhone 15 smartphone display screen. Nvidia is a
Free with trial KYIV, UKRAINE - JANUARY 29, 2025 Nvidia corporation logotype showed on iPhone 15 smartphone display screen. Nvidia is a global leader in artificial intelligence hardware and software. Trend decrease illustrations KYIV, UKRAINE - JANUARY 29, 2025 Nvidia corporation logotype showed on iPhone 15 smartphone display screen. Nvidia is a
Free with trial KYIV, UKRAINE - JANUARY 29, 2025 Nvidia corporation logotype showed on iPhone 15 smartphone display screen. Nvidia is a global leader in artificial intelligence hardware and software. Trend decrease illustrations KYIV, UKRAINE - JANUARY 29, 2025 Nvidia corporation logotype showed on iPhone 15 smartphone display screen. Nvidia is a
Free with trial KYIV, UKRAINE - JANUARY 29, 2025 Nvidia corporation logotype showed on iPhone 15 smartphone display screen. Nvidia is a global leader in artificial intelligence hardware and software. Trend decrease illustrations KYIV, UKRAINE - JANUARY 29, 2025 Nvidia corporation logotype showed on iPhone 15 smartphone display screen. Nvidia is a
Free with trial Falling Sales Chart with Arrow and Flag, Financial Decline Concept, Losses. Trend decrease vectors Falling Sales Chart with Arrow and Flag, Financial Decline Concept, Losses
Free with trial The flag of UK with declining stock market graph and financial data overlay, symbolizing economic downturn, recession, or bearish market trends. Trend decrease illustrations The flag of UK with declining stock market graph and financial data overlay
Free with trial Abstract financial chart with red bars and lines representing market decline, emphasizing data analysis and economics. Generative AI. Trend decrease illustrations Abstract financial chart with red bars and lines representing market decline, emphasizing data analysis and economics
Free with trial Job ID: fba8760d-e973-412d-9011-a0e8d72a93ed. Trend decrease illustrations Colorful Bar Graph with Flags: Abstract Representation of Data and Trends. Job ID: fba8760d-e973-412d-9011-a0e8d72a93ed
Free with trial The flag of UAE with declining stock market graph and financial data overlay, symbolizing economic downturn, recession, or bearish market trends. Trend decrease illustrations The flag of UAE with declining stock market graph and financial data overlay
Free with trial The flag of USA with declining stock market graph and financial data overlay, symbolizing economic downturn, recession, or bearish market trends. Trend decrease illustrations The flag of USA with declining stock market graph and financial data overlay
Free with trial The flag of Oman with declining stock market graph and financial data overlay, symbolizing economic downturn, recession, or bearish market trends. Trend decrease illustrations The flag of Oman with declining stock market graph and financial data overlay
Free with trial The flag of Laos with declining stock market graph and financial data overlay, symbolizing economic downturn, recession, or bearish market trends. Trend decrease illustrations The flag of Laos with declining stock market graph and financial data overlay
Free with trial The flag of Mali with declining stock market graph and financial data overlay, symbolizing economic downturn, recession, or bearish market trends. Trend decrease illustrations The flag of Mali with declining stock market graph and financial data overlay
Free with trial The flag of Chad with declining stock market graph and financial data overlay, symbolizing economic downturn, recession, or bearish market trends. Trend decrease illustrations The flag of Chad with declining stock market graph and financial data overlay
Free with trial The flag of Cuba with declining stock market graph and financial data overlay, symbolizing economic downturn, recession, or bearish market trends. Trend decrease illustrations The flag of Cuba with declining stock market graph and financial data overlay