Free with trial An abstract representation of a financial chart displaying trends and data in vibrant orange against a dark background, Generative AI. Trend decrease illustrations An abstract representation of a financial chart displaying trends and data in vibrant orange against a dark background
Free with trial A sleek logo featuring the letter C integrated with chart bars, symbolizing financial growth and business analytics, suitable for finance or investment companies. Trend decrease vectors Vector art of modern logo design with letter c and chart bars, representing financial growth and business success in a minimalist. A sleek logo featuring the letter C integrated with chart bars, symbolizing financial growth and business analytics, suitable for finance or investment companies
Free with trial This image is generated using AI tool. Trend decrease illustrations Illustration of Declining Real Estate Market Showing Falling House Prices and Home Prices Fall. This image is generated using AI tool
Free with trial Digital tablet displaying real-time gold price chart with line graphs, market indicators. Investment analysis, financial market data, trading concept. Tablet is on gold bars financial. Trend decrease illustrations Digital tablet displaying real-time gold price chart with line graphs, market indicators. Investment analysis, financial market
Free with trial This vibrant red downward arrow graphic is perfectly isolated against a clean white background, making it ideal for various visual communication applications. The sharp, defined lines and bold color create a striking and impactful directional symbol, perfect for highlighting downward trends, discounts, or calls to action. Its simple, yet powerful design makes it suitable for use in presentations. Trend decrease illustrations Red Downward Arrow Icon Isolated on White Background Downloadable Stock Photo for Presentations Websites and Graphic. This vibrant red downward arrow graphic is perfectly isolated against a clean white background, making it ideal for various visual communication applications. The sharp, defined lines and bold color create a striking and impactful directional symbol, perfect for highlighting downward trends, discounts, or calls to action. Its simple, yet powerful design makes it suitable for use in presentations
Free with trial Vibrant red line indicates financial market decline on digital display. Chart shows stock market loss, economy decay, investment risk. Red graph pattern represents trading volatility. Trend decrease illustrations Vibrant red line indicates financial market decline on digital display. Chart shows stock market loss, economy decay, investment
Free with trial Two entrepreneurs created a business strategy to reduce project operational costs using laptops. Cost Reduction concept. trend modern vector flat illustration. Trend decrease vectors Two entrepreneurs created a business strategy to reduce project operational costs using laptops. Cost Reduction concept.
Free with trial Red stock chart with values sharply declining, highlighting financial crisis economic recession. Dramatic fall in market values is emphasized against dark background. Business and. Trend decrease illustrations Red stock chart with values sharply declining, highlighting financial crisis, economic recession. Dramatic fall in market values. Red stock chart with values sharply declining, highlighting financial crisis economic recession. Dramatic fall in market values is emphasized against dark background. Business and.
Free with trial Shopping cart with red downward arrow illustrating consumer spending drop and economic concern on turquoise background. Trend decrease illustrations Shopping cart with red downward arrow illustrating consumer spending drop and economic concern on turquoise background
Free with trial A set of linear icons depicting financial growth, including upward arrows, charts, and currency symbols, representing economic progress and investment trends on white. Trend decrease vectors Vector art of financial growth icons a collection of symbols representing economic progress, investment, and market trends. A set of linear icons depicting financial growth, including upward arrows, charts, and currency symbols, representing economic progress and investment trends on white
Free with trial A stark image depicting the perilous decline of financial markets. A red arrow, plummeting towards a scattering of coins on a rustic wooden table, symbolizes the devastating impact of a market crash. This visual metaphor effectively captures the loss of wealth and investment value during an economic downturn. The image represents a crucial juncture in the financial landscape, highlighting the. Trend decrease illustrations Financial Market Downturn Red Arrow Plunging Towards Coins on Wooden Table A Visual Representation of Investment Loss. A stark image depicting the perilous decline of financial markets. A red arrow, plummeting towards a scattering of coins on a rustic wooden table, symbolizes the devastating impact of a market crash. This visual metaphor effectively captures the loss of wealth and investment value during an economic downturn. The image represents a crucial juncture in the financial landscape, highlighting the
Free with trial White sugar cubes pile up on dark surface. Blurry financial stock market chart with red green candlestick lines appears in background. Image commodity prices market trends, global. Trend decrease illustrations White sugar cubes pile up on dark surface. Blurry financial stock market chart with red green candlestick lines appears in
Free with trial Businessman pointing at a digital interface with interactive graphs showing quality and cost, where quality is increasing and cost is decreasing, representing trends in business performance, set in a professional and modern workspace. Trend decrease illustrations Businessman interacting with a digital interface showing quality and cost graphs with arrows pointing up and down. businessman pointing at a digital interface with interactive graphs showing quality and cost, where quality is increasing and cost is decreasing, representing trends in business performance, set in a professional and modern workspace
Free with trial Close-up graphic of financial market graph with dynamic lines. Represents investment volatility, uncertainty, stock price fluctuations. Concept of business success, growth failure in. Trend decrease illustrations Close-up graphic of financial market graph with dynamic lines. Represents investment volatility, uncertainty, stock price
Free with trial The image captures a close-up view of someone examining financial charts on a screen, possibly for making trading or investment decisions, emphasizing the data-driven nature of finance. Trend decrease illustrations A person analyzing financial market charts on a screen, possibly for investment or trading decisions. Data-driven finance concept. The image captures a close-up view of someone examining financial charts on a screen, possibly for making trading or investment decisions, emphasizing the data-driven nature of finance
Free with trial Colorful 3D bar chart illustration on blue background with red, orange, yellow, turquoise bars. Simple, clean geometric shapes represent statistics, business data for reports. Trend decrease illustrations Colorful 3D bar chart illustration on blue background with red, orange, yellow, turquoise bars. Simple, clean geometric shapes
Free with trial Abstract 3D blue graph representing market data fluctuations over time, showing peaks and valleys on a financial report, detailed background Generative AI. Trend decrease illustrations Abstract 3D blue graph representing market data fluctuations over time, showing peaks and valleys on a financial report
Free with trial Miniature shopping cart with red upward trending arrow declining retail sales, negative economic trends. Conceptual image represents falling consumer spending, market downturn financial. Trend decrease illustrations Miniature shopping cart with red upward trending arrow declining retail sales, negative economic trends. Conceptual image
Free with trial A building displays stock market information with red falling arrows and declining percentages, indicating a downward trend for economic visualizations. Trend decrease illustrations Stock Market Building with Falling Numbers and Arrows. A building displays stock market information with red falling arrows and declining percentages, indicating a downward trend for economic visualizations
Free with trial 3D Illustration Business Graph Chart Growth Success Analysis Finance Investment Strategy Data Market Stock Economy Trading Financial Progress Report. Trend decrease illustrations 3D Illustration Business Graph Chart Growth Success Analysis Finance Investment Strategy Data Market Stock Economy Trading
Free with trial Candlestick chart showing a downtrend, indicating a bear market and potential financial crisis Generated using AI, Bear Market Candlestick Chart Displaying Downtrend on Blue Screen Concept of Financial Crisis, Stock Market Crash, and Economic Recession. Trend decrease illustrations Bear Market Candlestick Chart Displaying Downtrend on Blue Screen Concept of Financial Crisis, Stock Market Crash, and Economic
Free with trial Reduction chart icon vector icon on white background. EPS10. Trend decrease vectors Reduction chartline in Thin line black color. flat simple vector symbols illustration. Reduction chart icon vector icon on white background. EPS10
Free with trial Reduction chart icon vector icon on white background. EPS10. Trend decrease vectors Reduction chartline in Thin line black color. flat simple vector symbols illustration. Reduction chart icon vector icon on white background. EPS10
Free with trial Reduction chart icon vector icon on white background. EPS10. Trend decrease vectors Reduction chartline in Thin line black color. flat simple vector symbols illustration. Reduction chart icon vector icon on white background. EPS10
Free with trial Reduction chart icon vector icon on white background. EPS10. Trend decrease vectors Reduction chartline in Thin line black color. flat simple vector symbols illustration. Reduction chart icon vector icon on white background. EPS10
Free with trial Reduction chart icon vector icon on white background. EPS10. Trend decrease vectors Reduction chartline in Thin line black color. flat simple vector symbols illustration. Reduction chart icon vector icon on white background. EPS10
Free with trial Reduction chart icon vector icon on white background. EPS10. Trend decrease vectors Reduction chartline in Thin line black color. flat simple vector symbols illustration. Reduction chart icon vector icon on white background. EPS10
Free with trial Three-Dimensional Red Arrow Icon PNG, 3d Glossy Red arrow Point curving to the right downward. Trend decrease vectors Three Dimensional Red Arrow Icon PNG, 3d Glossy Red arrow Point curving to the right Downward
Free with trial Three-Dimensional Red Arrow Icon PNG, 3d Glossy Red arrow Point curving to the right downward. Trend decrease vectors Three Dimensional Red Arrow Icon PNG, 3d Glossy Red arrow Point curving to the right Downward
Free with trial Photo shows melting glacier with economic graph superimposed. Visualizes environmental changes, climate impact. Global warming effect on finance industries apparent. Image crisis. Trend decrease illustrations Photo shows melting glacier with economic graph superimposed. Visualizes environmental changes, climate impact. Global warming
Free with trial Three amber translucent cubes, each featuring a white checkmark or flag icon, are arranged on a clean white background. Trend decrease illustrations Three amber translucent cubes with checkmark and flag icons on a white background. Three amber translucent cubes, each featuring a white checkmark or flag icon, are arranged on a clean white background
Free with trial Reduction chart icon vector icon on white background. EPS10. Trend decrease vectors Reduction chartline in Thin line black color. flat simple vector symbols illustration. Reduction chart icon vector icon on white background. EPS10
Free with trial A 3D representation of a document displaying a bar chart and a dotted line graph, indicating data trends and analysis. A small, rounded icon featuring a landscape with mountains and a sun is placed ab. Trend decrease illustrations 3d infographic showing a document with a bar chart and line graph, alongside a small image icon, isolated on white background. A 3D representation of a document displaying a bar chart and a dotted line graph, indicating data trends and analysis. A small, rounded icon featuring a landscape with mountains and a sun is placed ab
Free with trial Reduction chart icon vector icon on white background. EPS10. Trend decrease vectors Reduction chartline in Thin line black color. flat simple vector symbols illustration. Reduction chart icon vector icon on white background. EPS10
Free with trial Reduction chart icon vector icon on white background. EPS10. Trend decrease vectors Reduction chartline in Thin line black color. flat simple vector symbols illustration. Reduction chart icon vector icon on white background. EPS10
Free with trial Watercolor illustration of business growth. Orange bar, pie charts on aged paper show data analysis, market trends, financial progress. Visuals represent success, planning strategic. Trend decrease illustrations Watercolor illustration of business growth. Orange bar, pie charts on aged paper show data analysis, market trends, financial
Free with trial This 3d image of a floating golden dollar coin over a falling arrow shows flying signs of financial loss value drop and market downturn in a modern clean economic concept. Trend decrease illustrations A floating dollar coin with a downward arrow represents flying financial signs of loss decline and economic downfall in 3d. this 3d image of a floating golden dollar coin over a falling arrow shows flying signs of financial loss value drop and market downturn in a modern clean economic concept
Free with trial This 3d illustration of a floating dollar coin with a flying downward arrow line represents signs of market decline loss in value and financial downturn in a visual economic concept. Trend decrease illustrations A floating dollar coin with a purple down arrow shows flying signs of financial loss and currency devaluation in 3d design. this 3d illustration of a floating dollar coin with a flying downward arrow line represents signs of market decline loss in value and financial downturn in a visual economic concept
Free with trial Economic financial downturn in 2025 chart down forecast crisis market crash prediction vector. Trend decrease vectors Economic financial downturn in 2025 chart down forecast crisis market crash prediction
Free with trial Economic downturn in 2025 chart down candle stick bearish stock crypto market prediction vector. Trend decrease vectors Economic downturn in 2025 chart down candle stick bearish stock crypto market prediction
Free with trial A vivid red graph with descending lines, illuminated arrows, and vibrant data points illustrating a sharp fall in digital investment performance, capturing economic uncertainty. Trend decrease illustrations Digital financial market decline depicted by red downward-trending stock chart with glowing arrows and data visualization. A vivid red graph with descending lines, illuminated arrows, and vibrant data points illustrating a sharp fall in digital investment performance, capturing economic uncertainty
Free with trial A dark oil storage container set against a backdrop of fluctuating financial graphs, highlighted by a sharp red arrow pointing downward, illustrating a market decline. Trend decrease illustrations Black oil barrel with a red declining arrow and financial chart in the background symbolizing falling crude oil prices and market. A dark oil storage container set against a backdrop of fluctuating financial graphs, highlighted by a sharp red arrow pointing downward, illustrating a market decline
Free with trial Closeup view of a pen resting on graph, suggesting data analysis or business planning ,Generative AI. Trend decrease illustrations Detailed view of a pen placed on graph, depicting financial analysis, business planning, and data interpretation for strategic. Closeup view of a pen resting on graph, suggesting data analysis or business planning ,Generative AI
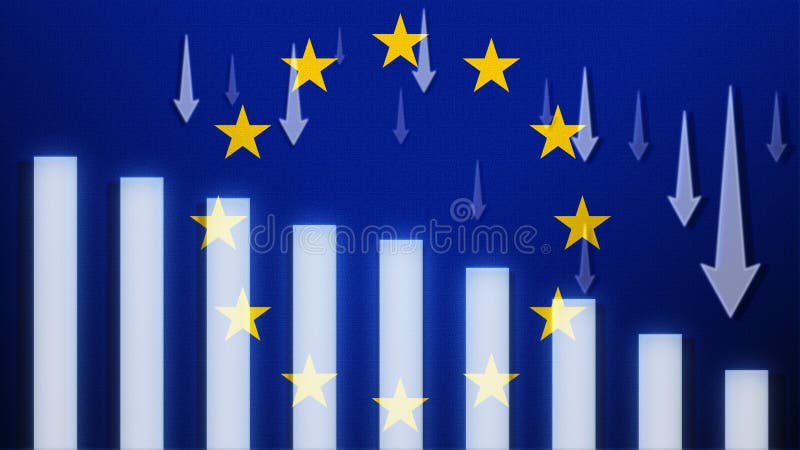
Free with trial EU flag with a declining bar chart and down arrows, symbolizing decline in data, performance, or various indicators. Trend decrease illustrations Flag with a declining bar chart and down arrows, symbolizing decline in data, performance, or various indicators in the country. EU flag with a declining bar chart and down arrows, symbolizing decline in data, performance, or various indicators
Free with trial Red arrow plunges downward, financial charts graphs blurred background. Sharp decline percentage market value. Crisis, economic downturn, recession, business losses falling market. Trend decrease illustrations Red arrow plunges downward, financial charts graphs blurred background. Sharp decline percentage market value. Crisis, economic
Free with trial Percentage symbols on coin stacks with red chart arrow going down. Economic recession crisis, inflation, financial loss concept. Represents decreasing interest rates, investment market. Trend decrease illustrations Percentage symbols on coin stacks with red chart arrow going down. Economic recession crisis, inflation, financial loss concept.
Free with trial Businessman flat design, loss and gain on investment, profit or lose money from stock, financial green and red arrow chart concept. Vector. Trend decrease vectors Businessman flat design, loss and gain on investment, profit or lose money from stock, financial green and red arrow chart concept
Free with trial Visualize the dynamic world of cryptocurrency trading with this compelling 3D illustration. A mobile phone screen dominates the composition, showcasing intricate candlestick charts alongside prominent buy and sell buttons, all set against a sophisticated dark blue background. This imagery captures the essence of online trading, finance, and investment strategies. Perfect for illustrating concepts. Trend decrease illustrations Cryptocurrency trading concept displaying a mobile phone screen with candlestick charts buy and sell buttons over a dark blue. Visualize the dynamic world of cryptocurrency trading with this compelling 3D illustration. A mobile phone screen dominates the composition, showcasing intricate candlestick charts alongside prominent buy and sell buttons, all set against a sophisticated dark blue background. This imagery captures the essence of online trading, finance, and investment strategies. Perfect for illustrating concepts
Free with trial Close-up shot of stock market chart with upward and downward trends. Red and blue lines over keyboard show dynamic financial data on screen. Economic analysis forecasting. Trend decrease illustrations Close-up shot of stock market chart with upward and downward trends. Red and blue lines over keyboard show dynamic financial data
Free with trial A wall display of framed blue data charts and graphs showing various financial trends and statistical information. A captivating fusion of imagination and modern design aesthetics. Generative AI. Trend decrease illustrations A wall display of framed blue data charts and graphs showing various financial trends and statistical information. Generative AI. A wall display of framed blue data charts and graphs showing various financial trends and statistical information. A captivating fusion of imagination and modern design aesthetics. Generative AI
Free with trial Concept of economic collapse by falling graph, chart, highlighting global recession fueled by inflation, stock market crash, financial crisis, falling income, GDP decline, capital reduction. Trend decrease illustrations Concept of economic collapse by falling graph, chart, highlighting global recession fueled by inflation, stock market crash
Free with trial Business financial decline chart showing significant loss. Hand draws a downward orange arrow on a dark blue chalkboard with ample copy space. Ideal for economic analysis, corporate presentations, and marketing materials. Trend decrease illustrations Business Financial Decline Chart. Hand drawing bar graph with downward orange arrow on blue chalkboard background, copy space. Business financial decline chart showing significant loss. Hand draws a downward orange arrow on a dark blue chalkboard with ample copy space. Ideal for economic analysis, corporate presentations, and marketing materials.
Free with trial Global inflation trends shown on digital screen world map. Macroeconomic research paper presents finance economy data analysis. Study report shows online statistic, monitoring graph of. Trend decrease illustrations Global inflation trends shown on digital screen world map. Macroeconomic research paper presents finance economy data analysis.
Free with trial Business strategy with digital tech tools. Hands working on tablet analyzing data, graphs for cost management. Planning effective project management data analysis. Improving business. Trend decrease illustrations Business strategy with digital tech tools. Hands working on tablet analyzing data, graphs for cost management. Planning effective
Free with trial Red arrow going down stock icon on white background. Bankruptcy, financial market crash icon for your web site design, logo, app, UI. graph chart down trend symbol. chart going down sign. Trend decrease vectors Red arrow going down stock icon on white background. Bankruptcy, financial market crash icon for your web site design
Free with trial Red arrow going down stock icon on white background. Bankruptcy, financial market crash icon for your web site design, logo, app, UI. graph chart down trend symbol. chart going down sign. Trend decrease vectors Red arrow going down stock icon on white background. Bankruptcy, financial market crash icon for your web site design
Free with trial A percentage graph visually represents statistical data, showcasing trends, growth, and performance metrics for analysis and decision-making processes. Trend decrease vectors Vector art of a percentage graph illustrates statistical data, representing growth, progress, and performance analysis in a visual. A percentage graph visually represents statistical data, showcasing trends, growth, and performance metrics for analysis and decision-making processes
Free with trial This image is generated using AI tool. Trend decrease illustrations Illustration of Declining Real Estate Market Showing Falling House Prices and Home Prices Fall. This image is generated using AI tool
Free with trial This image is generated using AI tool. Trend decrease illustrations Illustration of Declining Real Estate Market Showing Falling House Prices and Home Prices Fall. This image is generated using AI tool
Free with trial This image is generated using AI tool. Trend decrease illustrations Illustration of Declining Real Estate Market Showing Falling House Prices and Home Prices Fall. This image is generated using AI tool
Free with trial This image is generated using AI tool. Trend decrease illustrations Illustration of Declining Real Estate Market Showing Falling House Prices and Home Prices Fall. This image is generated using AI tool
Free with trial This image is generated using AI tool. Trend decrease illustrations Illustration of Declining Real Estate Market Showing Falling House Prices and Home Prices Fall. This image is generated using AI tool
Free with trial This image is generated using AI tool. Trend decrease illustrations Illustration of Declining Real Estate Market Showing Falling House Prices and Home Prices Fall. This image is generated using AI tool
Free with trial This image is generated using AI tool. Trend decrease illustrations Illustration of Declining Real Estate Market Showing Falling House Prices and Home Prices Fall. This image is generated using AI tool
Free with trial Simple black arrow points down on plain white background. Minimalist design suggests direction. Illustration suitable for graphic design projects, business presentations tech. Trend decrease illustrations Simple black arrow points down on plain white background. Minimalist design suggests direction. Illustration suitable for graphic
Free with trial This image represents education costs and student debt, highlighting financial challenges for students. It features graphs, coins, and a graduation cap symbol. Trend decrease vectors Vector art of a visual representation of education costs and student debt, highlighting the financial challenges faced by students. This image represents education costs and student debt, highlighting financial challenges for students. It features graphs, coins, and a graduation cap symbol
Free with trial Downward trending line graph displayed on digital screen. Financial decline visualized with red charts numbers representing loss. Business downturn economic recession or market. Trend decrease illustrations Downward trending line graph displayed on digital screen. Financial decline visualized with red charts numbers representing loss.
Free with trial Description: This abstract image represents the concept of a financial crisis in the stock market, with a gold arrow pointing downwards on a blue background. The downtrend symbolizes a decline in stock prices and economic instability. The contrasting colors of gold and blue create a visually striking and impactful representation of the unpredictable nature of financial markets. This image conveys themes of uncertainty, risk, and the interconnectedness of global economies. Trend decrease illustrations Abstract financial stock market trading chart with gold arrow downtrend on blue background. Description: This abstract image represents the concept of a financial crisis in the stock market, with a gold arrow pointing downwards on a blue background. The downtrend symbolizes a decline in stock prices and economic instability. The contrasting colors of gold and blue create a visually striking and impactful representation of the unpredictable nature of financial markets. This image conveys themes of uncertainty, risk, and the interconnectedness of global economies.
Free with trial A crane lifts a shipping container with a falling graph shadow behind it, symbolizing economic downturn, market decline, and global trade issues. a visual representation of financial crisis. Trend decrease illustrations Usa china international trade war shipping container crane with falling graph shadow representing economic downturn and market ... a crane lifts a shipping container with a falling graph shadow behind it, symbolizing economic downturn, market decline, and global trade issues. a visual representation of financial crisis
Free with trial A handheld smartphone showing a steep market downturn, highlighted by vivid crimson shades, capturing the tense moment of economic chaos and stock declines. Trend decrease illustrations Mobile device displaying a dramatic sharp decline in financial market chart with intense red tones symbolizing economic loss or. A handheld smartphone showing a steep market downturn, highlighted by vivid crimson shades, capturing the tense moment of economic chaos and stock declines
Free with trial A vibrant depiction of the American flag overlaid with financial graphs, conveying economic activity and market fluctuations. The colors are bold and dynamic, reflecting financial markets' volatile nature and patriotic symbolism. Trend decrease illustrations American flag merged with fluctuating financial graph, symbolizing economic trends and stock market dynamics. A vibrant depiction of the American flag overlaid with financial graphs, conveying economic activity and market fluctuations. The colors are bold and dynamic, reflecting financial markets' volatile nature and patriotic symbolism.
Free with trial Animated Stream Of Interfaces With Economic and stock information red and yellow color, speculation fall. Trend decrease illustrations Animated Stream Of Interfaces With Economic and stock information red and yellow color, speculation fall
Free with trial Animated Stream Of Interfaces With Economic and stock information red and yellow color, speculation fall. Trend decrease illustrations Animated Stream Of Interfaces With Economic and stock information red and yellow color, speculation fall
Free with trial Animated Stream Of Interfaces With Economic and stock information red and yellow color, speculation fall. Trend decrease illustrations Animated Stream Of Interfaces With Economic and stock information red and yellow color, speculation fall
Free with trial Animated Stream Of Interfaces With Economic and stock information red and yellow color, speculation fall. Trend decrease illustrations Animated Stream Of Interfaces With Economic and stock information red and yellow color, speculation fall
Free with trial Animated Stream Of Interfaces With Economic and stock information red and yellow color, speculation fall. Trend decrease illustrations Animated Stream Of Interfaces With Economic and stock information red and yellow color, speculation fall
Free with trial Flag with a declining bar chart and down arrows, symbolizing decline in data, performance, or various national indicators in the. Trend decrease illustrations Flag with a declining bar chart and down arrows, symbolizing decline in data, performance, or various national indicators in the
Free with trial Gambia flag with a declining bar chart and down arrows, symbolizing decline in data, performance, or various national indicators. Trend decrease illustrations Flag with a declining bar chart and down arrows, symbolizing decline in data, performance, or various national indicators in the
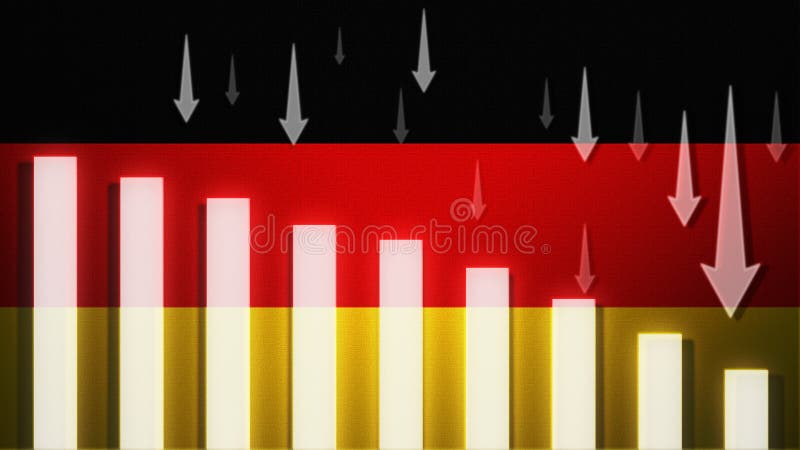
Free with trial Germany flag with a declining bar chart and down arrows, symbolizing decline in data, performance, or various national indicators. Trend decrease illustrations Flag with a declining bar chart and down arrows, symbolizing decline in data, performance, or various national indicators in the